APRA released their quarterly property exposures data to Jun 2019 today. We can see some of the moving parts in the Industry, though only at an aggregated levels.
At the top level we can see the impact of APRA first imposing restrictions on investment lending in 2015, and later in 2017 on interest only loans. The subsequent loosening of standards which APRA introduced has yet to hit the statistics.
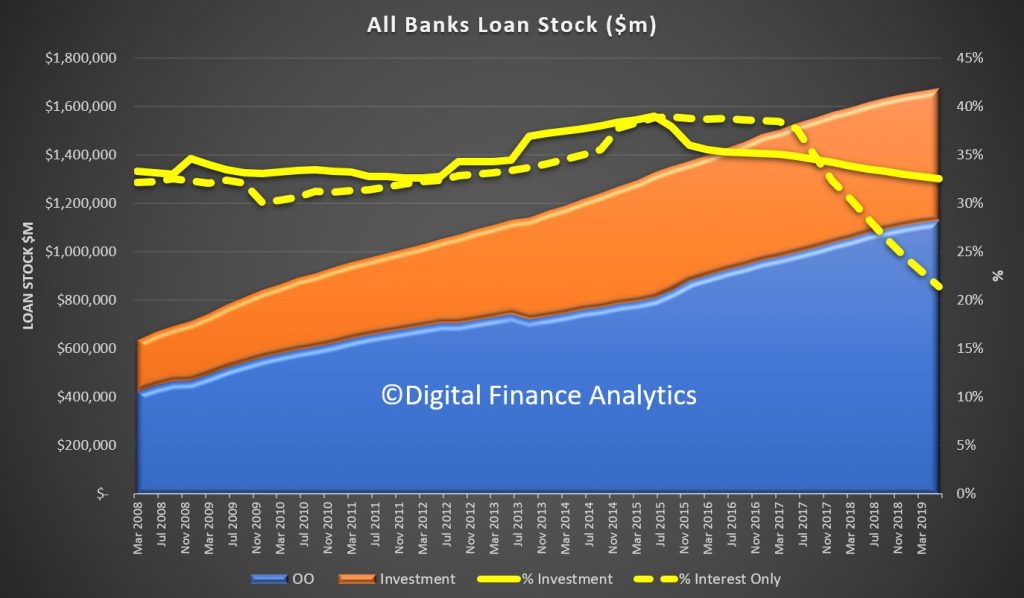
We can see that mortgage lending growth did slow thanks to their measures, with total ADI mortgages at $1.67 trillion, comprising $547 billion of investor loans and $359 billion of interest only loans. This translates to 32.6% of loans being for investment purposes (still too high) and 21.4% of all mortgages being interest only. Not disclosed is the distribution of interest only loans between owner occupied and investment loans, but we can assume most are investment related.
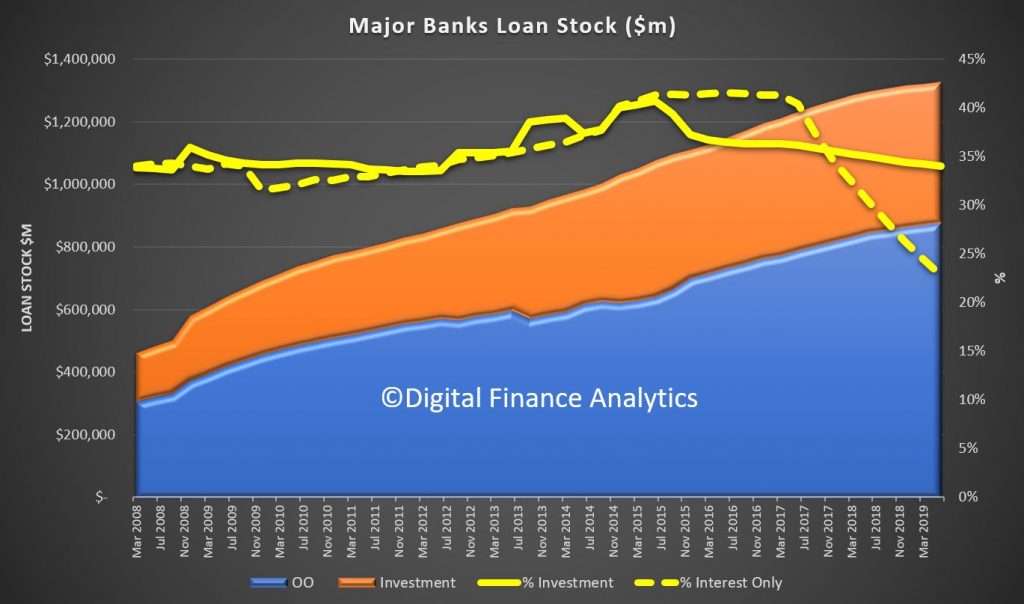
We can pull out the same data for the four major banks. Here total loans are $1.33 trillion, with $452 billion being investment loans and $303 billion being interest only, giving a 34% share of investment loans and 22.8% of interest only loans, so they still have a larger share of investment loans and IO loans relative to the market. No bank level data is disclosed, though we know Westpac has a larger share of investment loans, and we assume interest only loans too.
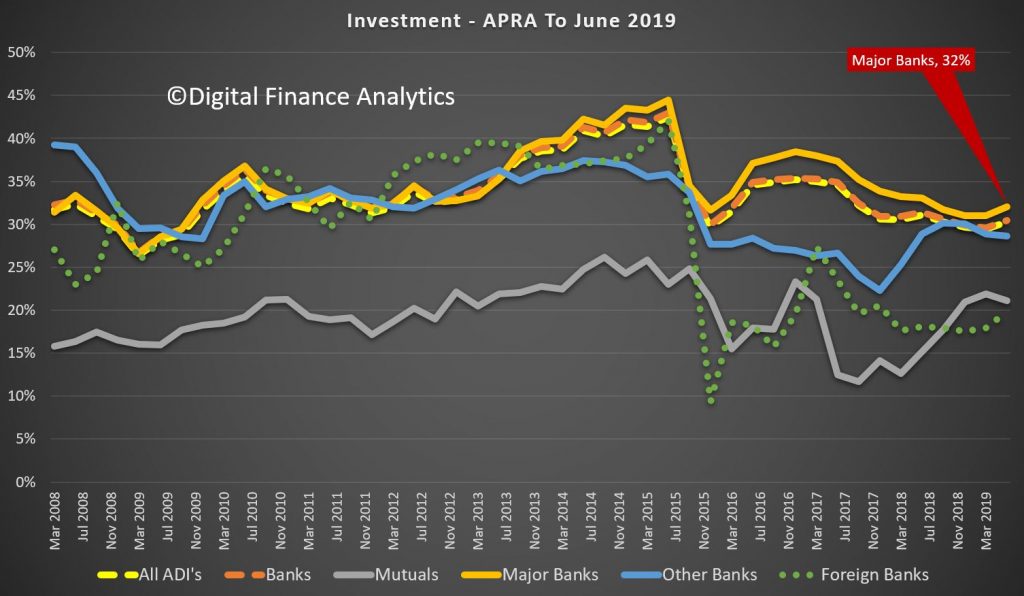
We can then look at the new lending flows across the various lender types. The flow of new investment loans is running at 32% to June, and is rising (we expect it will be even higher next time as the APRA loosening is executed). As a result mutuals are writing a lower share of investment loans now.
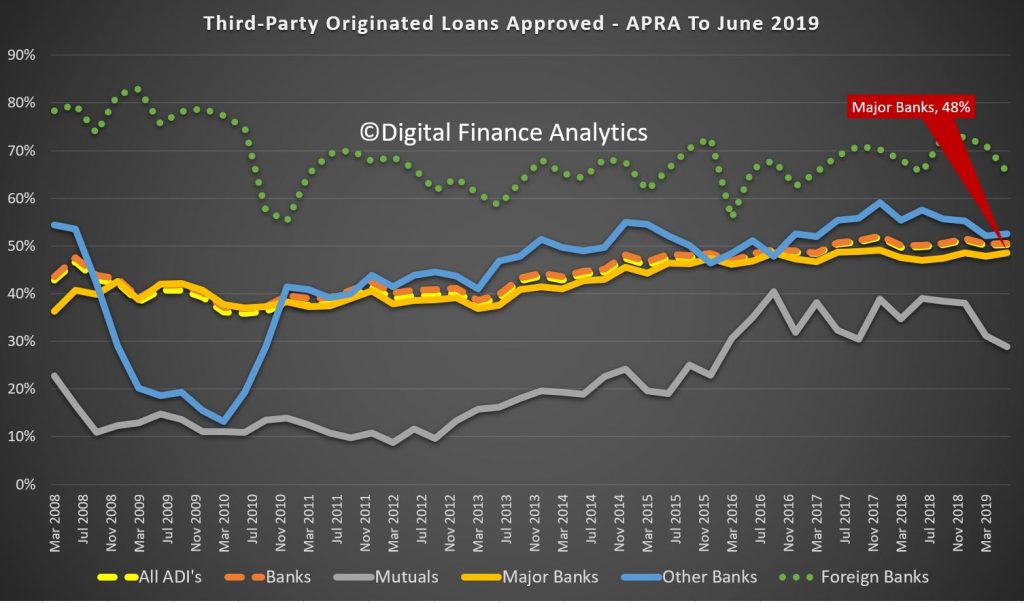
The proportion of new loans via Brokers varies by lender category, with foreign banks sitting around 65%, compared with the 48% of major banks. Mutuals are seeing a fall, as competition from majors increases.
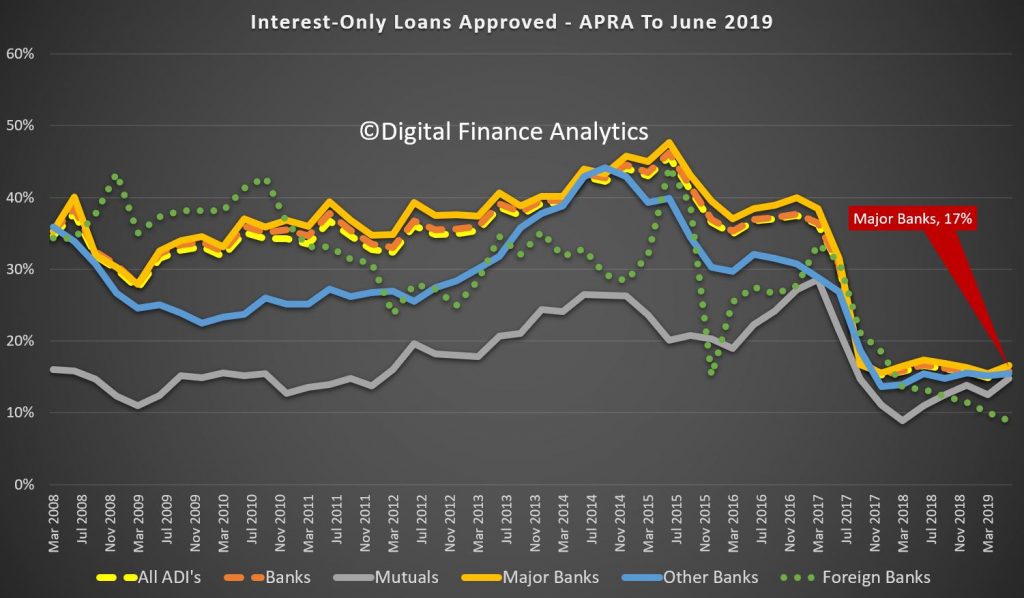
The proportion of new interest only loans is at around 17% for most lender types, with foreign banks writing less. Mutuals are writing more IO loans now.
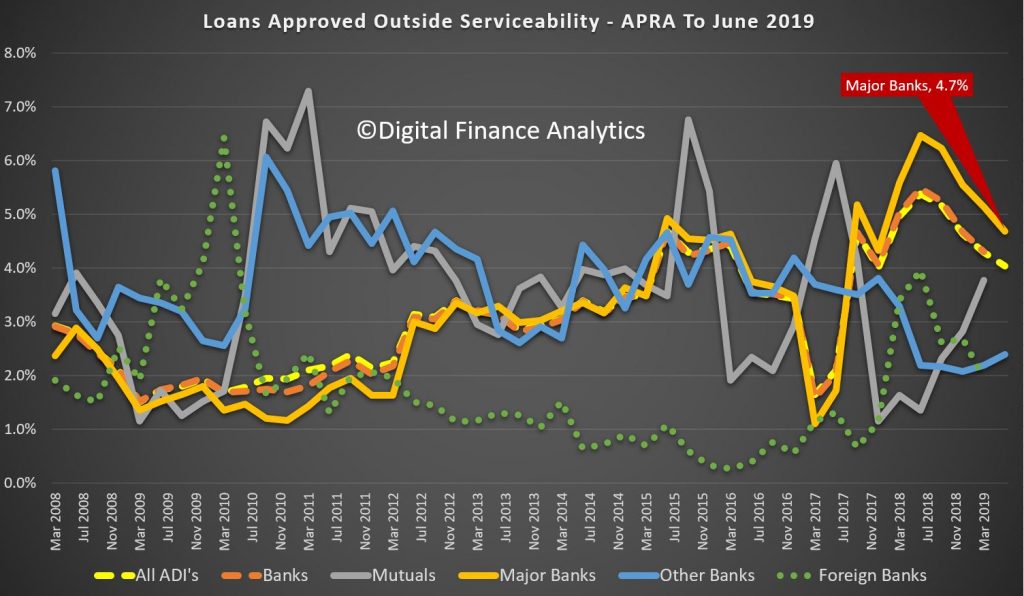
Loans written outside serviceability has fallen across the industry, though major banks are still at 4.7%, and above the other lender types. Mutuals are writing more, as they attempt to gain share in the increasingly competitive market. There are higher risks in these loans.
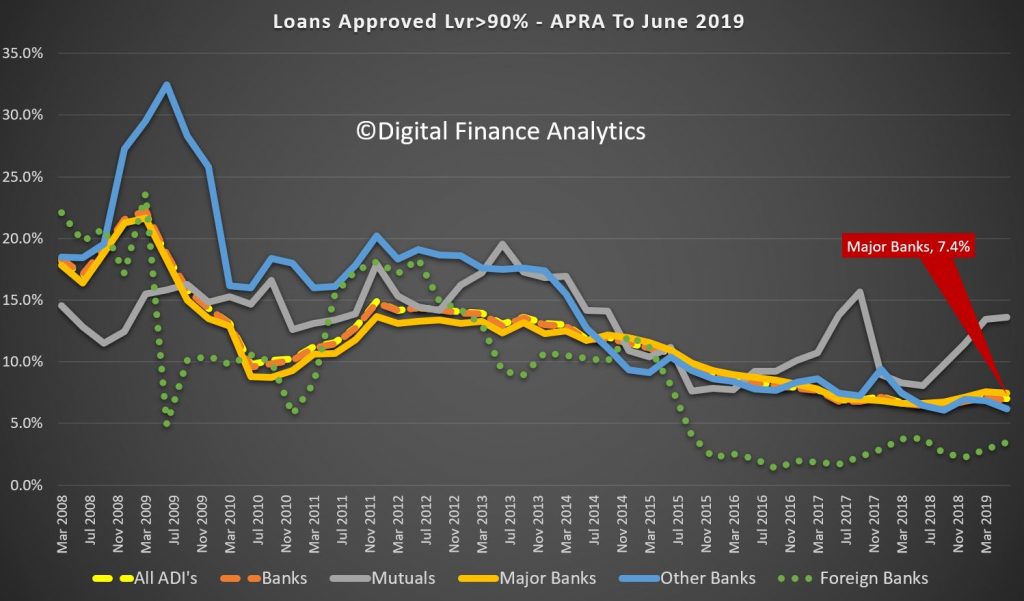
Finally, we can look across the loan to value bands, at time of origination.
Major banks are writing around 7.4% of loans above 90%, compared to mutuals at 13% – once again showing mutuals having to break their rules more often to win business.
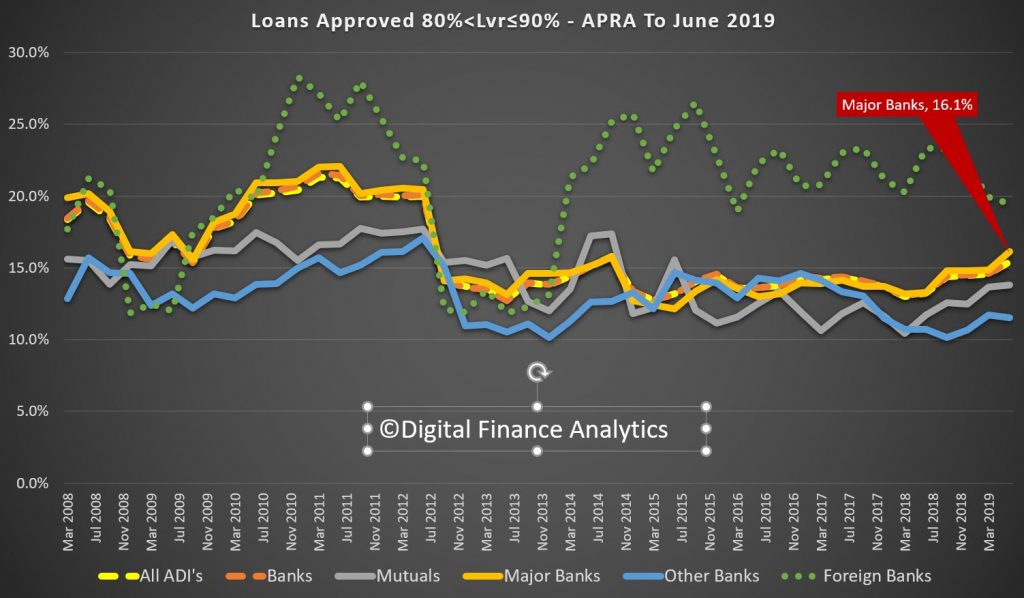
In the 80-90 bands, majors are at 16.1% and rising.
Nearly half of all loans written are around 50% of loan to value ratio – here the best deals are on offer, so refinancing is quite strong. There is little variation across the lender segments.
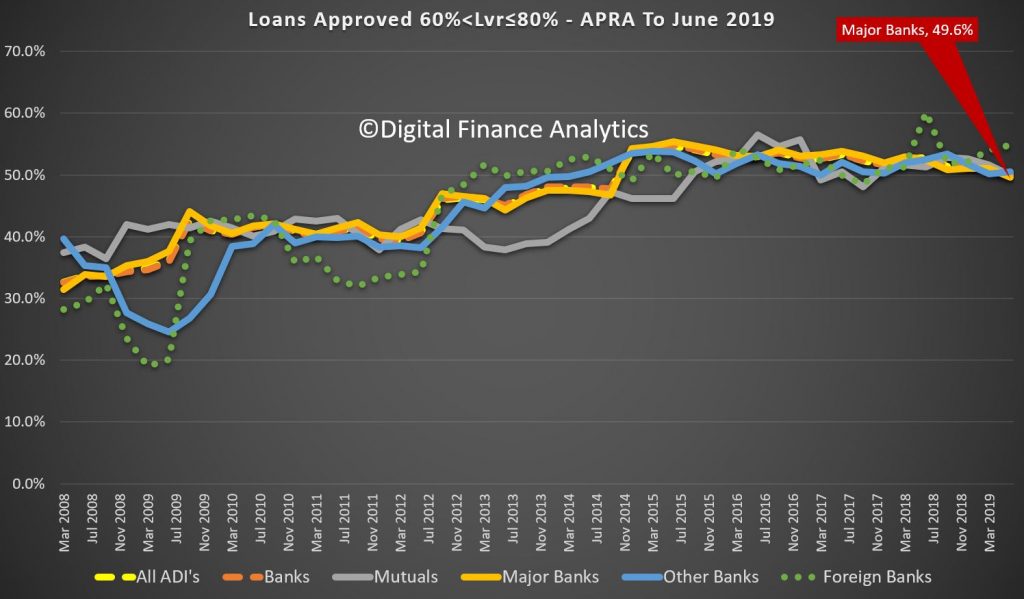
The lower LVR bands are around 26%, with other banks (including regionals) a little higher.
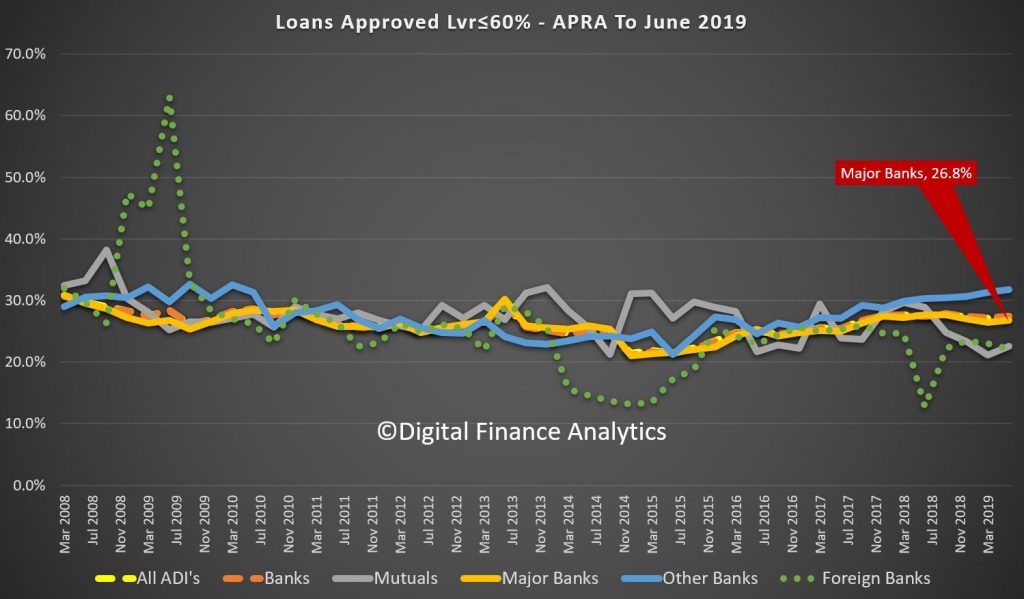
So this data suggests that mutuals are under pressure, the effect of the APRA tightening is obvious, the question now will be how this changes in the new “you set the risk” environment. It appears from our data lenders are more willing now, so we will be watching the serviceability and LVR metrics. But loan volumes remain constrained, which will limit potential excesses, at least for a time.
