The RBA data for November 2017 was released today. The financial aggregates shows that mortgage lending momentum is easing a little, but more slowly than bank lending, suggesting that the non-bank sector is taking up much of the slack. In addition, more loans were reclassified in the month, taking the total to an amazing $61 billion. Total mortgages are now at $1.71 trillion, another record. Overall growth is still much higher than wage growth, so household debt levels will continue to climb.
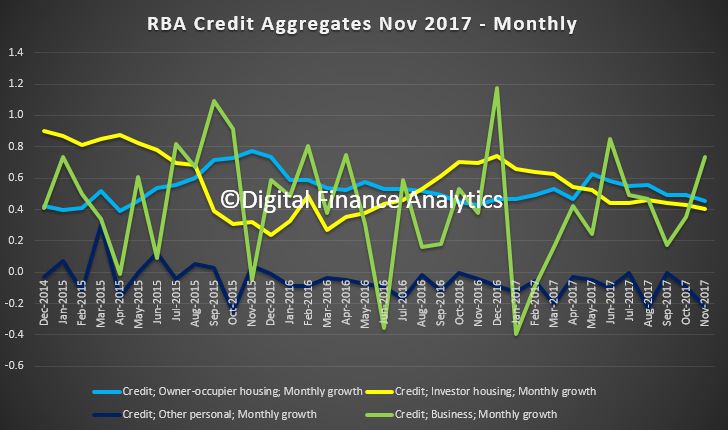
The monthly trends are pretty clear, if noisy.
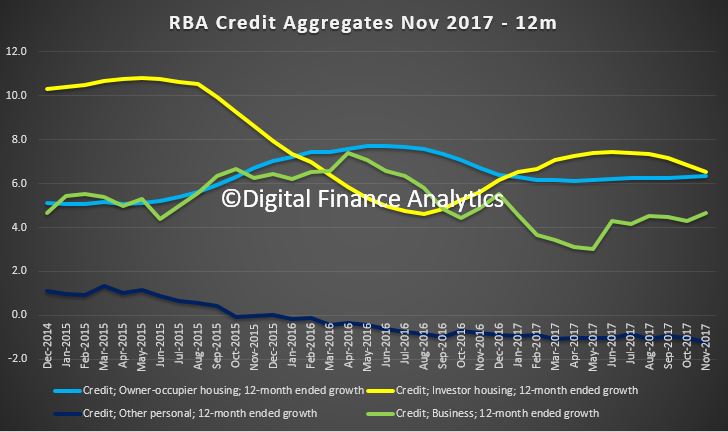
 The 12 month view irons out the noise and shows that investor lending has fallen to an annual rate of 6.5%, compared with owner occupied lending at 6.3%. Total housing lending grew at 6.4%. Business lending is lower, at 4.7% and personal lending down 1.2%.
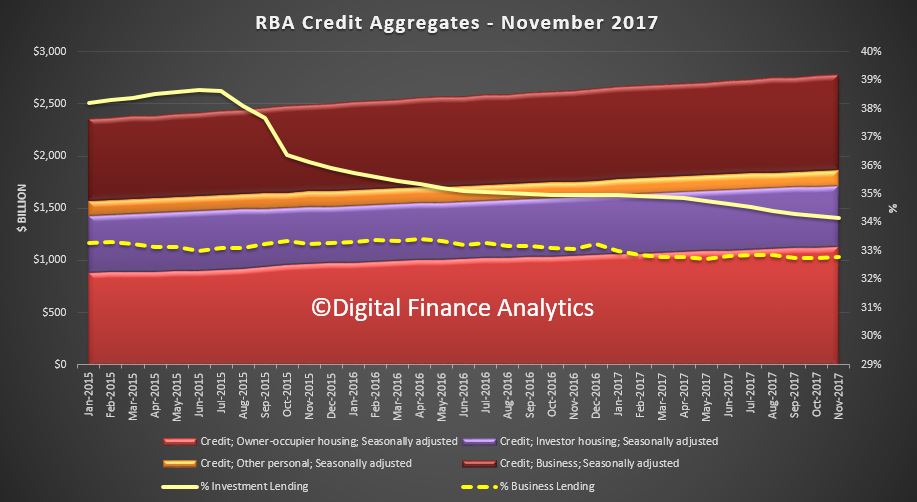
 Looking at the values involved, total mortgage lending rose to $1.71 trillion, and investor loans fell to 34.1% of balances, still too high.
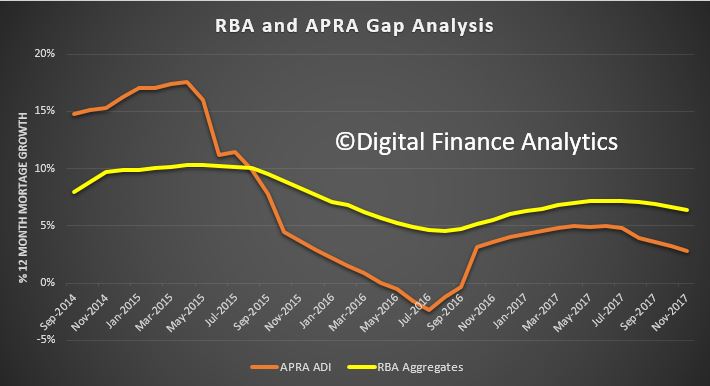
 Two interesting points to make. First, it is clear mortgage momentum is being support by the non-bank sector, as the RBA aggregate data is significantly higher than the ADI growth from APRA. We have plotted the gap between the two on a 12 month rolling basis.
 Second, there is still more “tweakage” in the numbers as loans are re-classified. Total to date now $61 billion, a large proportion of investor loans!
Following the introduction of an interest rate differential between housing loans to investors and owner-occupiers in mid-2015, a number of borrowers have changed the purpose of their existing loan; the net value of switching of loan purpose from investor to owner-occupier is estimated to have been $61 billion over the period of July 2015 to November 2017, of which $1.2 billion occurred in November 2017. These changes are reflected in the level of owner-occupier and investor credit outstanding. However, growth rates for these series have been adjusted to remove the effect of loan purpose changes.
