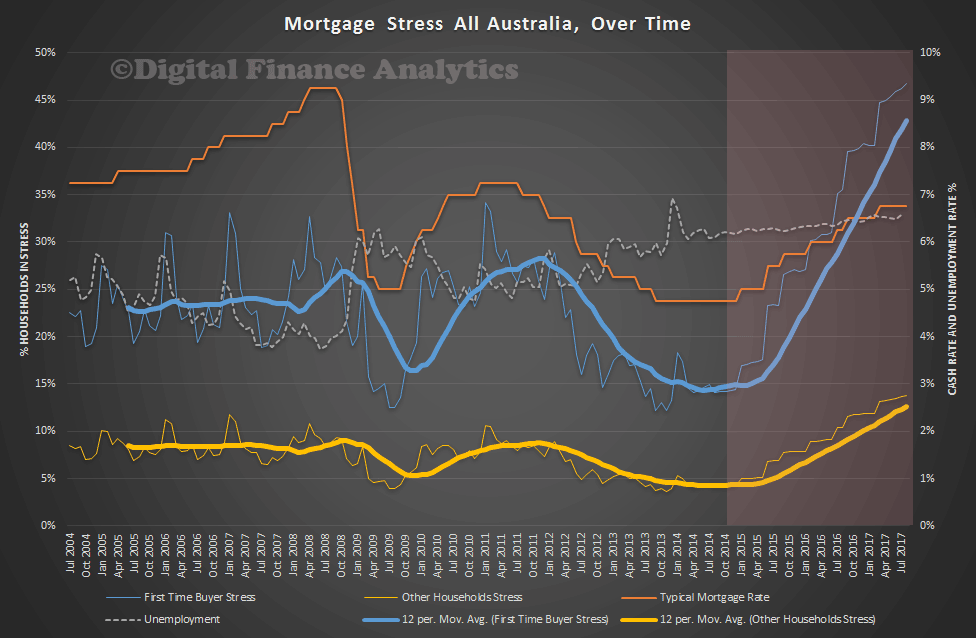
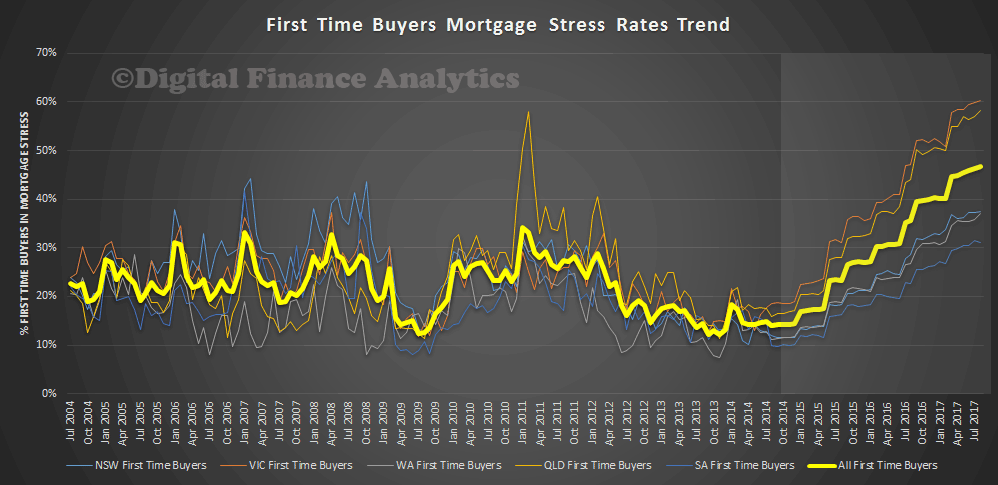
We have updated our mortgage stress models, to take account of the latest tranche of economic data, including falling real incomes, potential uplifts in capital requirements and inflation running hot, so creating the need to lift interest rates; and demand for property continuing to go ahead of supply. Our recent post the Anatomy of Mortgage Stress explains our modelling assumptions, and importantly the definitions of stress we are using. We also explained why households are highly vulnerable to mortgage stress, because of larger loans, and flat incomes in our article If The Worm Turns. Today we will look at our projections out to 2017, once we factor in these various drivers. It is only one scenario, but this is our central case.
We use a series of questions to diagnose mortgage stress focusing on owner occupied households. Through these questions we identify two levels of stress – Mild and Severe.
- Mild = households maintaining repayments, but by reprioritising expenditure, borrowing more on loans or cards, and refinancing
- Severe = households who are behind with their repayments, are trying to sell, are trying to refinance, or who are being foreclosed
First we will look at the Australia-wide projections. We expect to see stress amongst first time buyers lift considerably from its current relative low levels. If rates do rise, unemployment stays high, and incomes continue to languish, then by 2017, we think that 40% of first time buyers will be in mortgage stress. Many who brought in the 2008-2009 boom are likely to be hardest hit. More recently the number of first time buyers has fallen to a long term low, so the number of more recent first time buyer households in stress will be lower.
 We can look at the state variations. We see that VIC and QLD first time buyers are more likely to be impacted, whilst SA households less so, with WA and NSW first time buyer households sitting in the middle. This is partly a function of absolute house prices, and partly a function of income and unemployment trends across the states. We did not include the smaller states on the chart, but they are included in the average.
 Finally, we look at the other, non-first time buyer households. Many continue to pay more than the minimum monthly mortgage repayments, taking advantage of the current low rates so they have some protection. However, as rates and unemployment bites, some households who have held property for some time will also experience stress. By 2017 up to 15% of established households will be in stress in our central scenario.
Our research suggests there is an 18 month to 2 year grind between the onset of stress and households taking bold steps (or forced to) like selling up. Before that, they often get into the debt cycle of more credit card debt, refinancing, and a general hunkering down to try and keep the mortgage payments going. It is the broader economic impact of this refusal spend which will have a significant dampening impact on economic growth. In addition the outworking of stress leads to selling a property, so we would expect to being to see some forced sales in 2017 and beyond, another reason why we think house prices are likely to correct to more normal loan to income ratios.
In coming posts, we will look further at the state and postcode level data.

2 thoughts on “Mortgage Stress Coming To A Household Near You”