The latest results from our household surveys to end the end of January reveals that mortgage stress continues to push higher with 32.8% of households now impacted, representing more than 1.1 million borrowing households. In addition expectations of defaults are up to more than 83,400 over the next 12 months.
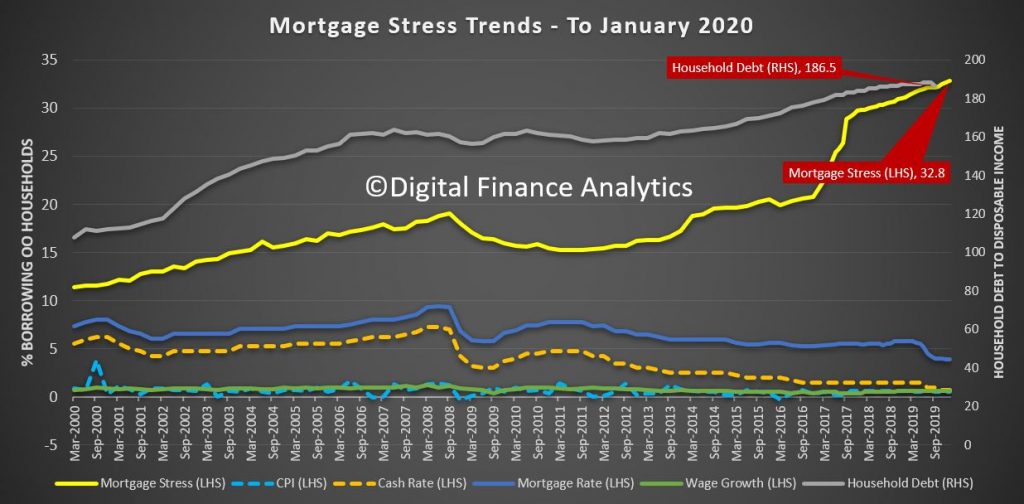
These results are of no surprise, given the ongoing pressure on incomes and rising costs, despite somewhat lower mortgage rates for some borrowers. The banks of course are deeply discounting rates for new loans, but many borrowers are unable to access these “cheap” deals and are stranded on more expensive rates.
Whilst some households who are not stressed continue to pay mortgages down ahead of time (which is why many claim all is well in mortgage-land), the hard fact is that one third of households are facing ongoing financial pressures. These households are not reducing their debt, rather in some cases they are turning to additional finance to try and bridge the cash-flow gap. Or they are raiding savings if they have them, and are putting more on credit cards.
We analyse mortgage stress in cash-flow terms. If a household is paying out more each month including the mortgage repayments, compared with income received, they are in stress. This is not defined by a set proportion of income going on the mortgage. They may have assets they could sell, but nevertheless in cash-flow terms they are underwater.
Mortgage stress continues to be visible across most of our household segments, with more than half of young growing families exposed (56%), and this includes a number of recent first time buyers.
Those in the urban fringe, especially on new estates are also exposed (50%) but the largest cohort are in the disadvantaged fringe, where incomes are below average as well. More than 300,000 households in this group are exposed, comprising 47.2% of all household in this segment.
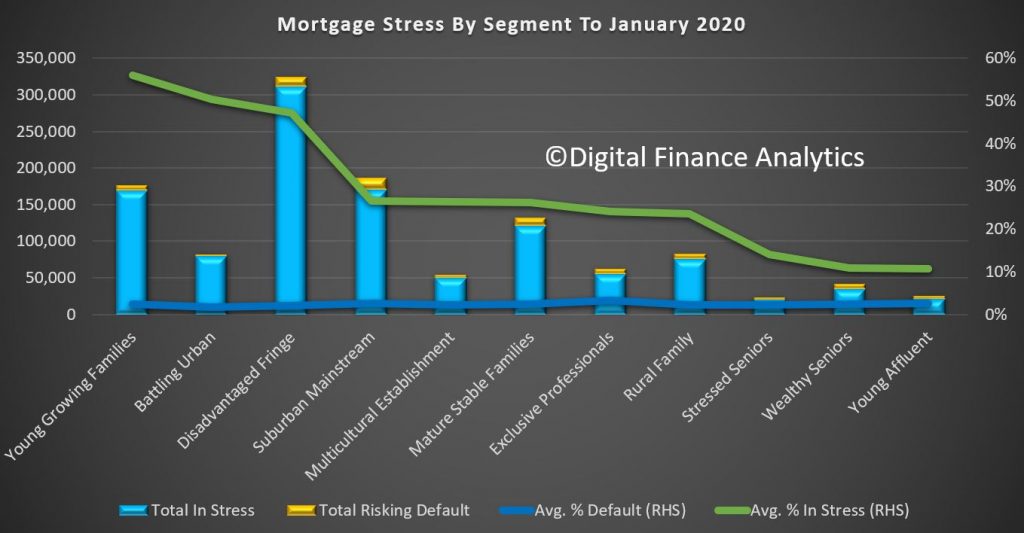
Stress also appears in our more mainstream groups, though at a lower level, and we also see our most affluent segments over-leveraged, with 24% of Exclusive Professionals (the most affluent group) and 10.7% of Young Affluent households impacted. In fact our predicted bank losses are more extreme in these groups, as they have larger mortgages and multiple properties.
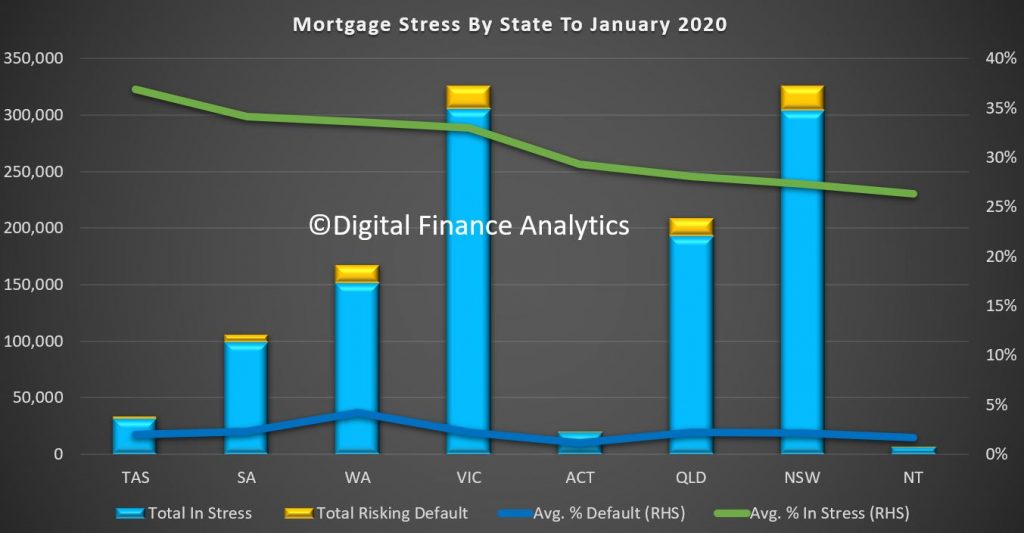
Across the states, 36.9% of households in Tasmania are registering as stressed, which equates to 31,700 households exposed, followed by South Australia at 34.1% (99,700) and Western Australia at 33.6% or 152,000 households. In TAS and SA prices have remained elevated relative to income and housing affordability continues to deteriorate. Victoria has more than 305,000 household in stress, or 32.9%, while Queensland has 193,000 (28.1%) and New South Wales 304,000 (27.3%). The highest rate of default (a forward-looking estimate over the next 12 months) is in WA at 4.2%, while the national average is 2.2%.
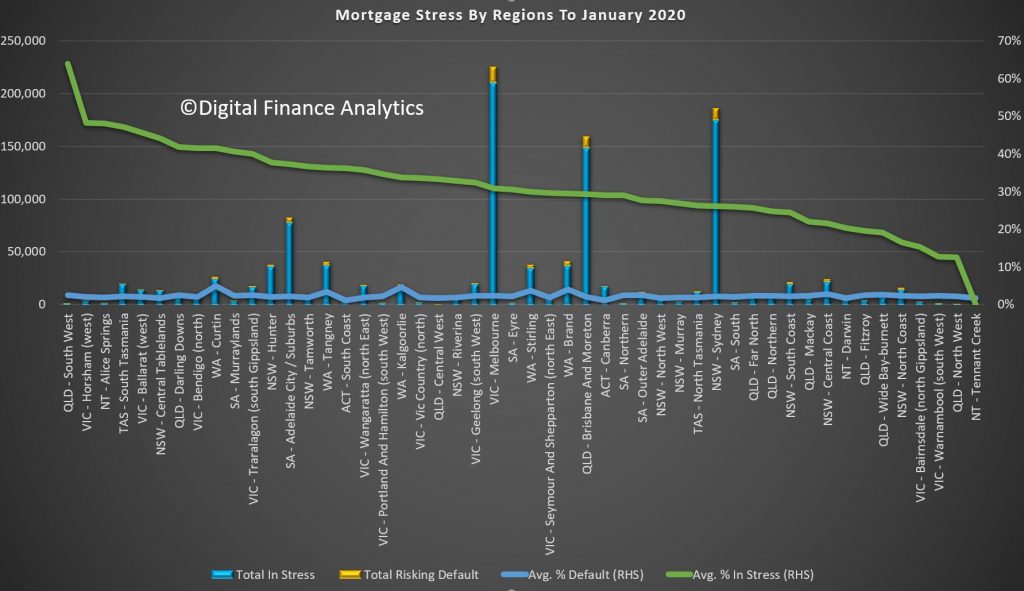
Across the regions, Regional Queensland, Horsham (VIC), Alice Springs and the Southern Half of Tasmania recorded the highest proportion exposed. But the main urban centres of Melbourne, Sydney, Brisbane and Adelaide had the highest counts. Default rates were highest in Curtin WA at 5% and Brand WA (4%). This is driven by multiple years of poor economic performance across the state and underscores that mortgage stress is a precursor to defaults, which tend to occur significantly later. The majority are still working, though income is under pressure. Given current economic headwinds and settings, we expect defaults to continue to rise.
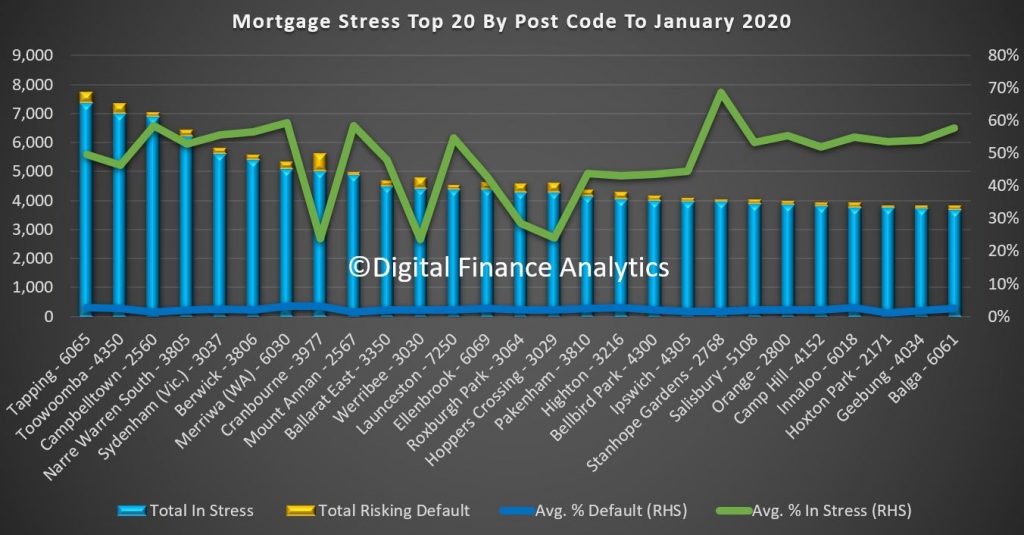
Finally, across the most stressed post codes, WA 6065, which includes Tapping, Wangara and Wanneroo recorded 50% of households in stress, or 7,360 households, followed by Queensland postcode 4350, the area around Toowoomba with 7,000 households in stress, NSW post code 2560, the area around Campbelltown with 6,900 households in difficulty, or 59% of households, and then Victorian post code 3805, the area around Narre Warren, with 6,200 households in stress, which is equivalent to 53% of households.
Most of these areas are fast-growing highly developed suburbs, often on the fringes of our major centres, with many relatively newly built properties on small lots, and often with little local infrastructure. As a result, a significant proportion of income goes on transport costs, and so despite many households having above average incomes, their larges mortgages and high expenses are putting them under continued severe pressure.
Finally, a couple of comments for those in stress, bearing in mind many we survey seem unaware of their plight, because they do not maintain a cash flow. So step one is to draw up a cash flow of money in and money out – ASIC’s Money Smart web site has some excellent tools. Next prioritise spending, and focus on repaying high interest debt (like credit card debt). Third, be cautious of refinancing and restructuring as while this may provide a short term path to relief, unless households in difficulty change their behaviour, it will not be a long-term fix. And finally, do not count on income growth ahead, as given the current economic conditions across the country, we expect wages to remain lower for longer.
And this is a warning too to those contemplating the new first owner incentives. Be conservative in your cash flow estimates, do not count on automatic income acceleration. This would be a path to mortgage stress sooner rather than later.
We plan to publish some stress geo-mapping in a later post.

Hi DFA,
Martin many thanks for your integral work and sincerity in everything you put out… just wondering if you had any more data specifically around the Geelong region. FYI there is a huge amount of land on the market down this way….one might call it a glut! Having experienced the Irish property disaster first hand, the denial and the rhetoric is starting to look very familiar. Thanks again!