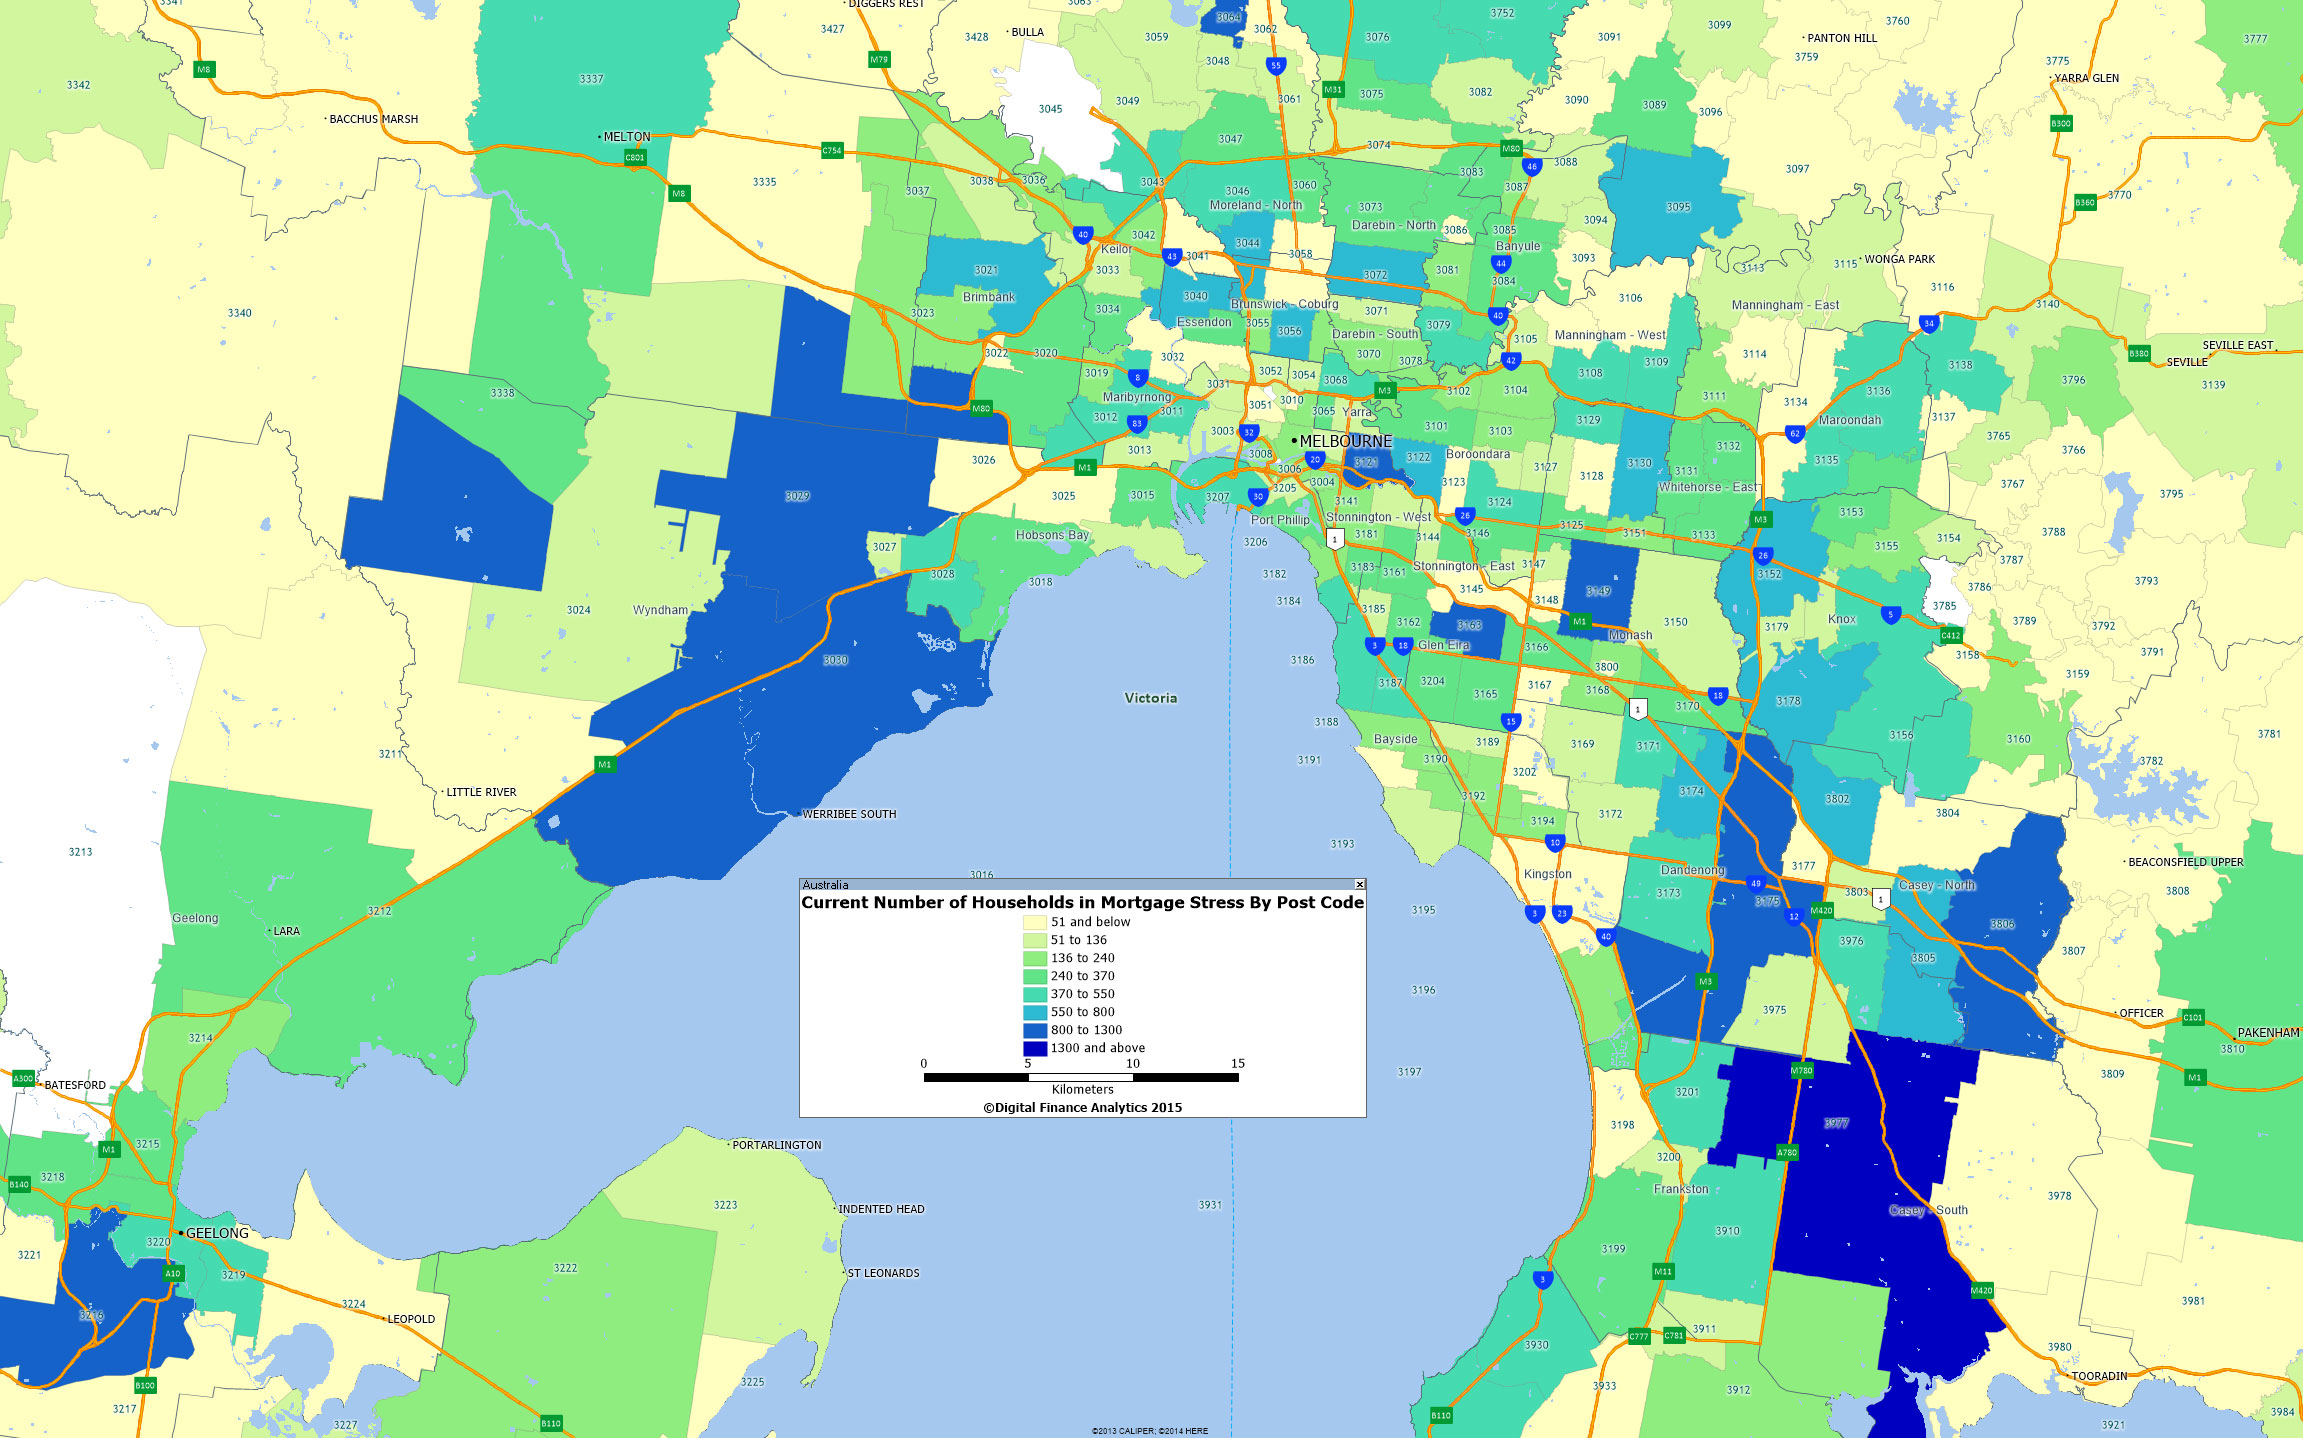
Continuing our series of the number of households experiencing mortgage stress by post code, today we look at Melbourne. Here is the geo-map showing the relative number of households in each post code district. We have not shown this distribution before.
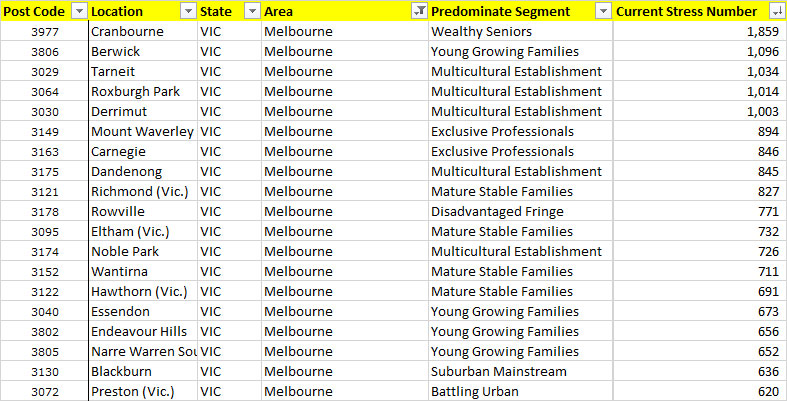
The areas with the highest count are listed below. Note the DFA segment distribution represented in each one. Whilst many are young families, or disadvantaged, many are more wealthy, and these have had access to larger loans, and more valuable property. But as a result they are more exposed, especially as incomes are static and costs are rising. Some are also getting squeezed by lower returns from savings and deposits with the banks.


