National Australia Bank reported its FY17 results today. Cash earnings were up 2.5% to $6,642 million, which was below expectation, and the statutory profit was $5,285m. The cash return on equity was 14%, down 30 basis points on last year. CET1 Capital was 10.1%, up 29 basis points.
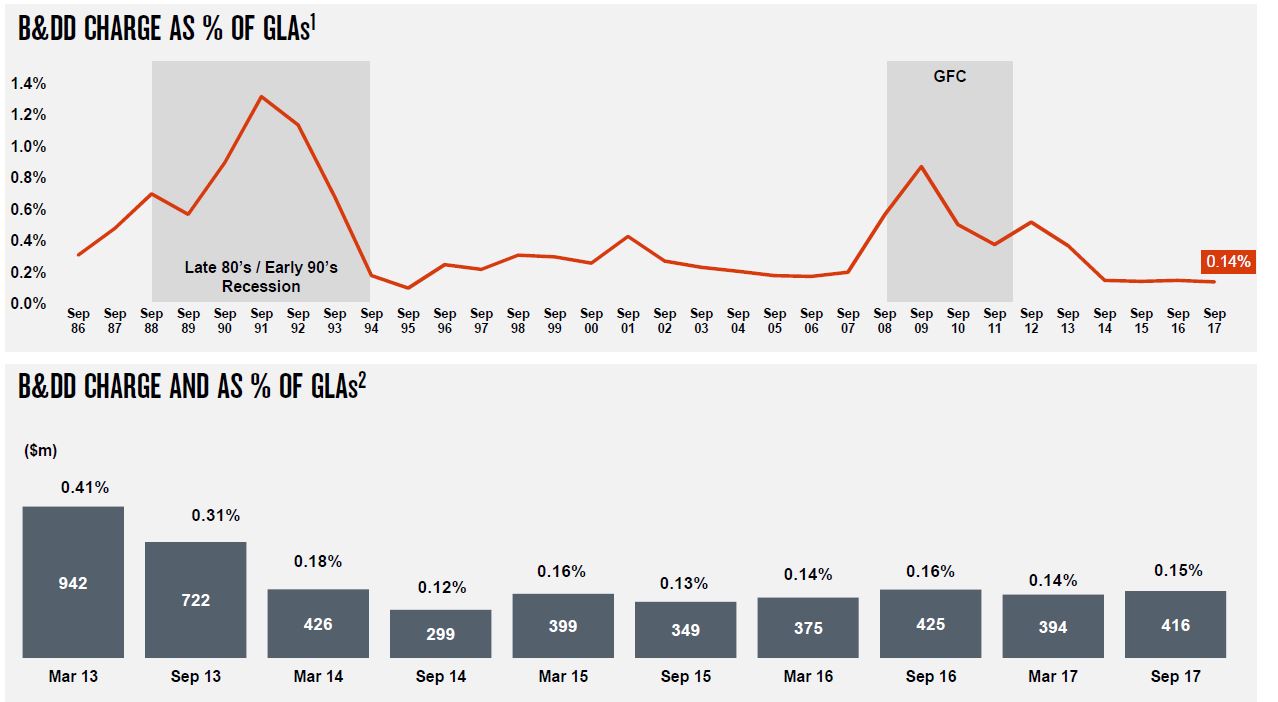
NAB now has its main footprint in Australia, (and New Zealand). NIM improved, although the long term trend is down. Wealth performance was soft, and expenses were higher than expected, but lending, both mortgages and to businesses, supported the results. They made a provision for potential risks in the retail and the mortgage portfolio, with a BDD charge of 15 basis points but new at risk assets were down significantly this last half.
Ahead, they flagged considerable investment in driving digital, and major cost savings later into FY20.
Of the $565.1 billion in loans, 58% of the business is mortgages, 40% business loans and 2% personal loans. 84% of gross loans are in Australia, and 13% in New Zealand. 10.9% of gross loans, or $61.9bn are commercial real estate loans, mainly in Australia.
So, the key risk, or opportunity, depending on your point of view, is the property sector. Currently portfolio losses are low at 2 basis points but WA past 90-day mortgages were up. If property prices start to fall away seriously, new mortgage flows taper down, or households get into more difficulty (especially if rates rise), NAB will find it hard to sustain its current levels of business performance.
Looking in more detail, Group Net operating income was 2.7% higher YOY and 1.8% higher in the second half.
 Group net interest margin was 1.88%, up from 1.82% in 1H. They improved their lending margin by 7 basis points. The bank levy cost 3 basis points.
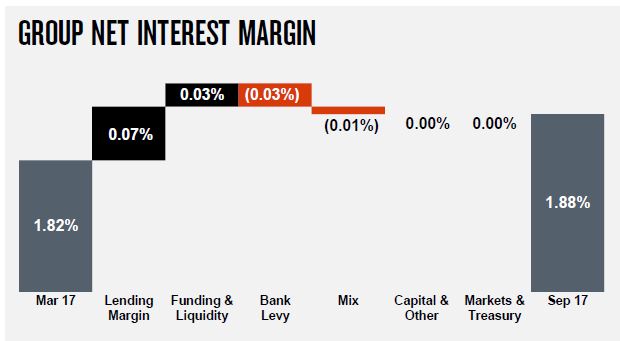 But long term NIM trends are lower.
 Operating expenses rose 2.6% YOY
B&DD Charges rose to $416m, and was 0.15% of GLAs.
 New impairments were $452m Sep 17, down from $690m in Mar 17.
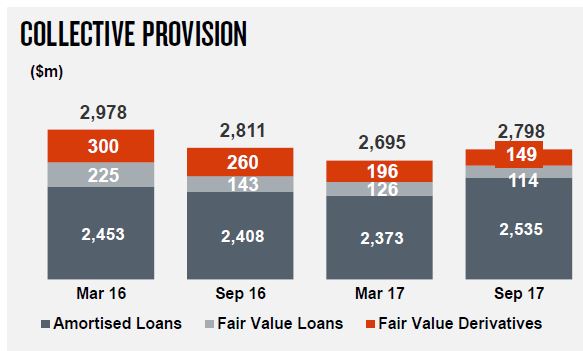
 The collective provisions were up, $2,798m in Sep 17.
 NAB CET1 ratio is 10.1% under APRA, but 14.5% under their claimed Internationally Comparable CET1 ratio. It was hit by the move to higher mortgage risk weights in 2H. This added around 17 basis points.
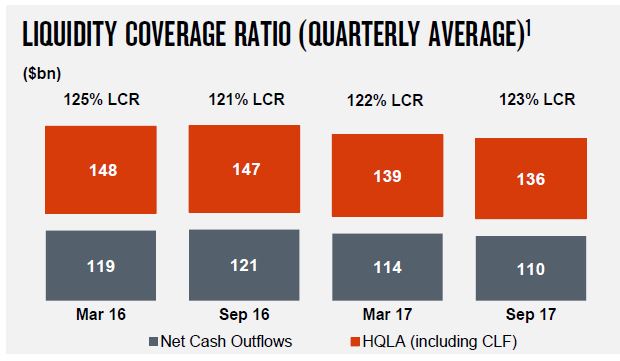
 51% of funding is from stable customer deposits. The Liquidity Coverage Ratio was 123%.
 The net stable funding ratio was 108% at Sep 17.
Looking in more detail at the segments:
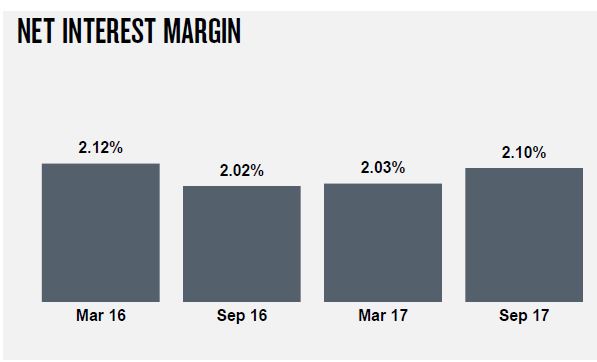
The net interest margins for Consumer Banking and Wealth is 2.10%.
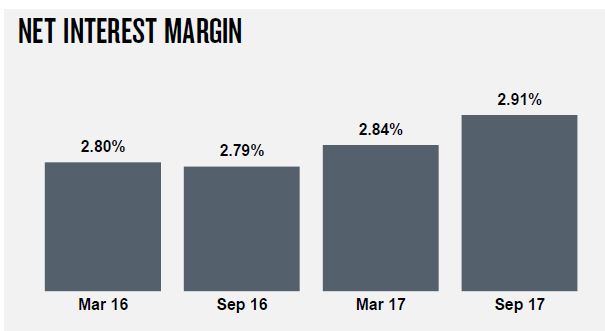
 NIM for Business and Private Banking was higher.
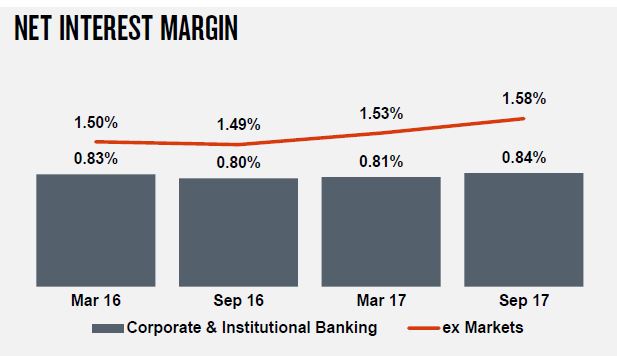
 Corporate and Institutional Banking NIM also improved.
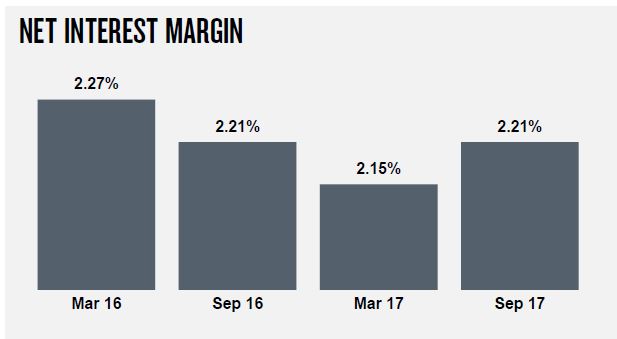
 NIM in the NZ business was also higher in 2H17.
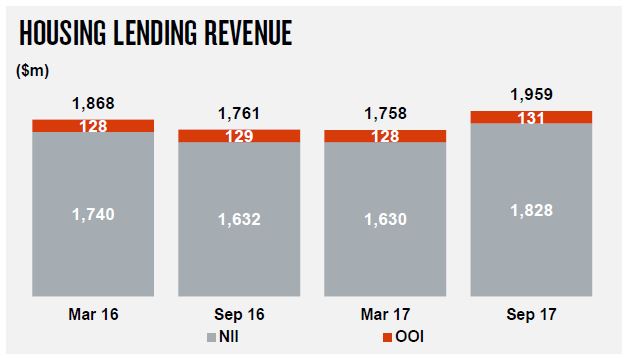
 Turning to the critical Australian Mortgage portfolio we see that housing revenue grew..
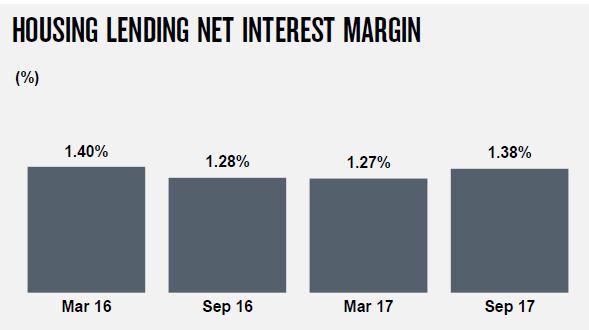 They highlight prudent customer behaviour – on average customers are 30 monthly payments in advance; 73% of all customers are at least 1 month in advance but this includes offset accounts.
They said the average LVR at origination was 69% and the dynamic LVR is 43%
NAB uses interest rate buffers and applies a floor rate (7.25%) or buffer (2.25%) to new and existing debt, plus granular expense evaluation across 12 customer expense criteria using the greater of customer expense capture or scaled Household Expenditure Measures.
 The strongest growth came from their Broker and Advantedge channels, with 4,637 brokers under NAB owned aggregators. 42% of draw-downs were attributed to brokers in Sep 17. One third of the portfolio is broker originated.
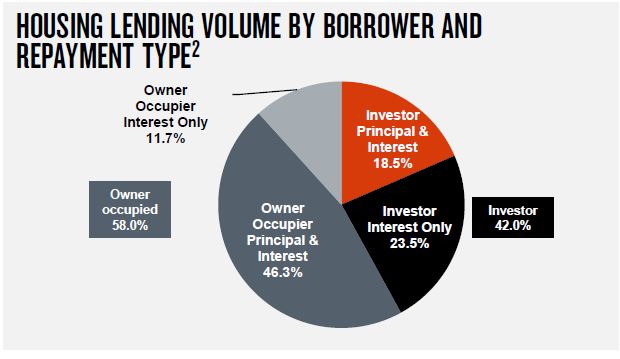
They reported some switching from interest only loans to principal and interest loans, including contractual conversion.
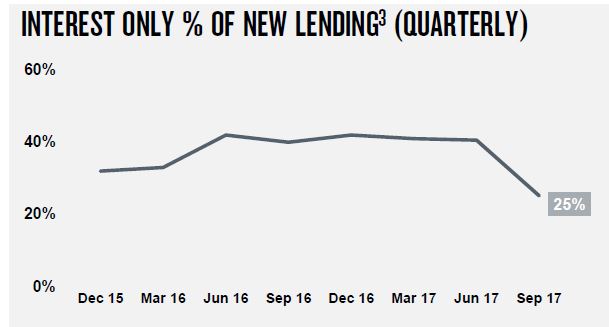
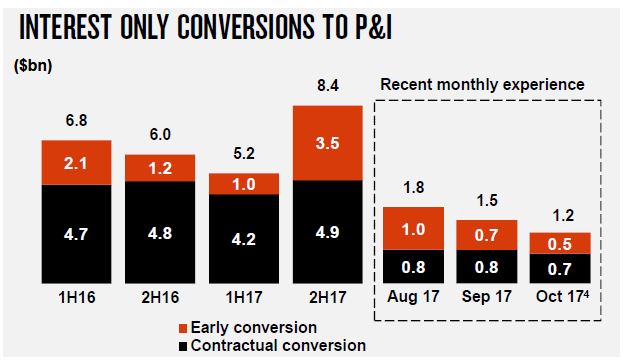 The proportion of new interest only lending is falling. The 30% Interest Only flow cap includes all new IO loans and net limit increases on existing IO loans. The cap excludes line of credit and internal refinances unless the internal refinance results in an increased credit limit (only the increase is included in the cap).
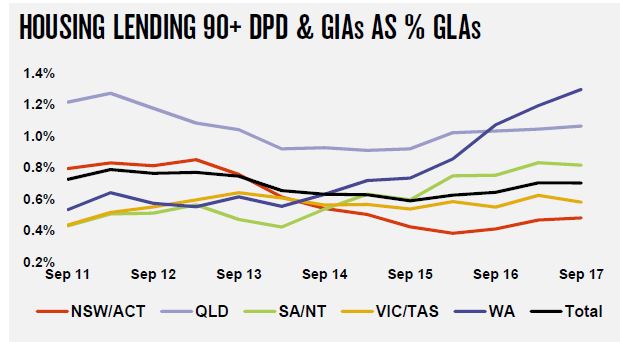
 90-Day past due date are sitting at ~0.6%, but WA is 1.2% (similar to other lenders, WA is were higher risks reside at the moment). QLD is around 1.0%. 9% of loans are in WA, 17% in QLD. Current loss rates are 2 basis points (12 month rolling Net Write-offs / Spot Drawn Balances).
 Looking ahead, the bank is targetting more than $1bn in cost savings by FY20 by driving simplification and automation, with a flatter organisational structure, and savings from procurement and third party costs. However, FY18 expenses are expected to increase by 5-8% due to higher investment spend, then targeting broadly flat expenses to FY20.
They highlight the transition to mobile, with more transactions now via mobile than internet banking.
 Further investments will be made here. 6,000 jobs will go in the next 3 years, while 2,000 new digital jobs will be created.


One thought on “NAB FY17 Result Cash Earnings $6,642 million”