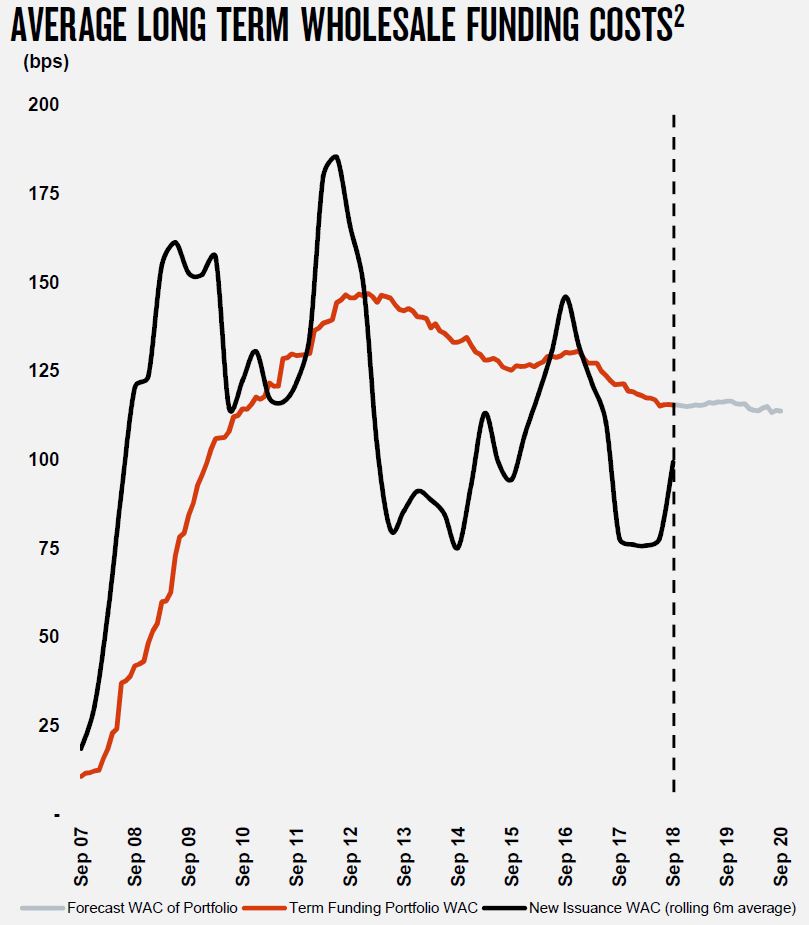
National Australia Bank (NAB) released their full year 2018 results today. They may have saved the day by reducing their markets business, and provisions are low (too low?), but the business does appear to be under pressure. Net interest margin in down, despite reducing returns to depositors, and funding pressure remains, to say nothing of the “unknown unknowns” from the Royal Commission.
That said, initial reactions from analysts seem positive (no surprises) and the market went higher.
 Cash earnings were $5,702m down 14% on FY17. They included restructuring costs of $530m and customer related remediation of $261m, leading to a cash earnings figure before these of $6,493m down 2.2% on FY17.
The earnings per share was 202.4 cps, down 16%, and the Cash ROE was down 230 basis points to 11.7%.
Statutory profit was $5,554m, up 5%, and the CET1 ratio was 10.2% up 14 basis points.
The net operating income rose by 0.4% in the second half of 2018, from $8,884m to $9,093m after allowing fro the customer remediation costs. Volume was up (excluding markets) but margin was down.
 The net interest margin fell 4 basis points from 1.88% in 2017 to 1.84% in 2018. This included 2 basis point falls in lending margin, and liquidity/funding plus 2 basis points from markets, offset by clawing back margin from depositors of 2 basis points.
 Group Markets and Treasury Income declined.
 There was a significant rise in operating expenses from $7,635m last year t0 $8,992m in 2018, which were helped by $320m productive savings, but hit by technology investments of $498m and restructuring costs of $755m plus costs relating to customer remediation and Royal Commission. 70 Retail outlets were closed.
 Total customer remediation costs were $360m split between revenue ($249m) and expenses ($111m). These included refunds and compensation in NAB’s Wealth business, including adviser service fees, plan service fees, the Wealth advice review and other Wealth related issues; Costs for implementing remediation processes and other charges associated with regulatory compliance investigations.
Of the ~6,000 FTE cut targetted by 2020, 1,897 were made, and of the ~2,000 upskilling, 195 were added. Total FTE in the group was 33,283 compared with 33,422 in 2017.
Looking at the home lending business in Australia, housing revenue has fallen, though with a small rise in interest only loan interest income.
 Loan balances grew a little from $295.1 billion in 2017 to $303.1 billion in 2018, and grew at around system to give a 15.4% market share. The net interest margin has fallen from 1.38% in 2017 to 1.22% in 2018.
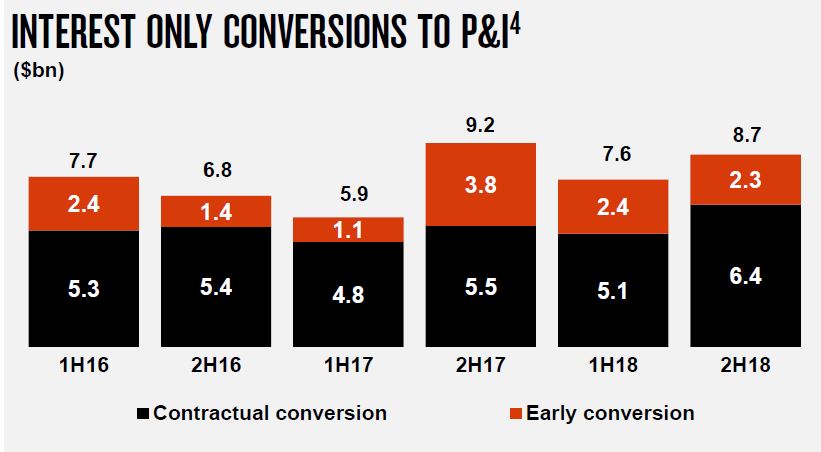
 Interest only conversions to P&I loans are running at ~$8 billion per half, with more driven by contractual conversions.
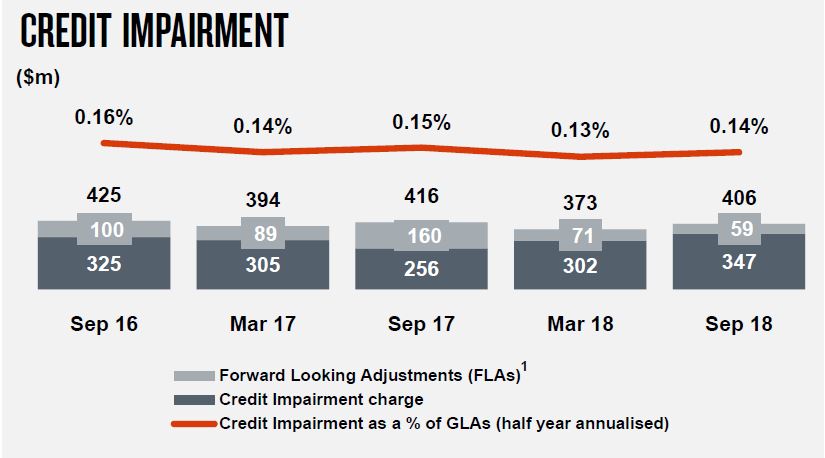
 Credit impairments rose to $403 million, or 0.14% of GLA.
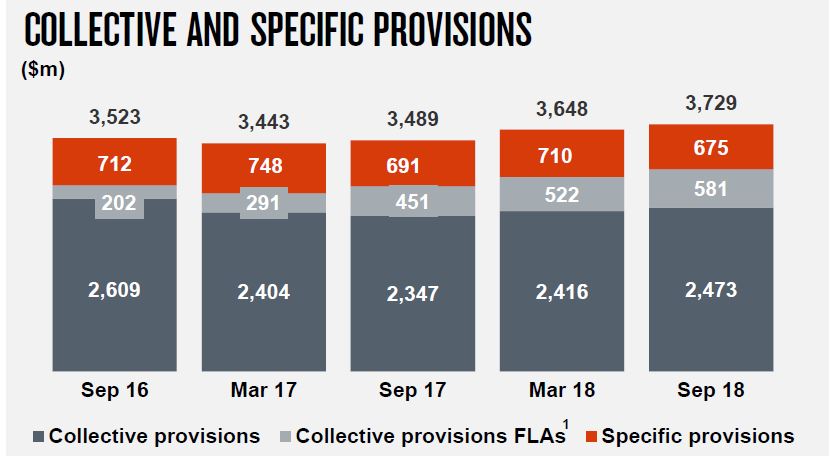
 The specific provisions were $3,729m, higher than a year ago.
 Looking at the Australian Housing Lending, we see a rising default trend, with WA leading the way.
 They increased their collective provisions from $270m in 2017 to $515m in 2018, which is 0.17% of GLA.
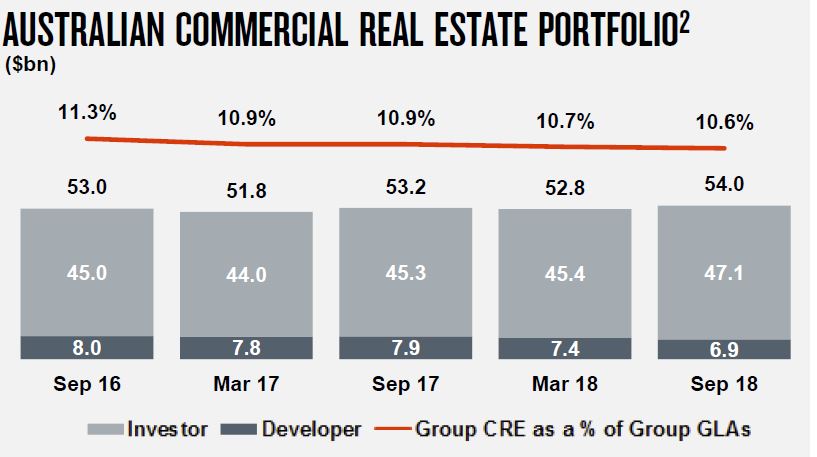
 NAB has $54bn Australian Commercial Real Estate drawn balance, of which 13% is Developer. They have imposed tighter lending restrictions (introduced cap on foreign buyer pre-sales, reduced maximum loan to cost ratio by ~10% and increased minimum pre-sales requirement).
They say exposure under construction limits are down 20% since
September 2016, Greater Brisbane and Greater Perth limits
down >50%1, >90% of limits amortise within 2 years and that higher risk inner city postcodes account for ~18% of total residential developer exposure.
 The CET1 ratio fell to 10.20% in Sept 2018. They say they are on track to achieve 10.5% CET1 ratio benchmark “in an orderly manner by 1 January 2020”.
 However, the total APRA capital ratio has fallen.
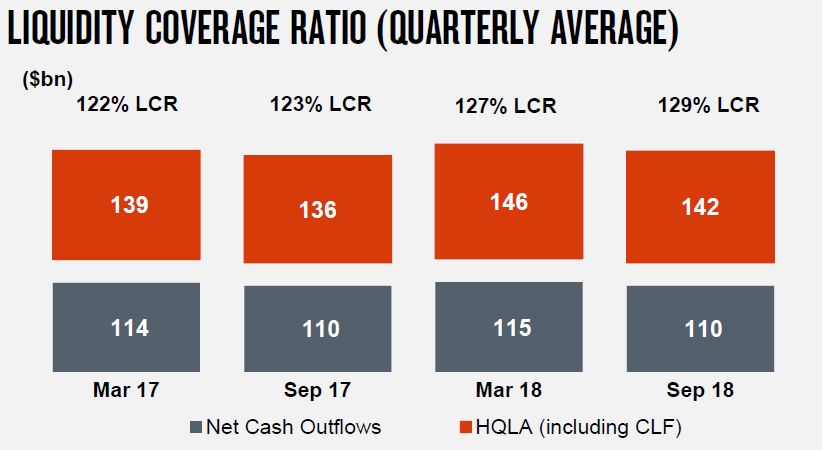 The Net Stable Funding Ratio was 113%
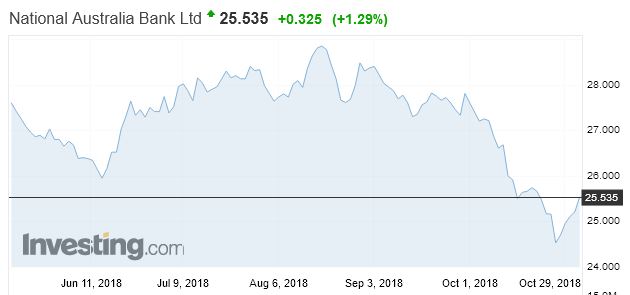
 The costs of new long funding are rising, although the portfolio costs overall are not. But the benefits of cheaper funding is passing, so putting more pressure on margins ahead.


