
The ABS released their Housing Lending data to end of October 2018. The media will fixate on the 2.6% rise in seasonally adjusted terms and some will claim this marks the “turn around” in mortgage lending. However, it is worth saying the seasonally adjusted series moved around significantly, and it does not take account of the much longer processing and settlement time we are now seeing as banks continue to tighten their underwriting criteria. Average loan settlement times have blown out considerably.
So, we will continue to look at the trend series, which seeks to iron out the humps and bumps, and tends to be more reliable in terms of overall trajectory.
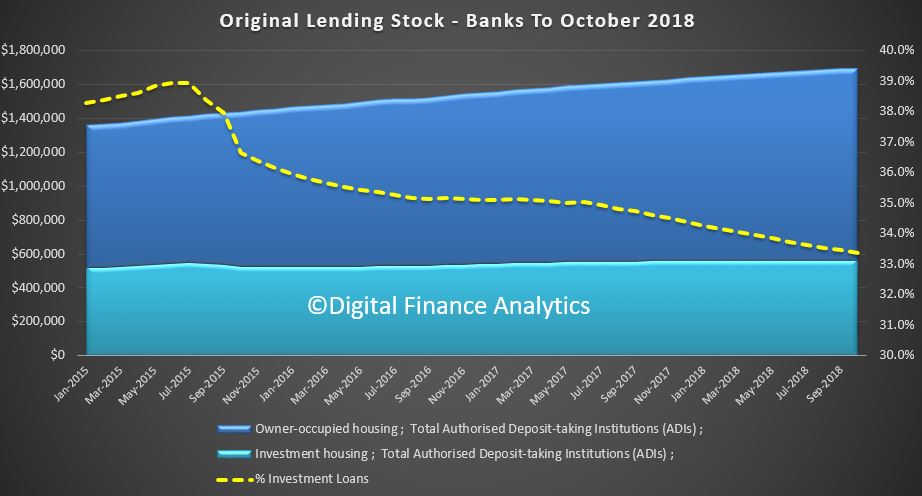
But before we go there, lets look at the original data series. So first to the stock of home loans held by the banks. Owner occupied loans held rose 0.4% in the month, or $4.8 billion to stand at $1.129 trillion. Investment loans were flat in the month, standing at $565.5 billion. So total home lending grew 0.3% to $1.695 trillion. Investor loans comprised 33.4% of all loans outstanding, compared with 39% in May 2015.
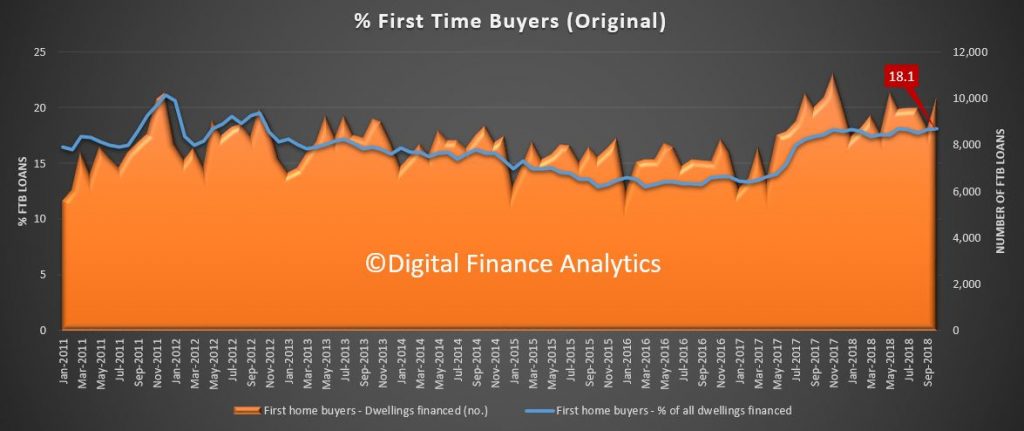
The original first time buyer data showed there was a rise of 15.7% compared with the previous month, to 10,137 loans approved, which offset the significant fall last month, and was caused by the longer loan processing times, and the incentives which still remain in the system to try and encourage first time buyers into the market. That meant that 18.1% of all loans were for First Time Buyers, still well below the 21% we saw in December 2011, or the 30.6% seen in 2009!
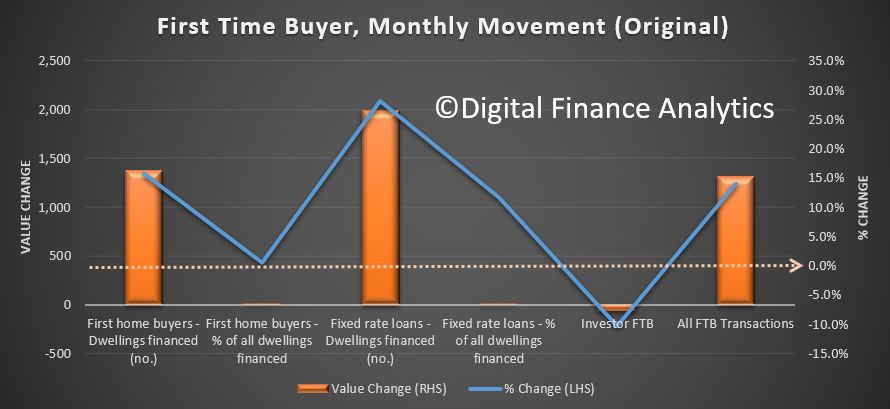
More loans were fixed rate this month, a reflection of the cheap refinance details on offer.
And the DFA tracker, which included first time buyers going direct to the investment market continues to fall.
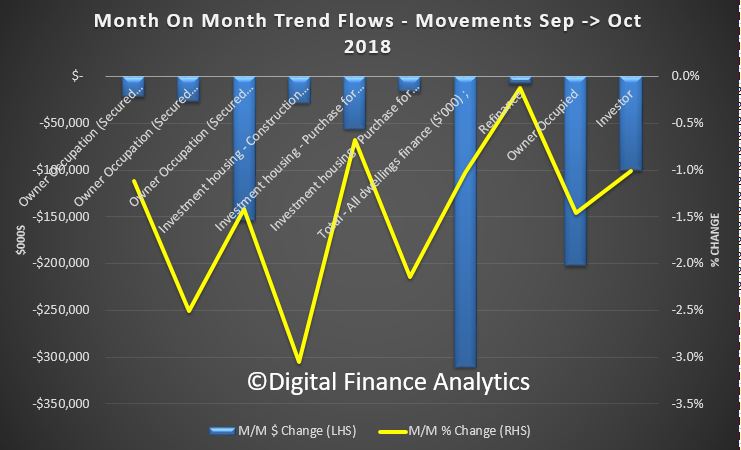
So now to the trend flow series. Total flows were down 1% to 29.85 billion, and within that refinances fell 0.1% to $6.3 billion, owner occupied loans fell 1.5% to $13.69 billion and investment loans fell 1% to 9.84 billion. Investor flows comprised 41.82% of new flows (excluding refinances) and refinances made up 21.1% of flows, the highest since June 2016.
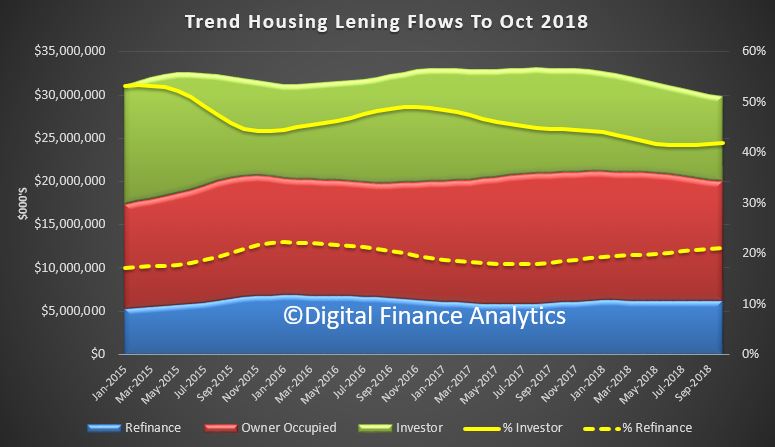
Looking at the moving parts, lending flows for owner occupied secured construction fell 1.1% to $1.8 billion, purchase of new dwellings was down 2.5% to $1.04 billion, and purchase for owner occupation of established buildings fell 1.4% to $10.77 billion. Refinance flows fell just 0.1% to $6.31 billion while investment related construction fell 3.1% to $0.9 billion, purchase for individual investors fell 0.7% to $8.19 trillion and investment purchases by other entities (for example super funds) was down 0.21% to $0.74 billion.
So to conclude, there is nothing here to indicate a recovery in home lending, and in some categories the volumes continue to shrink. In fact we will really not get a good read until the February data is in, as the next couple of months are always wobbly thanks to the summer holidays. And what we do know is that auction clearance rates are languishing, and more property remains on sale for longer. So we think loan volumes will continue to weaken.