
A replay of a recent presentation I made as part of an online seminar: NGAA Webinar: Financial Stress in Growth Areas – 2 September 2020
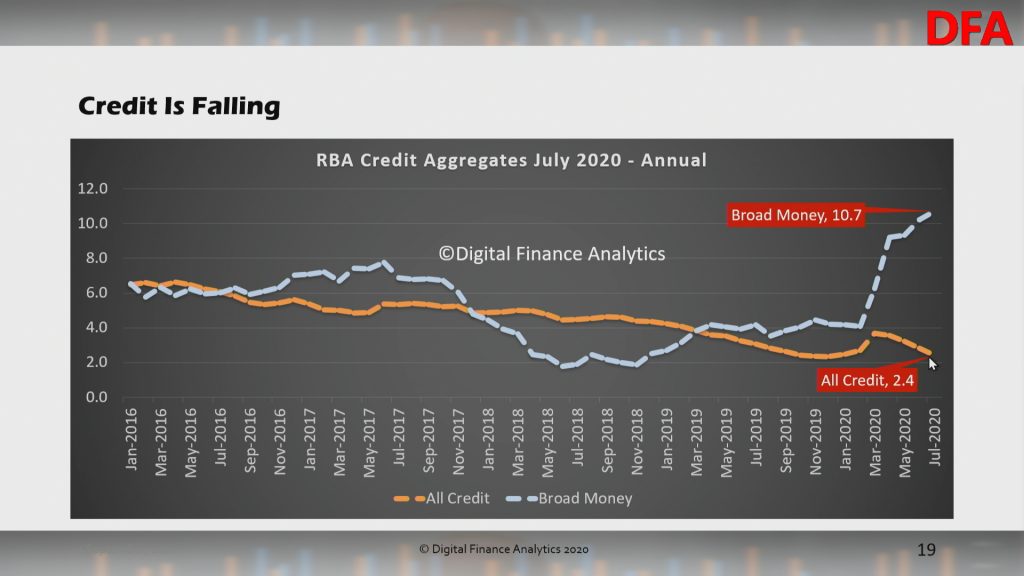
More Households Slip Into Financial Stress
The August 2020 data from our surveys continues to tell a sorry tale of more households feeling the pinch, whether they are mortgaged, renting or investing. Within the numbers there was a slid in Victoria in particular reflecting the latest lock down and the rising pressure on business there.
We discussed this at length in our live show yesterday. Here is a link to the HD edition:
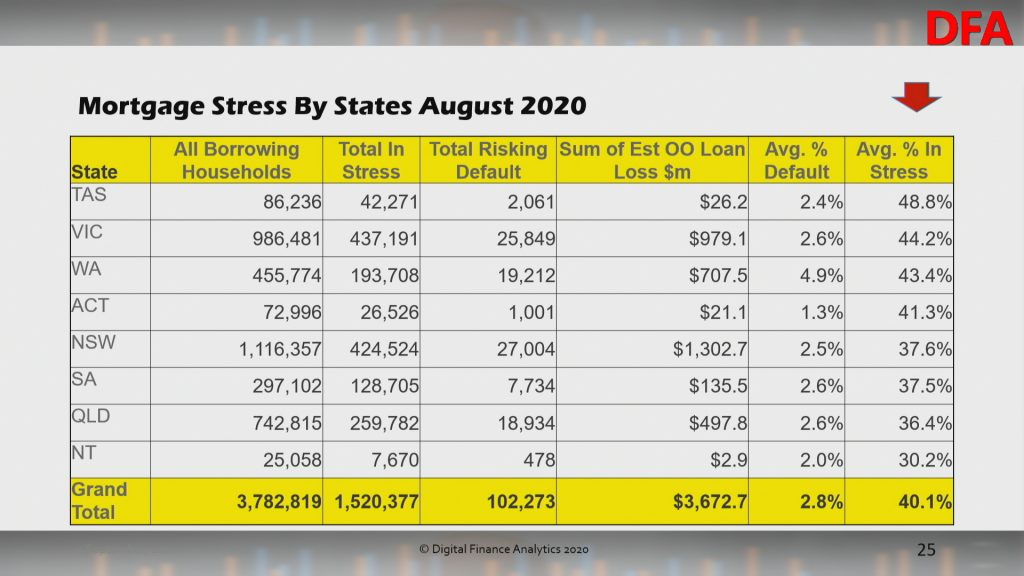
Overall mortgage stress came in at 40.1%:
This equates to 1.52 million households, with TAS, VIC and WA leading the pack.
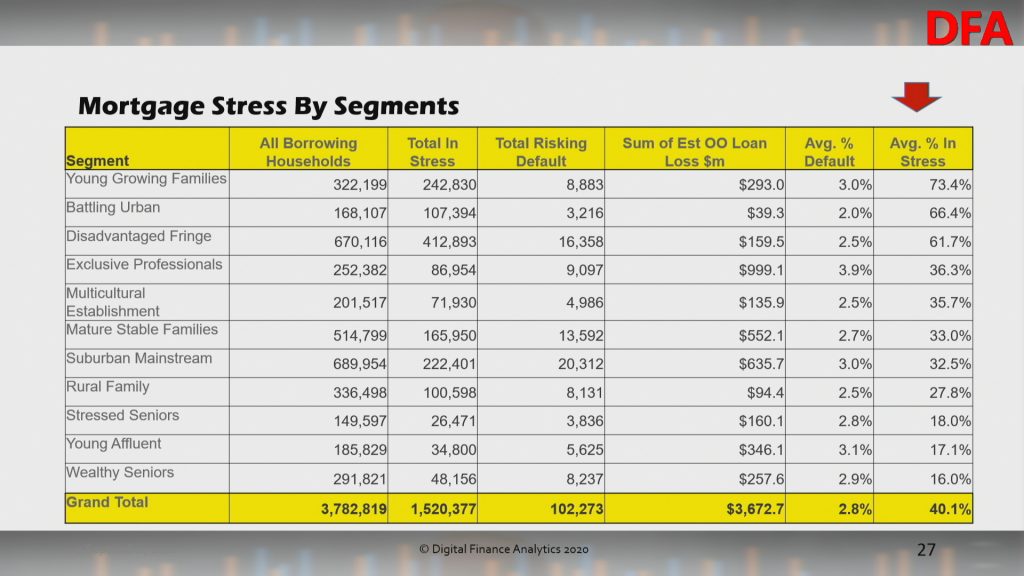
Young Growing Families, and Urban Fringe households are most strongly represented. This includes significant swathes of First Time Buyers.
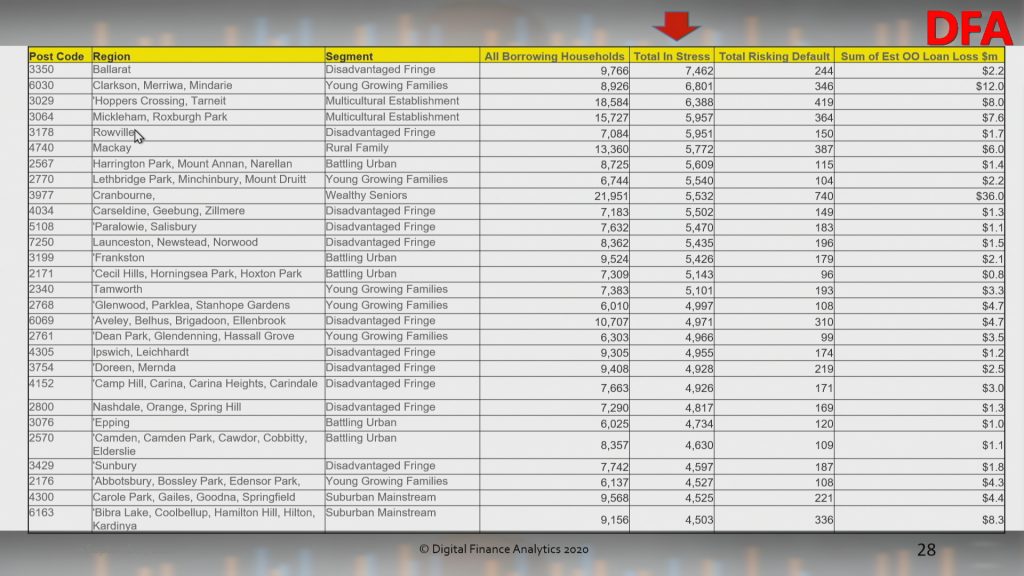
The post codes with the largest counts of stressed households coincide with areas of high recent development, where households have large mortgages, and VIC is over represented thanks to the lock downs.
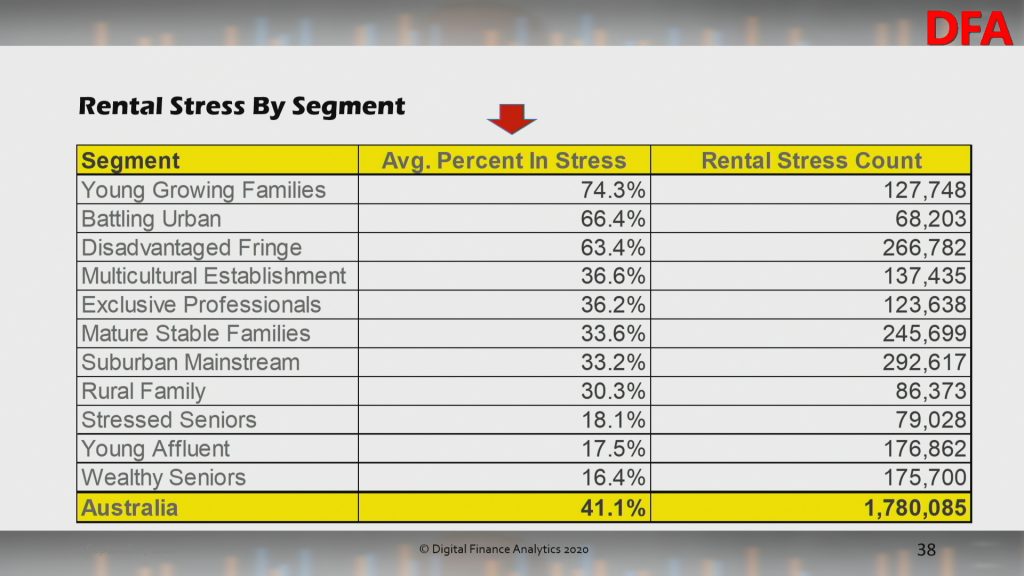
Rental stress remains a significant issue also, with 41.1% of Renters in difficulty, or 1.78 million households.
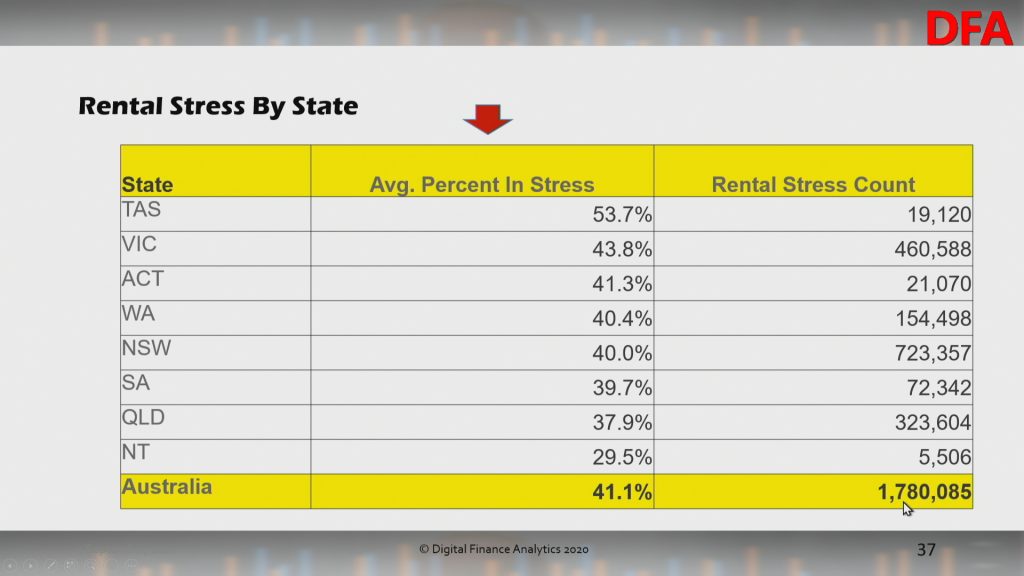
Within the segments, again Young Growing Families are most impacted.
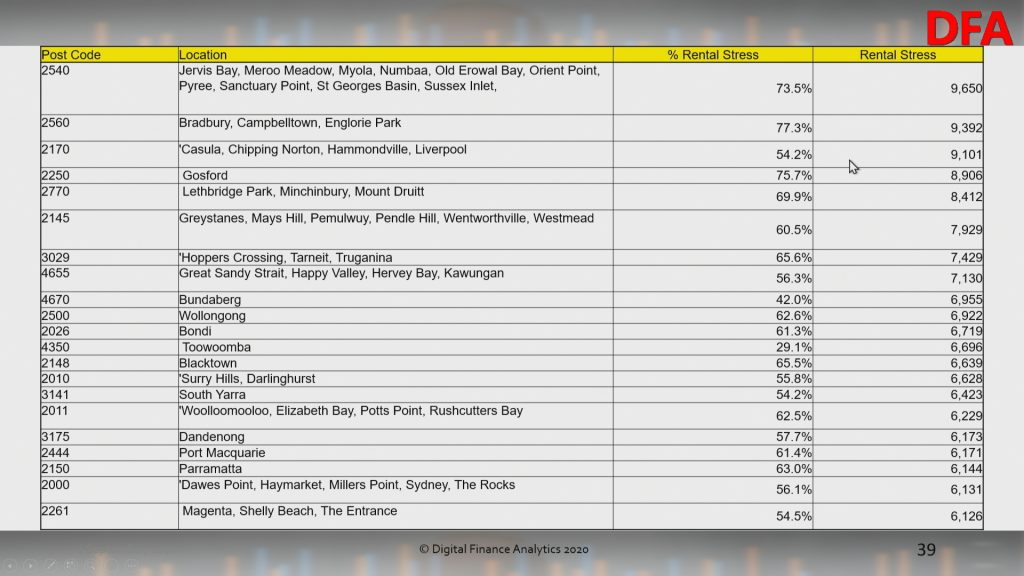
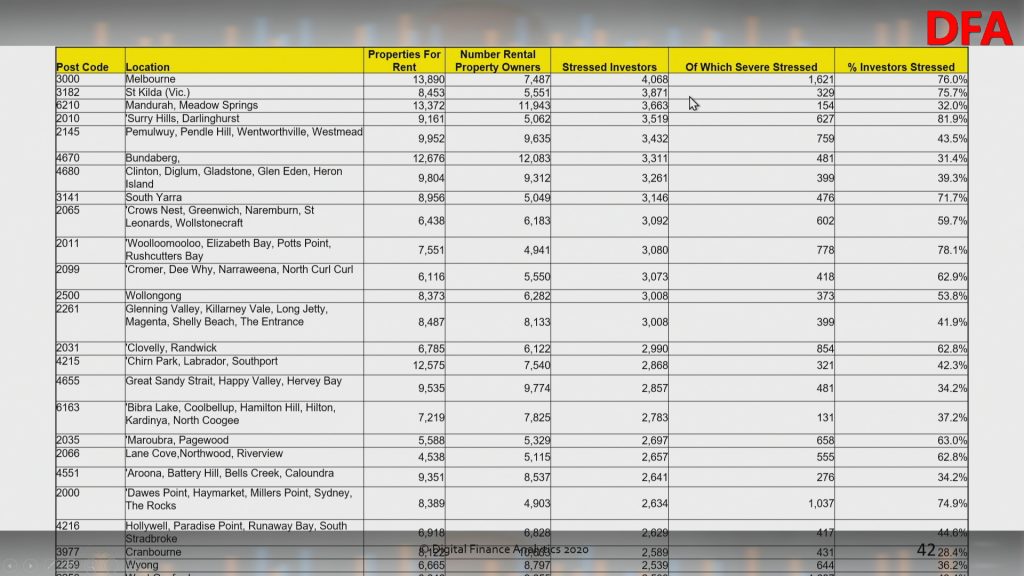
The post codes with the largest counts are revealed here.
Finally, investors remain in crunch territory, with 25.4%, or 826,000 under water, or trying to sell as rentals slide, and property values ease.
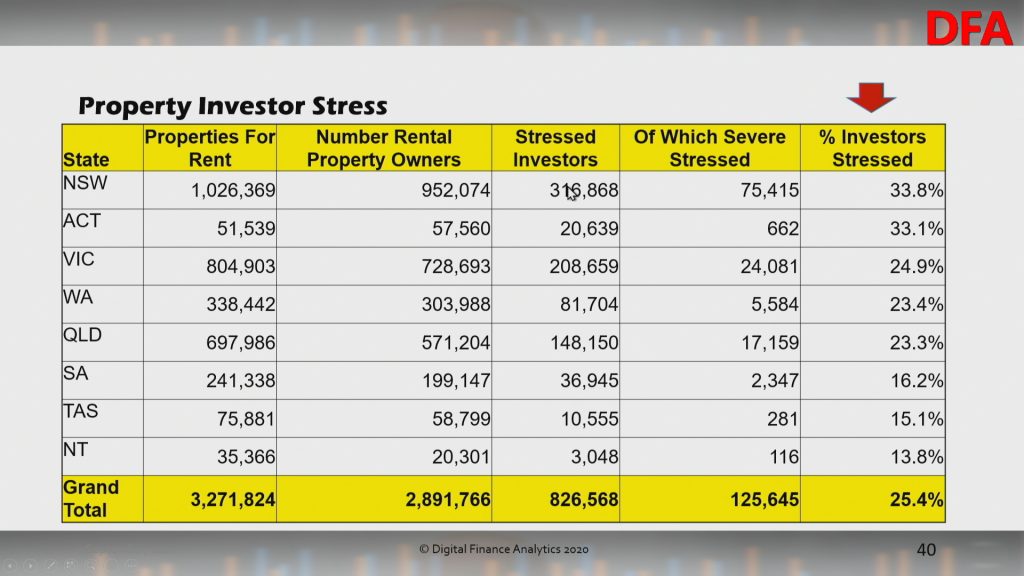
More affluent households are most impacted.
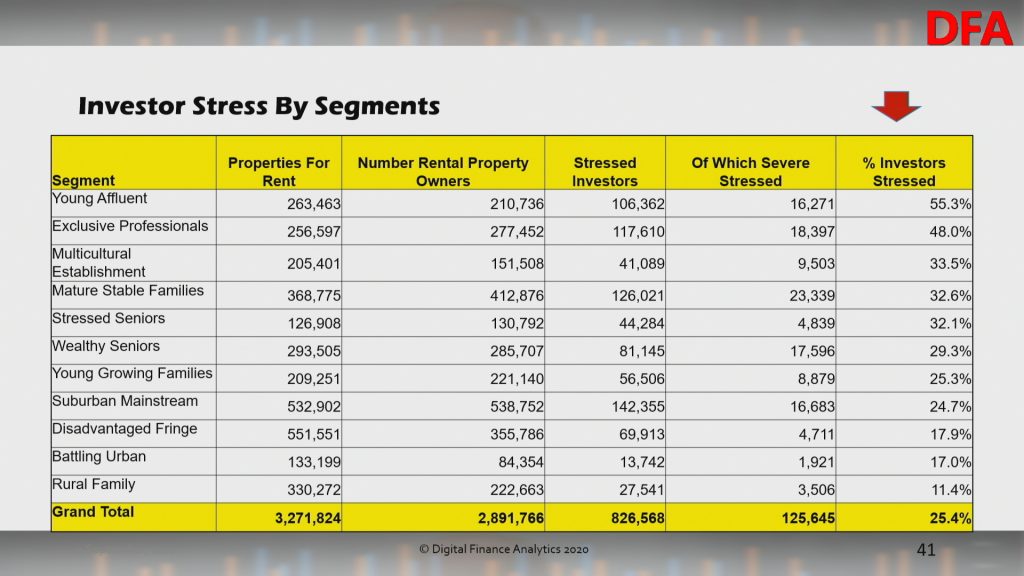
Once again Melbourne 3000 contains the latest number of stressed property investors (their investment portfolios can be anywhere, this is where they reside).
We will publish some stress mapping later, but clearly the fiscal cliff, which is now leglislated, will push more over the edge. Expect higher default levels over the next few month, more forced sales and less household consumption.
FINAL REMINDER: DFA Live 8pm Sydney Tonight – Latest Household Stress And Home Price Data
Join the stream live and ask a question via the chat. We will also have our new post code engine online…
Stagflation Is Now Official Government Policy
Economist John Adams and Analyst Martin North discuss the recent Central Bank musings, and consider the implication – will the future be deflationary or inflationary?
It’s Edwin’s Property Rant On A Monday
Edwin Almeida, our property insider updates us on the latest from the front line.
Stressing About Financial Stress
We discuss the concept of financial stress and illustrate this with an extract from our household surveys, ahead of the latest results which we will discuss on Tuesday. https://youtu.be/8gO_29PUDw8
National Debt Helpline: https://ndh.org.au/
https://mozo.com.au/family-finances/where-to-find-free-financial-counselling-services-in-australia
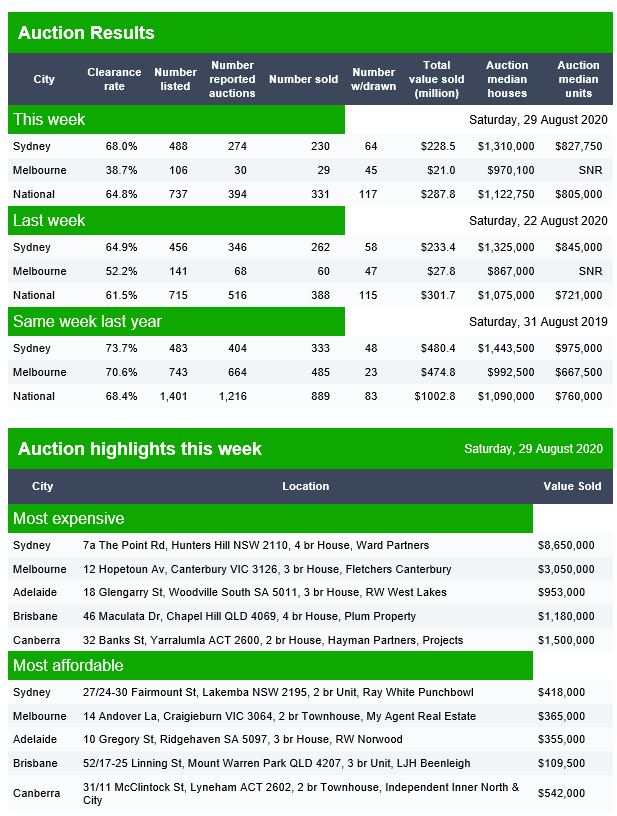
Auction Results 29 August 2020
Domain released their preliminary results for today. They also note that “From Thursday July 9 the Victorian government placed a ban on public real estate auctions as part of social distancing measures to slow the spread of COVID-19. The number of auctions withdrawn in the immediate weeks following the ban are likely to be higher than normal”.

Canberra listed 41 auctions, confirmed 38 results, with 32 sold, 1 withdrawn and 6 passed in to give a Domain clearance of 82%.
Brisbane listed 47 auctions, confirmed 31 results with 18 sold, 5 withdrawn and 13 passed to give a Domain clearance of 50%.
Adelaide listed 30 auctions, confirmed 21 results with 15 sold, 4 withdrawn and 6 passed in to give a Domain clearance of 60%.
Property DOUBLES Every 7 Years – Right?
We undertake a spot of myth-busting by using data from our core market models.
Central Banks Through The Looking Glass – The DFA Daily 28th August 2020
The latest edition of our finance and property news digest with a distinctively Australian flavour.
Markets in the eye of the storm
Damien Klassen is Head of Investments at Nucleus Wealth has penned an excellent article which is reproduced here with permission:
Investment markets are in the eye of the storm. The initial storm danger came as COVID-19 hit, decimating jobs and smashing demand. Governments and central banks ably stepped up to stem the damage, and investment markets calmed. But insolvencies and bankruptcies have only been delayed, not avoided and the employment recovery is unlikely to be quick. The eye of the storm is not as safe as it appears.
The disconnect continues
At the risk of sounding like a broken record, the dynamic at the moment is as strange as it has ever been. I have spoken before about the best argument for buying stocks is the ironic case that capitalism is dead, and therefore buy equities. Disconcertingly, there continue to be signs that this is the case.
Governments around the world made significant changes to bankruptcy and property eviction laws.
When the crisis was expected (hoped?) to last for only a few months this was good policy – there is was no sense in shutting down companies due to short term demand issues or kick people out of homes for short term job losses. And the changes have worked:
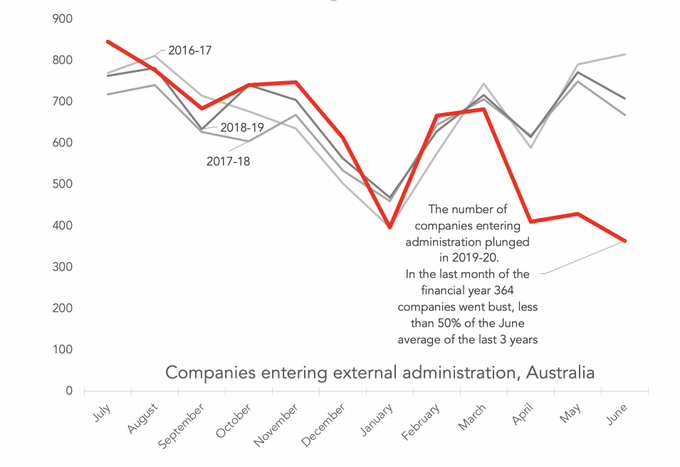
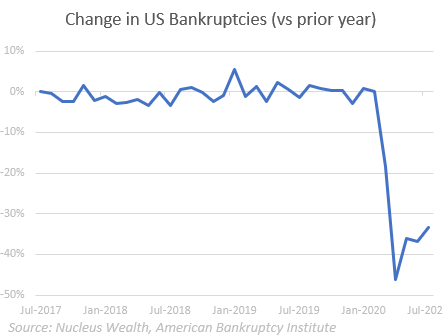
Which is where the disconnect lies. Australian bankruptcies in the June quarter were down 42%. The US is down around the same. Europe is seeing similar effects. The number of unemployed is 50% higher than the start of the year in most countries. There is clearly a tension that needs to be resolved.
It should be clear now that COVID-19 is not a 3-month “blip” but rather a longer-term structural issue. Now it becomes a question of whether the cure actually turns into the problem.
Some jobs will never return
A Melbourne based specialist delivery company has a niche delivering to hospitals and hotels. Revenues down 75%+. Profits up 50%. Most of the profit increase is JobKeeper. But the owner has also torched middle management and worked out clients are just as happy with larger deliveries less often rather than smaller deliveries more frequently. And so productivity is off the charts. As revenues recover, the middle managers will not be getting their jobs back.
This is just an anecdote from one company, it is not data. But economic history shows a similar effect with businesses across the world. That is what recessions show us – jobs lost take a long time to re-appear. Many older workers will never work again.
Capitalism has bankruptcies for a good reason
There is a good reason for bankruptcies and evictions. When people or companies get into financial difficulty, bankruptcy gives them breathing space by cancelling interest and allowing them to resolve the problem. It forces them to reset their obligations and to come up with a plan to extricate themselves.
Just as importantly, it alerts suppliers, employees and other partners to the problem. The reason this is useful is that without bankruptcy, companies and people can simply use up credit with one supplier and then switch to another. If this is allowed to go on, then the suppliers start to go broke, and it creates a domino effect of economic issues.
Evictions are similar. Say someone cannot afford a $1,000 a week rental/mortgage because of job changes but could afford $600 per week in a different suburb. How long should they be allowed to stay in the $1,000 per week house? The longer that person is allowed to stay, the more likely it is that the landlord also goes into financial stress. Or, the bank has to reduce lending elsewhere, creating another domino effect.
Keep in mind that for the most part, rental debts or interest is still accruing, the burden is getting larger and the capital smaller. These are highly emotional issues, and in both cases, we absolutely need a safety net. But, a small debt can conceivably be paid off through a restructure. In contrast, larger debts become all but impossible to pay.
Cruel to be kind?
Say you have someone who is bankrupt, owing $25,000 to a range of credit card providers, utilities and landlords. If they go bankrupt or are forced to sell their house, then it can be a devastating event. But if the jobs are not coming back quickly then if you give that person six more months, then compounding interest and more bills might turn the amount into a much higher figure.
For the borrower, it is far crueller to be under six months or twelve months more emotional and financial stress. During this time they go from a small debt to a far larger debt while hoping for “something to come along” to fix the problem. Better to bring the issue to a head earlier.
For the debtors, an early resolution is also much better as each debtor has a lower exposure and might get paid out something. At high debt levels, individual debtors end up with almost nothing.
How long can capitalism be suspended for before it becomes a problem?
So there are two competing macroeconomic effects.
- We don’t want bankruptcies to snowball into more job losses, into a housing market crash, into more defaults and so on. So, by delaying the start, it creates a calm spot, the eye of the storm.
- We don’t want the lack of bankruptcies to mean that the over-indebted who aren’t paying their bills start bringing down people who weren’t over-indebted. This is the second half of the storm.
Governments were hoping for a short sharp shutdown and recovery, or a cure or a vaccine. It didn’t happen.
Governments are tempted to pull the first lever again and hope. The issue is that the second grows bigger every day. By pulling the first lever again, if we don’t get a cure or vaccine, then there is now a much larger problem.
If the last ten years have taught us anything, they have taught us that given a choice between:
- taking a little short term pain for a large amount of economic gain or
- taking a little short term gain for a large amount of economic pain
That politicians will take option (b) way more often than more sober observers would prefer.
The rules are rolling off around the globe, my expectation is that this will create at least some sense of normalcy. But there are already countries extending provisions until the end of the year or beyond. Which makes it difficult to assess when the eye of the storm will pass, and the second half will begin.
There is an alternative possibility: that markets are now entirely dependent on central bank support, so economics and fundamentals no longer matter. We have a checklist of a dozen decisions that governments and central banks can make that will eventually suspend capitalism.
A few of the items have already been checked off the list. The more that get implemented, the closer we get to a genuinely new paradigm. But, we do not believe this to be a likely outcome. The steps taken must become increasingly radical: effectively central banks and governments bailing out and propping up most failing businesses, turning the world’s capital markets into a herd of state-owned entities that will ‘kill the village in order to save it’.
Bubbling along
The economic and virus progress has mainly been as we expected. So, our asset allocation and superannuation portfolios remain conservatively positioned.
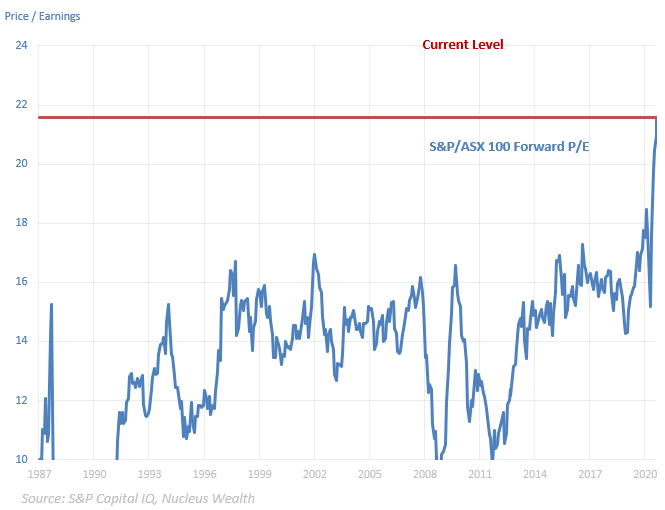
In the direct holding stock portfolios, our virus-sensitive positions have driven outperformance. Since the crash, we found value in commodities. First oil, then iron ore, and now gold miners. We remain very wary of banks. However, the economy and the stock markets have disconnected. The stock market is at valuations that discount no risk.
Wrap up
We changed most of our quant models a few months ago to put much less focus on the last 12 months of earnings, or the next year. The focus instead is on a mix of inflation-adjusted historical earnings and the earnings from the second year of earnings. The problem with this is:
- Historical earnings don’t capture growth companies very well.
- Analysts are not very good at forecasting the second year of earnings in the best of times. We are not in the best of times.
Which is an indication of the environment. You have to understand the limits of your models. The key to navigating as we exit the eye of the storm will be to not lose track of the principles of good investment while changing models enough to reflect that times are not normal.
We have a shopping list of high-quality companies that we want to own for our investors at lower prices for the very long term. Which is easier said than done. We picked up a few in March, but the problem with these companies they also bounce back the fastest once panic subsides.
Given a toxic mix of low-interest rates, volatility and expensive markets, investors will need to be significantly more nimble than in the past.
D