Steve Mickenbecker is the Group Executive, Financial Services at Canstar. I discuss the recent rates changes across the markets in Australia, consider the implications for savers, and touch on negative rates down the track.
Only Our 10th Prime Minister Can Save Australia
Economist John Adams and Analyst Martin North examines the life and times of Joseph Lyons, Australia’s 10th Prime Minister. What lessons can we draw?
Joseph Aloysius Lyons CH was an Australian politician who served as the 10th Prime Minister of Australia, in office from 1932 until his death in 1939. He began his career in the Australian Labor Party, but became the founding leader of the United Australia Party after the 1931 ALP split.
Household Financial Stress Reaches New High
The results from our latest household surveys reveals that despite the return to work as the lock down is eased, the reduction in JobSeeker, JobKeeper and the need to renew mortgage payments are all offsetting the better job news, in a low income growth, high cost environment.
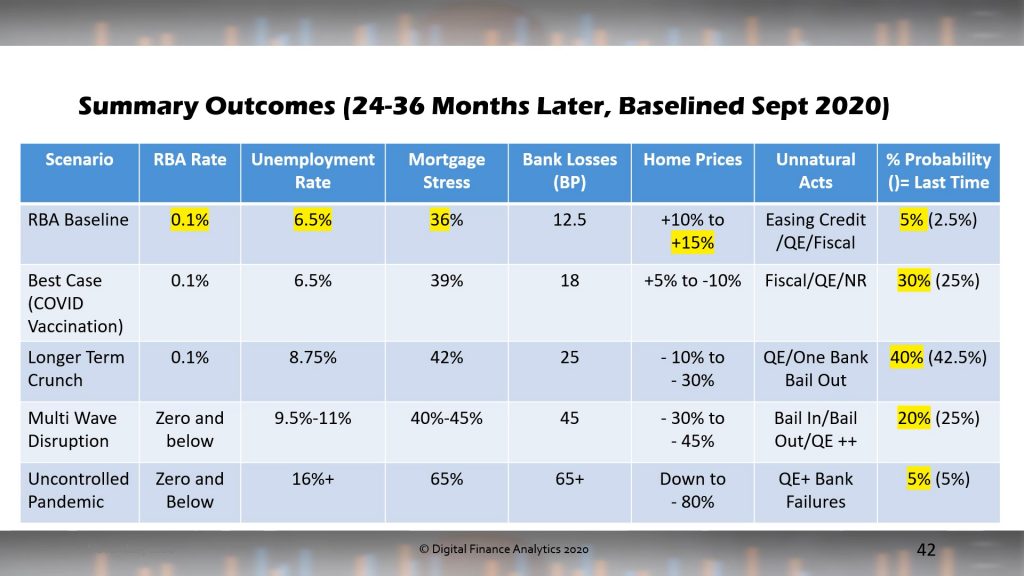
We also updated our property and finance scenarios to take account of the RBA announcements yesterday. There is still a path for higher property prices ahead, but this is not our central scenario over the next 2-3 years. Handling the virus will be a critical issue ahead.
We discussed this in detail on our live stream Q&A.
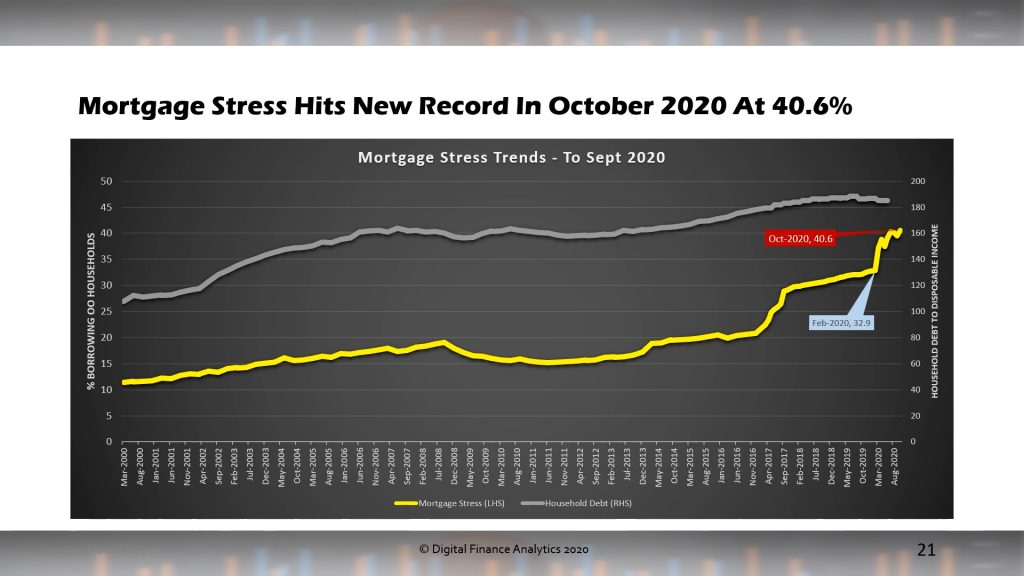
We measure stress in cash flow terms, recognising that households may have access to credit or savings in the short term, rather than a set proportion on a mortgage repayment. In addition we examine those renting, and those with investment property to give a more complete picture. Note our approach is different from those preferring to use a set percentage of income.
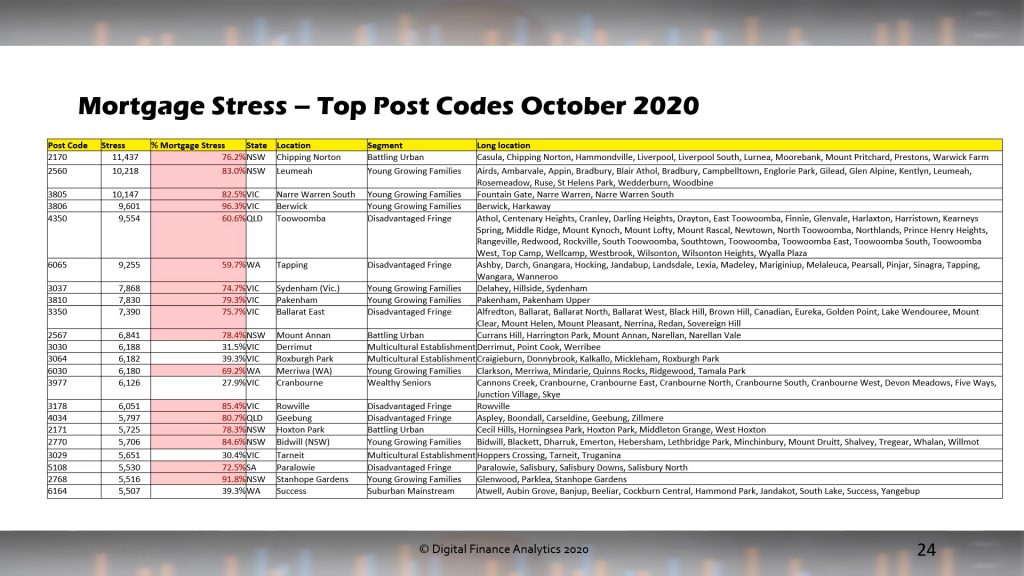
Mortgage stress rose to 40.6%. This is a new record.
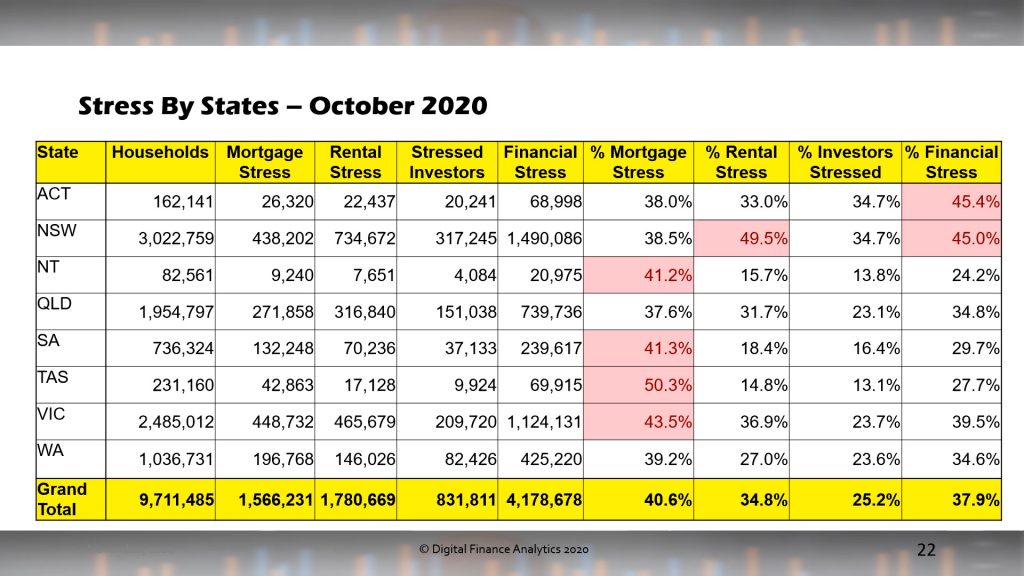
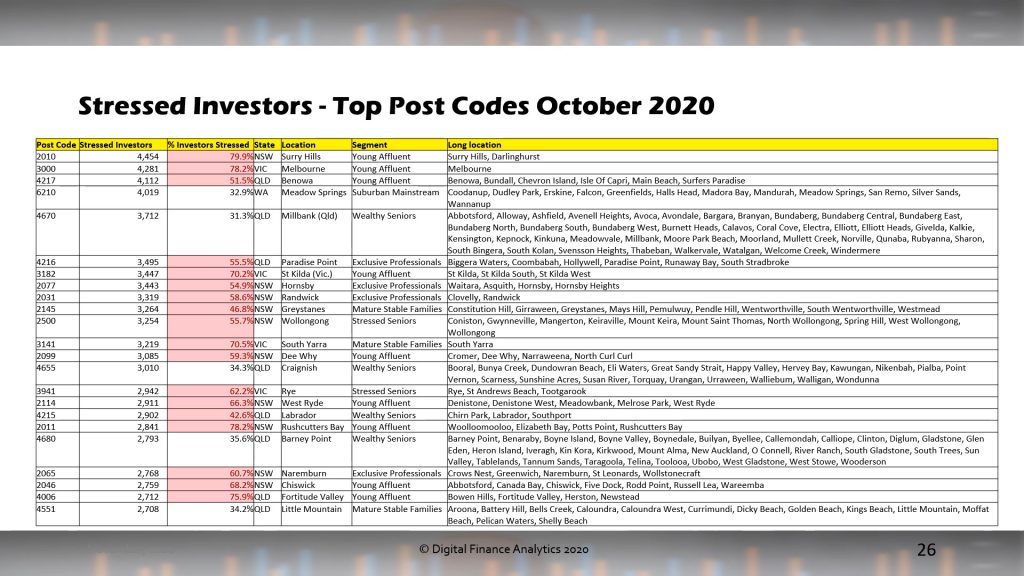
Across the states, mortgage stress is most severe in Tasmania and Victoria, whereas rental stress is highest New South Wales. Investor stress is also highest in this state together with the ACT. Overall financial stress is highest in NSW and ACT, with VIC following closely behind.
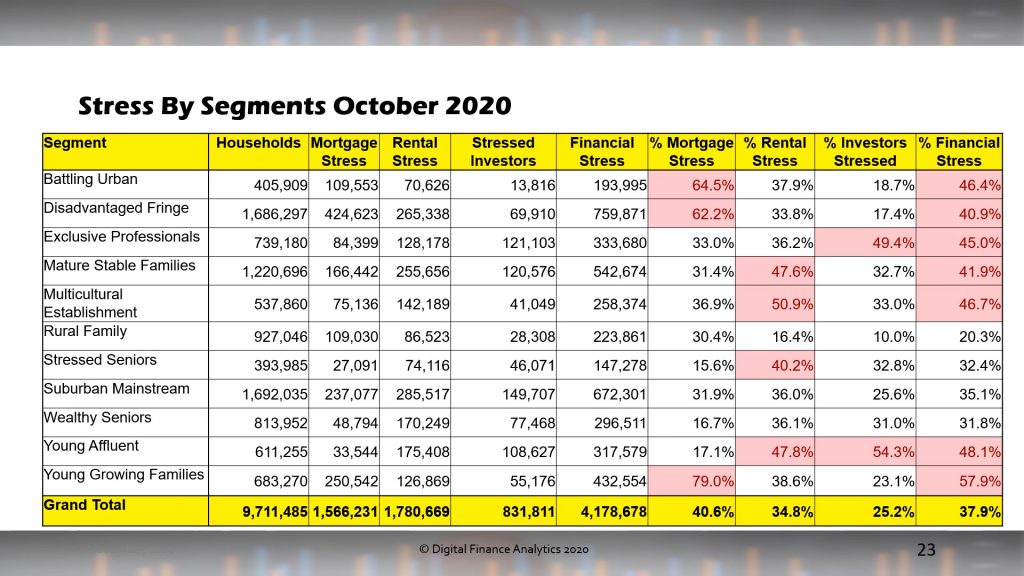
Across the segments, young growing families (including many first time buyers are the most exposed to mortgage stress, whereas rental stress is hitting younger affluent, first generation migrants and older households. More affluent households are experiencing higher levels of property investor stress, as they are more leveraged, and often have multiple properties. In aggregate Financial stress is touching a wide range of our cohorts.
We present the top post codes (in terms of count) for each stress dimension.


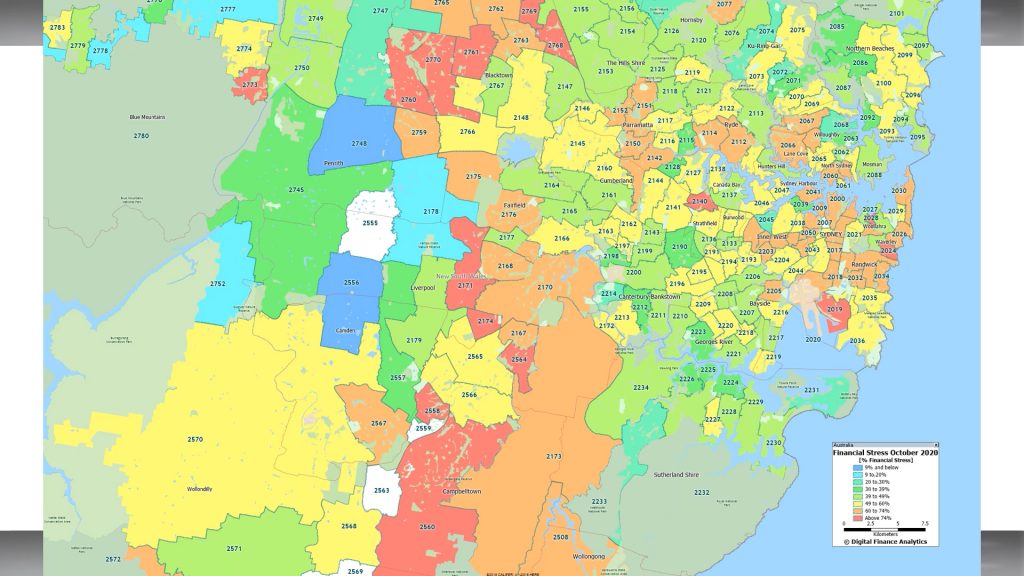
And for the first time we have mapped aggregate financial stress for each major centre, highlighting that pressures on households are impacting a range of locations. Generally the high-growth corridors show significant issues, but even more established areas are also under pressure.
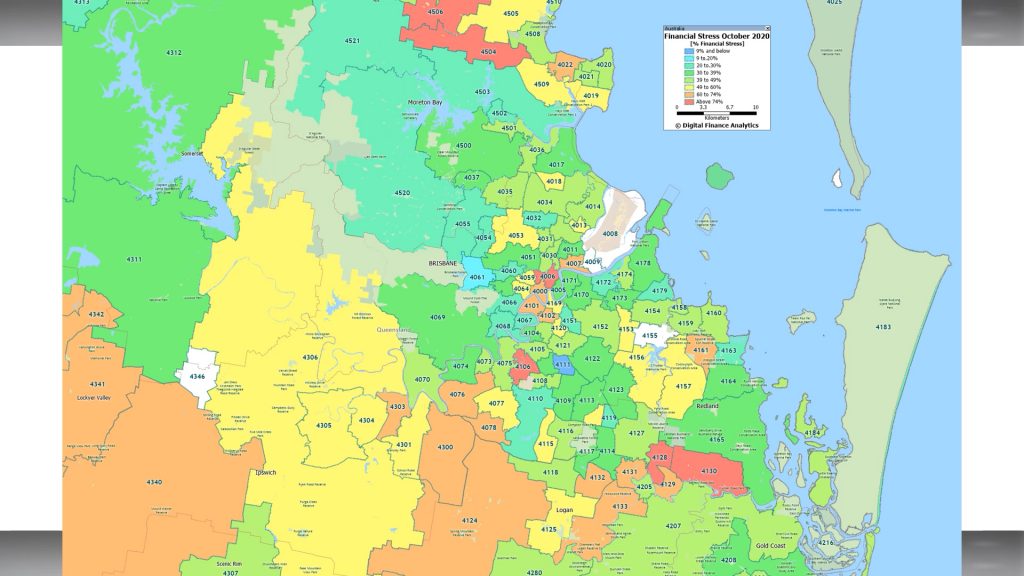
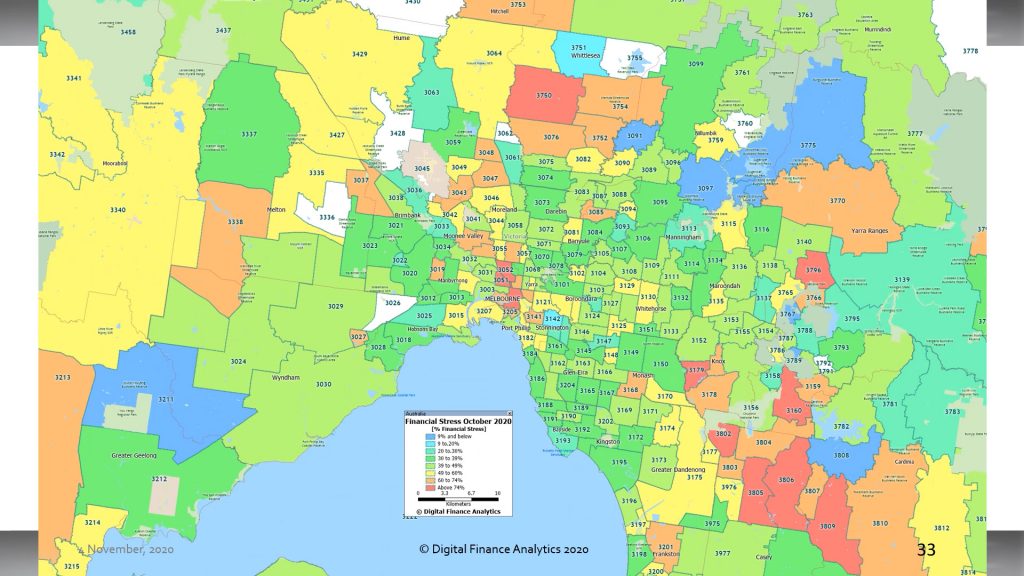


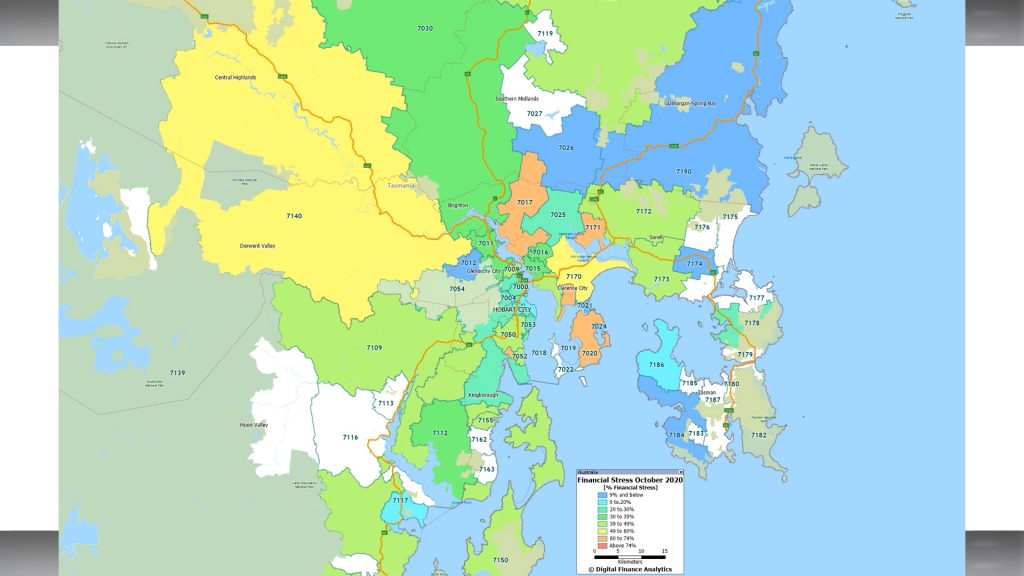
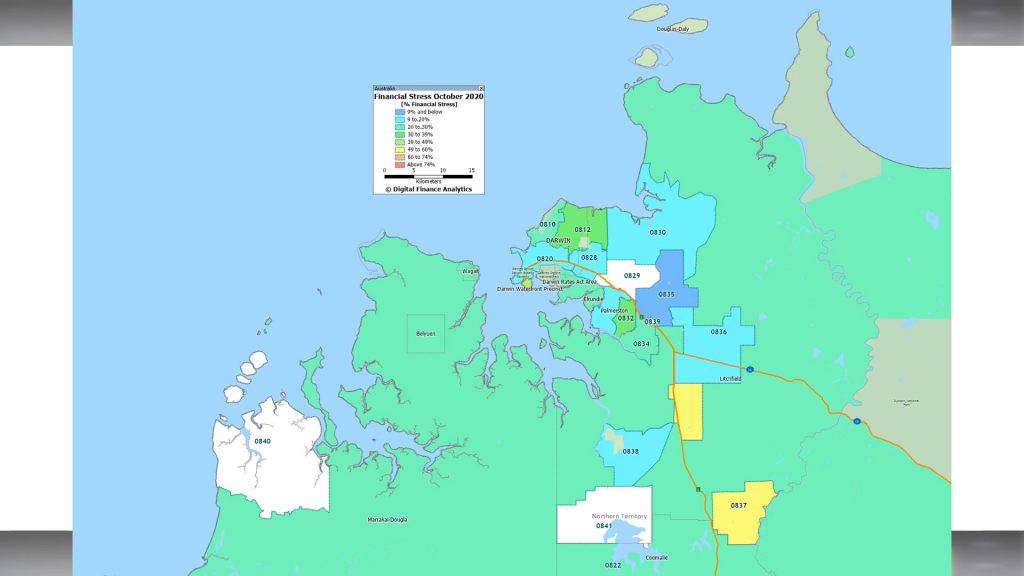
Our view is that we are still in the foothills of the financial crisis, and that as stimulus is withdrawn further, and unemployment continues to rise, stress will deteriorate.
FINAL Reminder – DFA Live in 20 Mins
Important show tonight – join us…
It’s Edwin’s Monday Evening Property Rant #10
The RBA To Cut Even Lower – The DFA Daily 2nd November 2020
The latest edition of our finance and property news digest with a distinctively Australian flavour.
A Spotlight On Point Cook And Werribee
The latest in our property analysts series looks at 3030.
Werribee is a suburb of Melbourne, Victoria, Australia, 32 km south-west of Melbourne’s Central Business District, located within the City of Wyndham local government area. Werribee recorded a population of 40,345 at the 2016 .
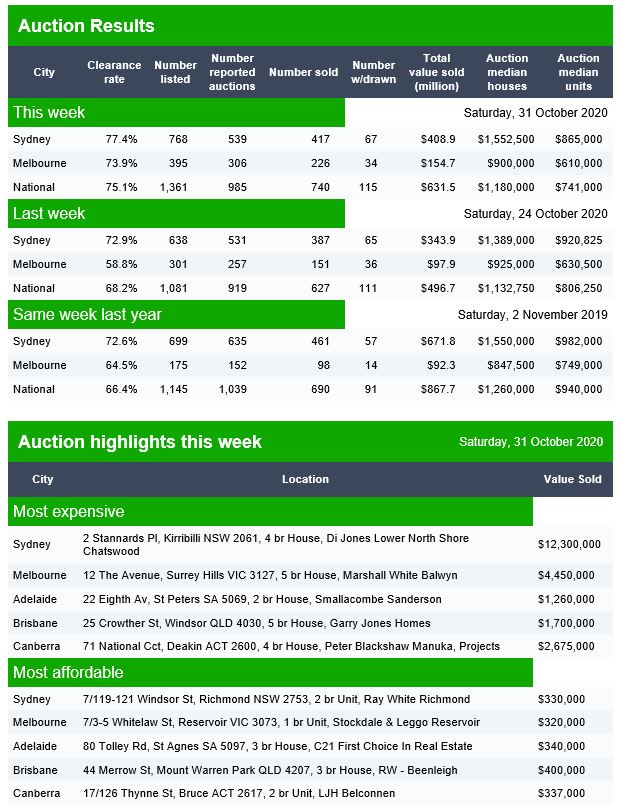
Auction Results 31 Oct 2020
Domain released their preliminary results for today. They note that “from Thursday July 9 the Victorian government placed a ban on public real estate auctions as part of social distancing measures to slow the spread of COVID-19. The number of auctions withdrawn in the immediate weeks following the ban are likely to be higher than normal”.

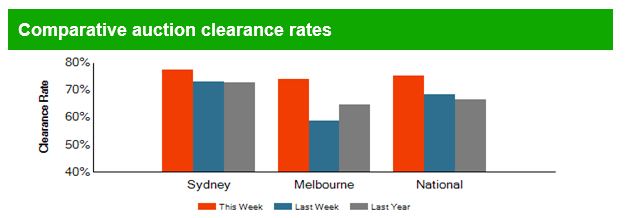
Canberra listed 65 auctions, reported 60, with 45 sold, 3 withdrawn and 12 passed in to give a Domain clearance of 75%.
Brisbane listed 41 auctions, reported 32, with 18 sold, 6 withdrawn and 8 passed in to give a Domain clearance of 56%.
Adelaide listed 36 auctions, reported 23, with 22 sold, 0 withdrawn and 1 passed in to give a Domain clearance of 96%.
The World Holds Its Breath … With Tarric Brooker
My latest chat with journalist Tarric Brooker who is @AvidCommentator on Twitter.
Giving Credit Where Credit Is Due – The DFA Daily 30th October 2020
We update the latest credit aggregates from the RBA, and lending stats and loan deferrals from APRA.
