Understanding my Australian Property Investment Breakeven

Here is an excellent article from Nucleus Wealth which spells out the true issues around property investment. So many investors have their heads in the sand!

The net effect is that at current prices, finding scenarios where property won’t lose you money over ten years is not that easy. Which means most buyers in today’s market should be doing so as a lifestyle choice rather than as an investment choice.

Recently, we have seen a few Nucleus investors cash in their capital and profits and take the real estate plunge. This, of course, is sometimes more a lifestyle choice than an economic one. Being locked five months in a small flat with a partner and boisterous progeny while working off a kitchen table can often change one’s perspectives. 

So what can economic conditions do I need to retain my deposit?

Given this is more about sanity than economics I start from the position that I am happy to walk away with no real profit after 10 years but I want to at least retain close to my initial capital.

To look at the various implications we will use the Nucleus Wealth Property calculator.   To start I need some initial details. Let’s take the case of my son as a working example. Say he is in Melbourne, has $100K saved for the deposit and has found his dream house available for $1m. The banks are willing to lend him the balance – no mean feat in this credit environment. Let us assume he intends to live in this house so there are no negative gearing tax benefits and he intends selling it in 10 years to move to the Bahamas as he expects to be an empty nester (a true dreamer).  

Thus using our Property Calculator and given we are optimists expecting a recovery from the COVID downturn we choose “Good Economic Conditions”, and use all the designated defaults to get:

Gulp!.. that’s not good… The problem with good economic conditions is that interest rate rises will limit your capital growth, and with 90% debt load the interest payments hurt. Note we are using rent received as rent “avoided” in these scenarios.

Perhaps we need to be even more optimistic so we choose “Property Paradise” conditions…which yields:


That’s more like it!! he can now afford a jacuzzi and a seaview. However a quick look at the underlying assumptions for Property Paradise yields …

While we are optimists, alas I am also a realist…. I tell him it is highly improbable he can lock-in 2.75% for 10 years, nor do I believe a 6% nominal Rent Growth year after year is realistic.

Thus we decide to input our own assumptions.

The first thing to note about the calculator is that by default it is designed for property investors that intend to rent their property. Thus as an owner-occupier (and as we are misers) we can reduce the re-investment in the property (depreciation rates to $600+halving repair assumptions) and dial down the other costs. The rental income should be viewed as money saved not paying rent, so the variables about lost rent/vacancies can be dialled down to 0.


That done, now we come to the key assumption for the calculator (and the investment outcome). What is my expectation for property prices? Investing in property implies we have an expectation property prices will recover over the next 10 years. This expectation of a property price rise can be incorporated into the calculator in a number of ways:

  • decreasing the Gross Rental yield
  • increasing the Mortgage Cost / Wage ratio
  • increasing the Property Price / Wage ratio
  • or increasing the default setting of the Mortgage Cost / Rent ratio.

We choose to alter the ratio of Mortgage Cost to Rent ratio as it is probably the easiest ratio to get a handle on. Data suggests this ratio is currently at 134%, but the long term graph suggests the 10-year average is closer to 160%.

With our expectation of post-COVID economic recovery and a resumption of Immigration to drive property demand, we take the view that this ratio should retrace toward its 10 year average of 160% (I chose to use 148% a rough midpoint between these values).

With that key assumption locked in, it is time to pull the various economic levers (inflation, rental growth, mortgage rate)  to find a breakeven investment such as:

So what economic expectation does my break-even result imply?    

  • The inflation rate would need to be 2%. This is at the lower end of the RBA band of 2-3% so not an unreasonable forecast over ten years, even if inflation is unlikely to be there anytime soon.   

  • Rental growth needs to be 2.5% (+0.5% real).  Over a ten year period this is possible. Given the slump in rents, and lack of immigration it is going to need a lot of growth in the second half of the decade. 

  • Lastly, I need to pay an average 4% mortgage rate over the 10 years.  While historically this is unprecedented, we are in atypical times and low-interest rates look to persist. A quick internet search shows Credit Unions are offering a 10 year fixed rates that are not too far off this mark, so perhaps it is an achievable goal.

As a good cross-check, using the “Compare Renting vs Buying” function in the calculator, we can confirm we are near break-even (with an assumed 0% return on the $100K over the period).

The calculator also highlights how the benefit of a geared property is mostly achieved at the tail end of the investment. i.e. if he only stays in the property for 5 years, he will be about $60k worse off than if he rented for the same period.   i.e. on the assumed property with stamp duty, mortgage insurance and other entry costs he will be out over $80k. Add in $20k to sell the property on the other side and his $100k is gone, relying on capital growth to make up the difference. 

Where to from here? 

Using the calculator we can thus find other scenarios that achieve break-even property result (1.5% inflation, 2% real Rental growth which then means I can lock in a more attainable 4.5% mortgage rate).  Alternatively, a more aggressive property price forecast of 160% (i.e. the 10-year average) mortgage cost to rent ratio means inflation could be 3%, rental growth of 3.5%, and my mortgage interest rate can now be a very achievable 5%.

Armed with these base-line cases a user can now test the sensitivities of these assumptions or explore their own expectations to assess the risks/benefits involved in not persevering with living and working on that kitchen table.

The net effect is that at current prices, finding scenarios where property won’t lose you money over ten years is not that easy. Which means most buyers in today’s market should be doing so as a lifestyle choice rather than as an investment choice. 

Bye-Bye Bubbleology: With Harry Dent

I caught up with Economist and Author Harry Dent on the day he called the top for the NASDAQ. We discussed bubbles and what happens when they pop.

Harry Dent is an American financial newsletter writer. His 2009 book, The Great Depression Ahead, appeared on the New York Times Bestseller List.

Upcoming webinar at: http://www.gokogroup.com/series

Mark Victor Hansen: The Ambassador Of Possibility

Mark Victor Hansen is an American inspirational and motivational speaker, trainer and author. He is best known as the founder and co-creator of the Chicken Soup for the Soul book series.

We discus how the right attitude of mind is critical.

You can hear more for free this Sunday on Mark’s upcoming webinar Mark Victor Hansen and Pat Mesiti

https://mesiti.com/chickensoup.

[DFA has no commercial relationship with this event].

Household Financial Confidence Hit Again

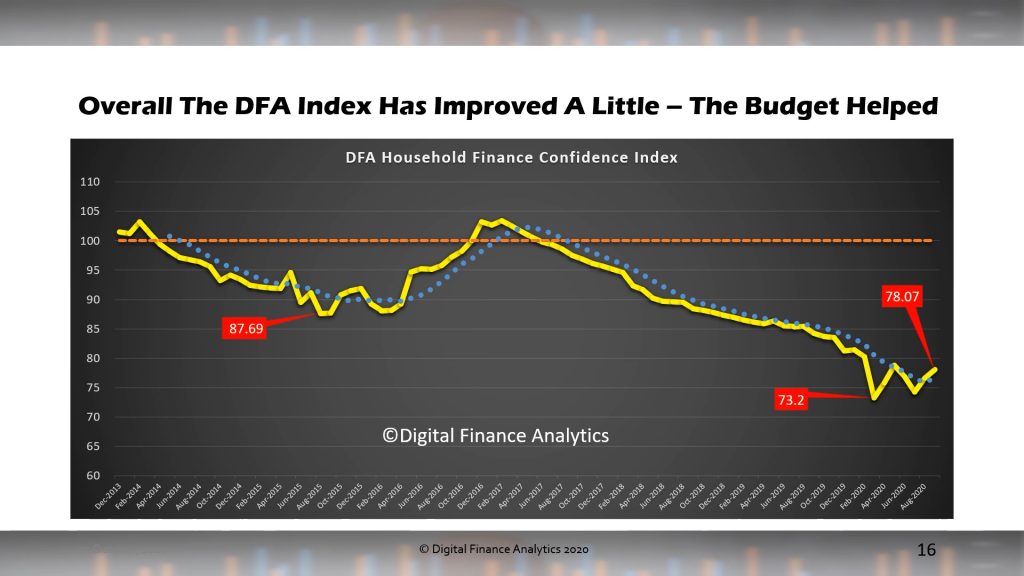
The latest results from our household surveys reveals that after a small recovery last month, confidence has deteriorated again. This is data to mid July, and includes the recent impact of renewed lock-downs in some areas. Indeed, significantly the Melbourne lock-down, and the broader concerns about COVID are responsible for the latest falls. No V-shaped recovery here.

We discussed this at length during our live stream yesterday.

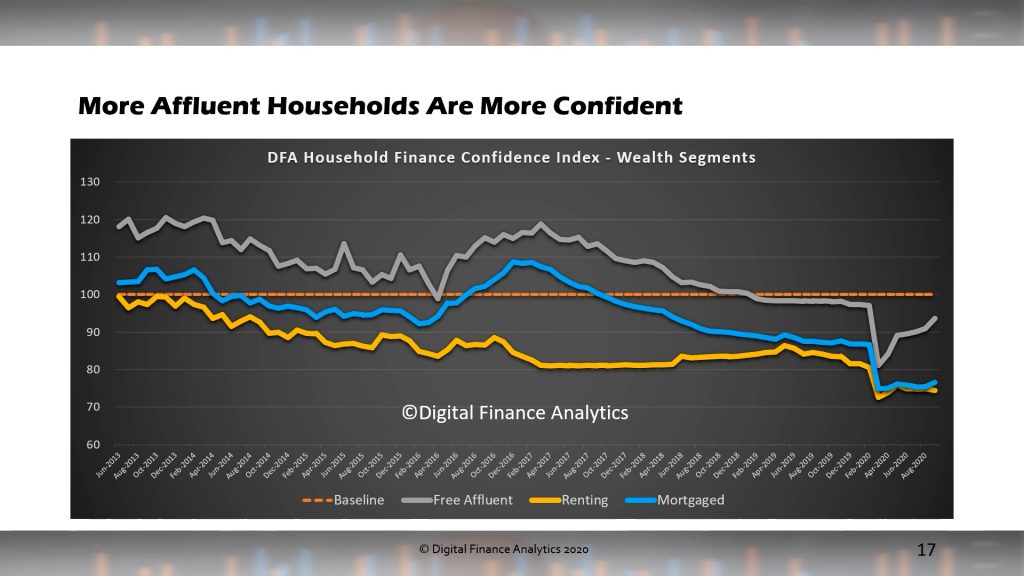
The DFA survey asks households to compare their financial status compared to a year ago across multiple dimensions, including income, costs, jobs, debt savings and net worth. We are also able to cut the data across multiple dimensions. For example, across our wealth segments, those with no mortgage, but holding mortgage free property and shares etc. are a little more confident, thanks to the financial market rebound. But those with mortgages, and those renting are both feeling the pressure.

Across the states, the pain is more extreme in VIC, and NSW, while the smaller states are moving higher, though still remain well below the neutral 100 average.

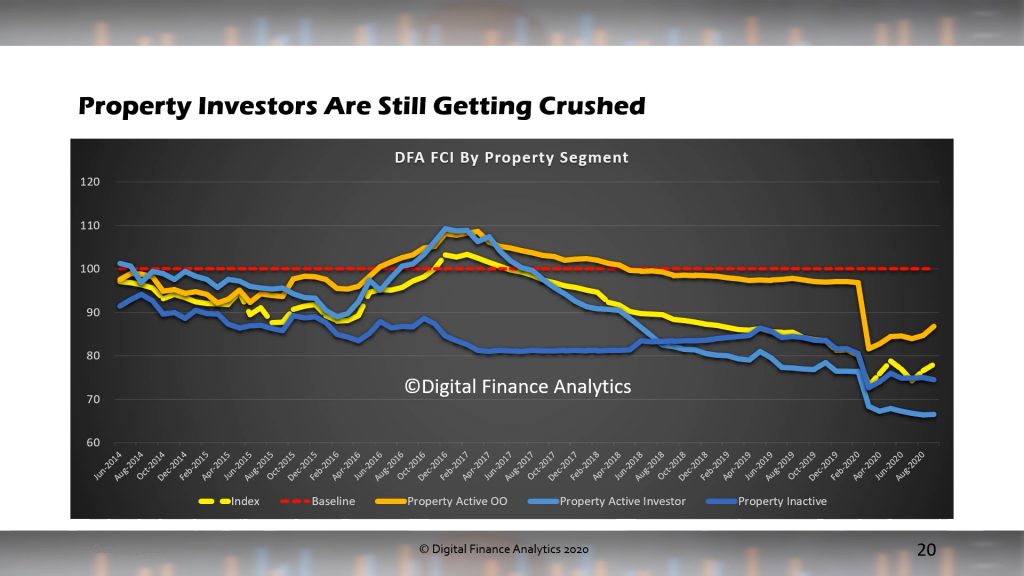
Across our property segments, property investors continue to slide, thanks to lower rental returns, higher vacancy rates, and little expect capital gain. No surprise then that more investors are seriously weighing up selling before further markets falls. Owner occupied property holders have benefited from lower interest rates as the surge of refinancing to lower mortgage rates continues. Renters are under pressure, because despite lower rentals for some, there are pressures relating to rental holidays (deferrals?).

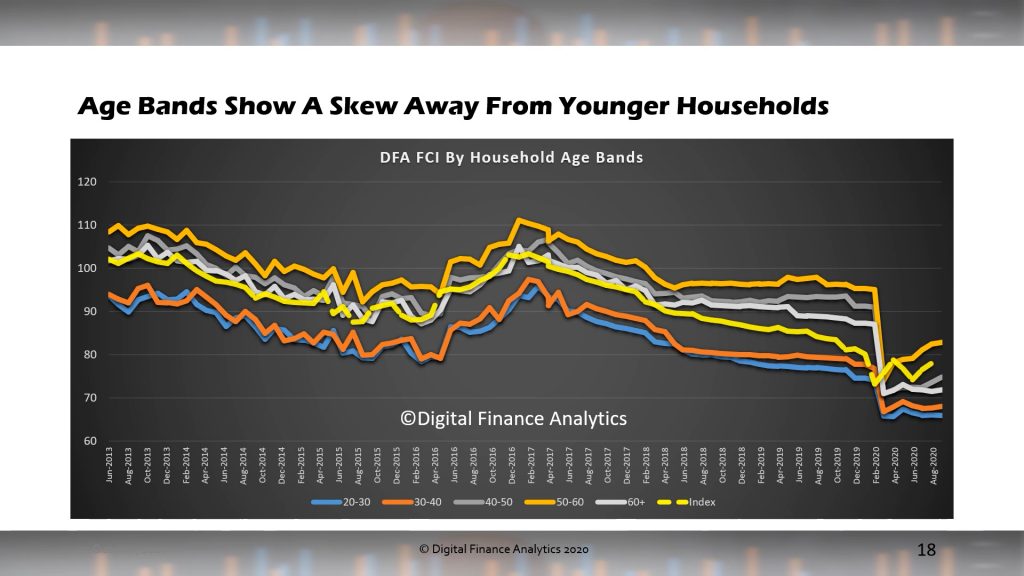
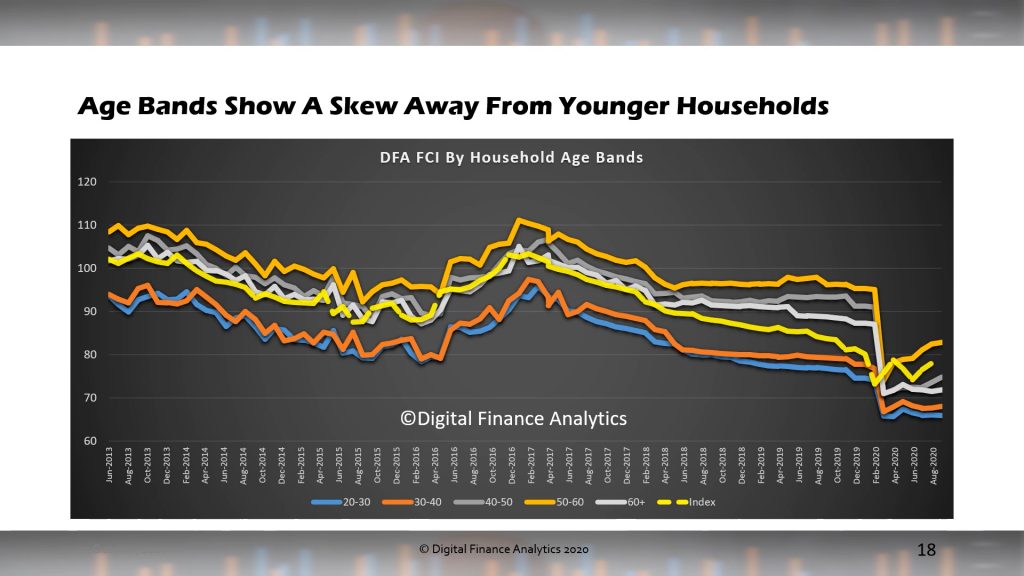
Across the age bands, those younger and older are seeing more pressure, whereas those in middle-aged bands improved slightly, because these cohorts have accumulated more assets and equity, and have relatively less debt. Older households are experiencing a real income drought thanks to lower returns on deposits, and lower expected dividends. More younger households are unemployed and job prospects are faltering.

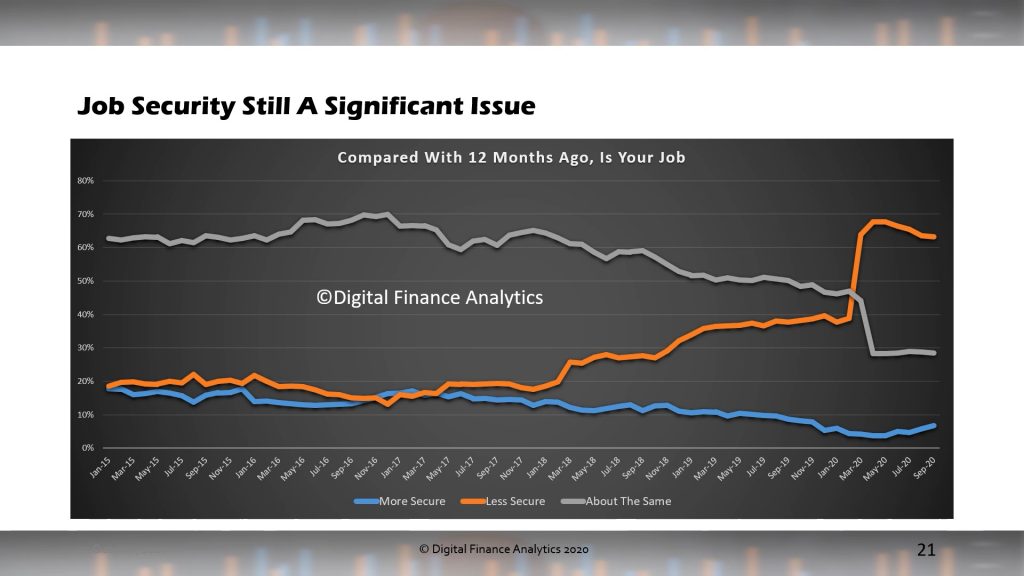
Across the elements which drives the survey, job security remains a major concern. There was a small drop in those feeling less secure, as some jobs came back, but over 68% of households remain concerned – which suggests they will be cautious ahead.

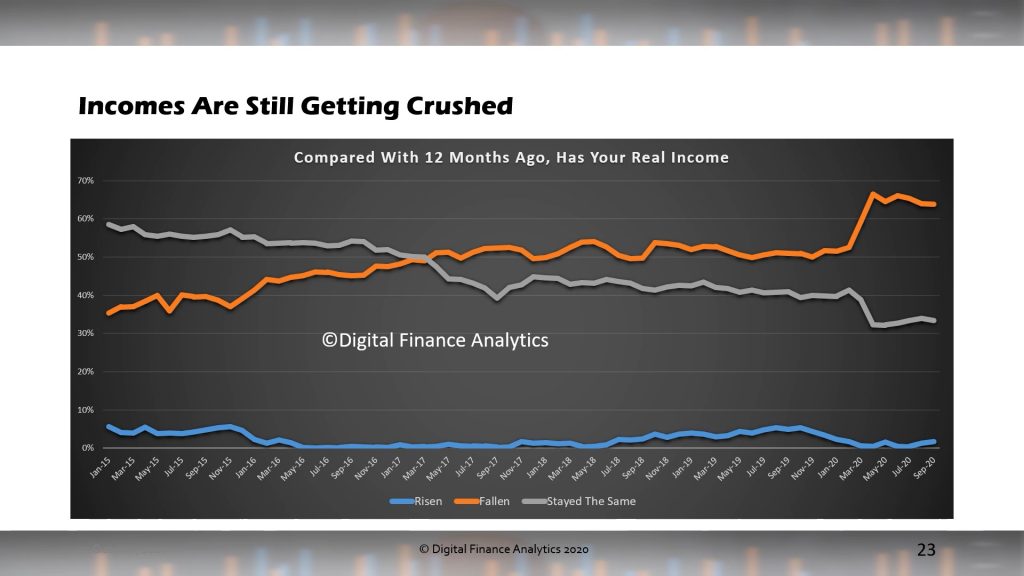
Income pressures have increased, with jobs evaporating, and less hours worked. This is the highest reading since we started running the survey.

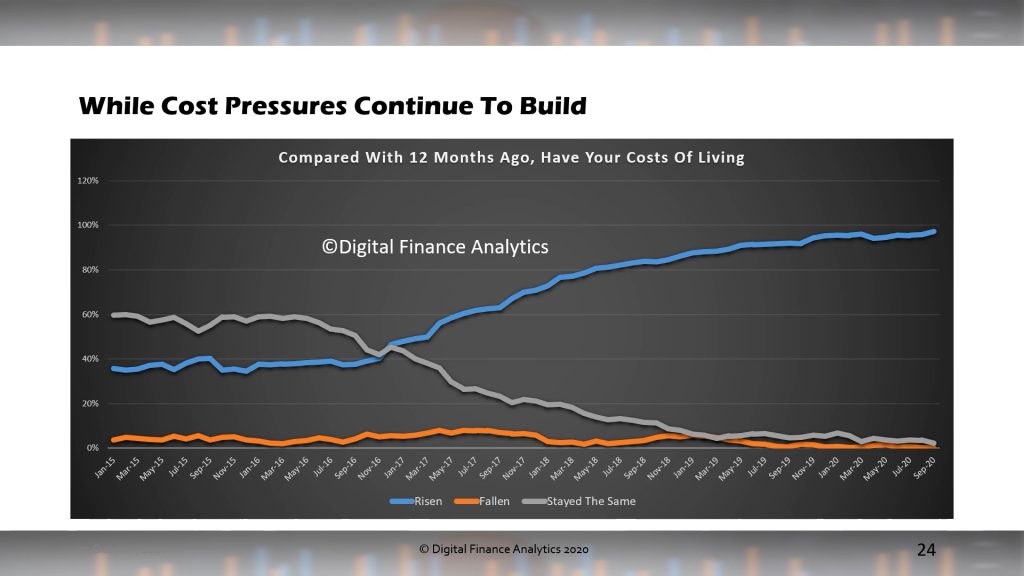
The question of costs continues, with many reporting increased costs of living way above the official cpi. This despite the increased working from home. Higher power costs from more home use was a stand out. The need to commence paying for childcare also hit home.

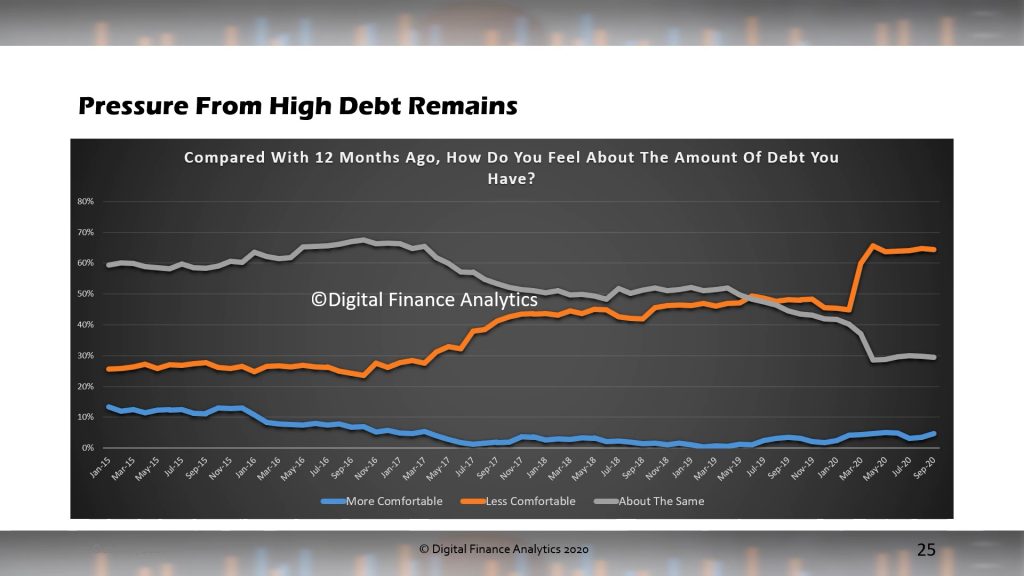
Debt remains a burden for those with mortgages and for households with other unsecured debts. More than 60% of borrowing households are worried abut their ability to service their loans. Many are seeking refinancing, or to use debt consolidation to try to reduce payments. And as we reported previously mortgage stress is as high as ever its been. We think defaults will follow, despite lenders’ repayment holidays.

Savings remain under pressure (although some on JobKeeper received more income than normal and have saved some of the funds, and superannuation withdrawals are also being horded by many to accessed the scheme). The pressure comes from needing to tap into savings for living expenses, and lower returns from deposits. More than 3 million households do rely in income from deposit accounts, and rates are close to zero now.

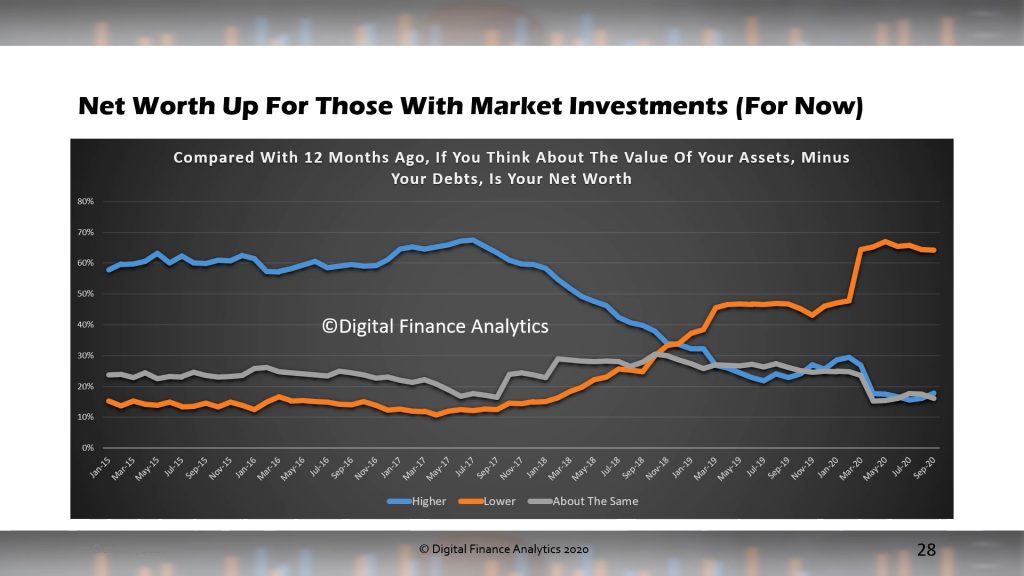
Finally, net worth has declined for more than 60% of households, thanks to lower property prices, though offset by higher stock prices. Forward expectations are also weaker, as more property price falls rises. Any market correction would also add more fuel to the fire.

So standing back, it is clear the household sector continues to be trapped in a web of concerns, and as a result their willingness to spend is likely to be crimped. Not good for future GDP. Until COVID is controlled, we have to expect confidence to continue to languish. This has some way to travel. Expect saw-tooth patterns of growth for the next couple of years.

Final Reminder: DFA Live 20:00 Sydney Tonight

We update our models to take account of the latest data, look at the news about JobSeeker and JobKeeper, and discuss the RBA’s comments. Plus we will have our postcode data online and also look at the latest financial confidence outcomes. Ask a question live via the YouTube chat.

Auction Results 18 July 2020

Domain published their preliminary results for today.

Withdraws are up and volumes down as COVID strangles the market again.

Canberra listed 23 auctions, reported 21 with 19 sold, 1 withdrawn and 2 passed in to give a Domain clearance of 86%

Brisbane listed 41 auctions, reported 18 with 13 sold, 3 withdrawn and passed in to give a Domain clearance of 62%.

Adelaide listed 32 auctions, reported 12 with 8 sold, 2 withdrawn and 4 passed in to give a Domain clearance of 57%.