
The latest edition of our finance and property news digest with a distinctively Australian flavour.
The American Paradox – With Salvatore Babones
Salvatore Babones is an American sociologist, associate professor at the University of Sydney, and an expert in the areas of Chinese and American economy and society. His research is related to macro-level structure of the world economy, with a particular focus on China’s global economic integration. Today we discuss the events in the USA.
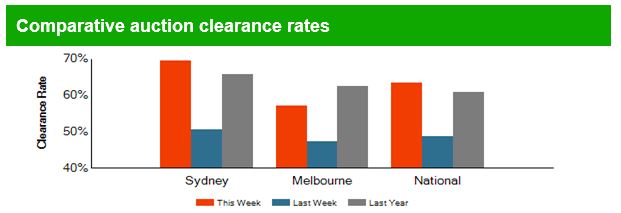
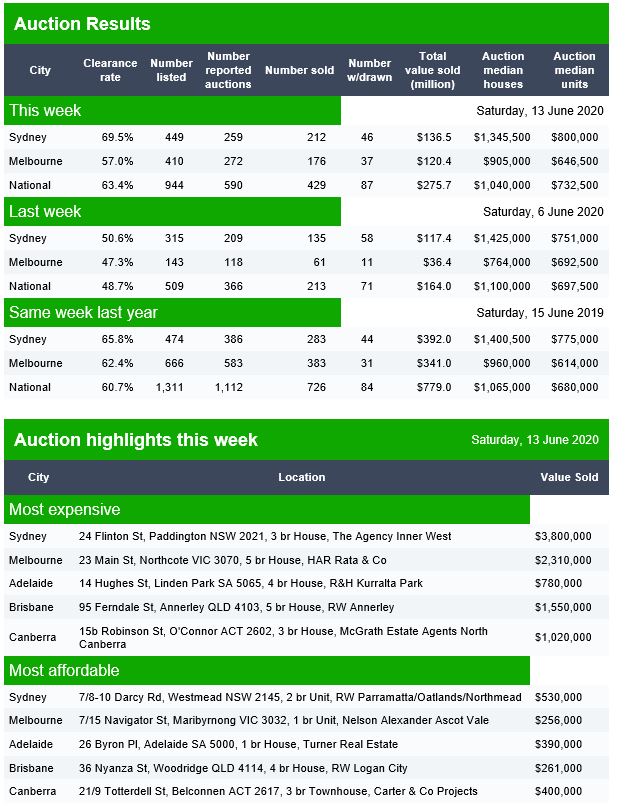
Auction Results 13 June 2020
Domain released their preliminary results for today. Volumes are a little stronger, though still well down on last year.

Canberra listed 25 auctions, reported 23 and sold 16 with 7 passed in to give a Domain clearance of 70%.
Brisbane listed 32 auctions, reported 23 and sold 17 with 2 withdrawn and 6 passed in to give a Domain clearance of 68%.
Adelaide listed 28 actions, reported 13 and sold 8 with 2 withdrawn and 5 passed in to give a Domain clearance of 53%
The Property Investor Party Is Over – The DFA Daily 13th June 2020
The latest edition of our finance and property news digest with a distinctively Australian flavour.
Next Live Event: https://youtu.be/QqMn3CRgpR4
Sell While You Can – The DFA Daily 12 June 2020
The latest edition of our finance and property news digest with a distinctively Australian flavour.
Full Nucleus Wealth article here: https://nucleuswealth.com/articles/you-are-being-given-a-rare-second-chance-to-sell-stocks/
DFA Live Show 16th June 2020: https://youtu.be/QqMn3CRgpR4
The Second Wave Risks – The DFA Daily 11 Jun 2020
The latest edition of our finance and property news digest with a distinctively Australian flavour.
Actions Have Consequences – The DFA Daily 10th June 2020
The latest edition of our finance and property news digest with a distinctively Australian flavour.
Depositors Schmositors! With Steve Mickenbecker
I caught up with Steve Mickenbecker, Group Executive, Financial Services & Chief Commentator at Canstar to discuss the latest in deposit account rates as they fall though the fall.
Note: DFA has no commercial relationship with Canstar
DFA Live Q&A With Tony Locantro Replay (HD Edited Edition)
Tony Locantro, from Alto Capital joins us for a robust Q&A session, including some thoughts about stocks, the markets and more.
https://www.altocapital.com.au/
The original live edition, with YouTube chat is also available:
V’s, W’s, X’s Or U’s What Is It? – With George Gammon
George and I have another deep conversation about the markets – and we learn much from Blackjack!
George: https://www.youtube.com/channel/UCpvyOqtEc86X8w8_Se0t4-w