
The latest edition of our finance and property news digest with a distinctively Australian flavour.
Inside Bitcoin – With Caroline Bowler
Bitcoin’s halving is four days away, and so I caught up the Caroline Bowler, the CEO of BTC Markets to discuss the consequences of the event.
Note: This was not a paid promotion.
How Lucky Is The Luck Country? – The DFA Daily 7th May 2020
The latest edition of our finance and property news digest with a distinctively Australian flavour.
How Low Will The NZ GDP Go? – With Joe Wilkes
The latest from NZ with our resident property insider.
The Long Slow Crunch – The DFA Daily 6th May 2020
The latest edition of our finance and property news digest with a distinctively Australian flavour.
Is Good News Bad News? – With Edwin Almeida
Property Insider Edwin Almeida and I discuss the latest development in the Australian property market. What is the implications of the opening up of home inspections?
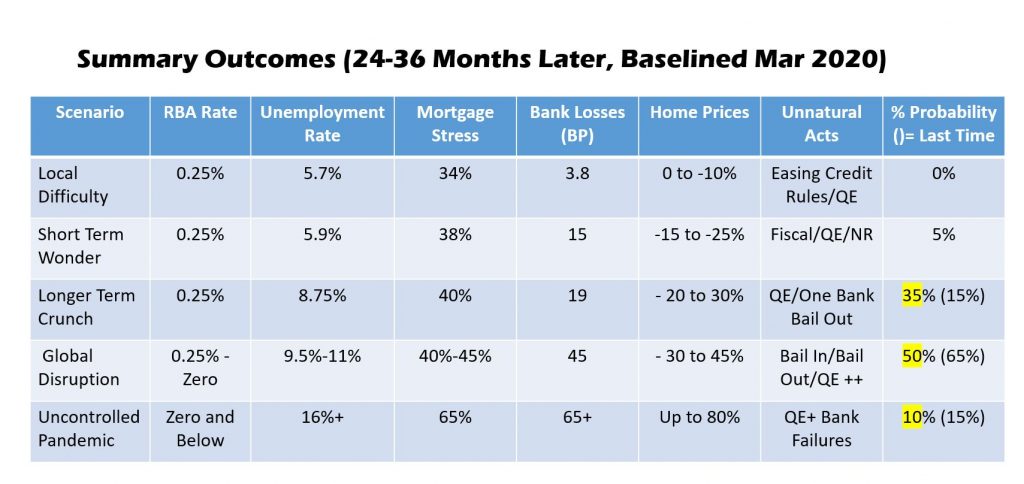
Latest DFA Live Q&A 5th May 2020
We ran our live show, complete with updated data and scenarios, plus answering questions real time via YouTube chat. How much will mortgage stress be up? What is the trajectory of potential defaults? Which post codes are most in the front line? All are answered
Banking On The Banks – The DFA Daily 4th May 2020
The latest edition of our finance and property news digest with a distinctively Australian flavour.
Tomorrows live Q&A:
Is The U.S. Vs China True? – With Salvatore Babones
Salvatore Babones, Associate Professor University of Sydney joins me to discuss the question of the China U.S relationship. He suggests it is not what is being reported.
https://policy.bristoluniversitypress.co.uk/american-tianxia
A Matter Of Perspective – The DFA Daily 3rd May 2020
The latest edition of our finance and property news digest with a distinctively Australian flavour.
Our upcoming live event on Tuesday 5th May 20:00 Sydney