Sentiment Versus Fundamentals – The Property Imperative Weekly 11th January 2020

The latest edition of our weekly finance and property news digest with a distinctively Australian flavour.

CONTENTS:

  • 00:23 Introduction
  • 01:00 World Bank Global Economics Prospects
  • 04:10 US Jobs
  • 05:30 US Markets
  • 08:30 Gold
  • 09:30 UK
  • 10:25 Europe
  • 11:05 China
  • 11:20 Japan
  • 12:05 Bitcoin
  • 13:40 Australian Segment
  • 13:40 Retail
  • 15:10 Mortgage Stress
  • 15:40 Building Approvals
  • 16:00 Home Prices
  • 16:40 Bushfires Impact
  • 20:10 AUS Markets

January Live Show: https://youtu.be/Z03jkJEmvOI

The Weather Bureau Says Its Been The Hottest Driest Year On Record [Video]

We look at the latest BOM data, and consider the implications in the context of the current politicisation of climate change and bush fires debate.

With the help of an article from the Conversation, we examine some of the underlying issues.

Politicians Fumble Through The Bushfire Crisis

From The Conversation. As someone who has studied Australian climate policy and politics closely, this summer’s bushfire crisis have been both heartbreaking and bewildering. The grave warnings politicians ignored for so long have now come to pass.

The fires may be without precedent, but these dark weeks have also brought an overwhelming sense of déjà vu. It’s hard to believe, but the Morrison government’s fumbling response to the fires and the broader climate crisis is in many ways history repeating.

From the disastrous optics of Prime Minister Scott Morrison’s trip to Hawaii to blaming conservationists for the fires, our politicians keep making the same blunders and rolling out the same failed strategies.

Here are five recurring themes in Australian politics when it comes to climate change and bushfires:

1. Blaming ‘greenies’

As the fire season ramped up in November last year, New South Wales Nationals leader John Barilaro accused the Greens of preventing governments from conducting hazard reduction burning, implying the party should shoulder blame for the fires.

“We’ve got to do better and I know that we don’t do enough hazard reduction […] because of the ideological position from the Greens,” he said.

Such sentiment, which has been thoroughly debunked, regularly surfaces when bushfires rage.

Following the 2003 Canberra fires and 2009 Victorian fires, the forest industry said conservationists were preventing state governments from conducting hazard reduction burns.

After Victoria’s fires, former West Australian MP Wilson Tuckey also blamed the Greens, and parties seeking their preferences, for preventing controlled burns and causing the crisis.

2. Stoking a city versus country divide

In November last year, Nationals leader Michael McCormack sneered that those who made the link between climate change and bushfires were “raving inner-city lunatics” and “woke capital-city greenies”.

McCormack continues a long tradition of those opposed to strong climate action claiming only inner-city dwellers care about the issue.

It began in the late 1980s, when the the “greenhouse effect” first became a public issue. Some politicians derided it as just another greenies scare campaign, including frontbencher in the Hawke Labor government, Peter Walsh.

Walsh, contemptuous of the Greens movement, continued to rail against climate action after leaving politics. He reportedly described the science around global warming as “highly speculative” and as late as 2008 claimed action on climate “would land us in Middle Ages.”.

3. Experts ignored by politicians

Since April last year, former fire chiefs have implored the Morrison government to act on climate change and better prepare the nation for extreme fire seasons ahead. The government would not meet the experts to hear the advice, let alone implement it.

Successive governments have form when it comes to ignoring experts on climate matters. In September 1994 the CSIRO’s then top climate scientist, Graeme Pearman, briefed the Labor government’s cabinet about the likely impacts of climate change, as a debate over whether to institute a carbon tax heated up. Despite the warning, no tax was implemented.

Pearman retired a decade later under the Coalition government, reportedly having been asked by his superiors to resign for expressing views on climate change at odds with government policy.

4. Leaders not fronting up

Morrison’s decision to take a family holiday in Hawaii as the bushfire crisis grew lost him serious political skin.

Some argue, rightly, that symbolism is less important than substance, and so Morrison’s trip is itself irrelevant. But symbolism creates or destroys both morale, and the possibility of stronger political action.

In 1992 newly minted Labor prime minister Paul Keating sent environment minister Ros Kelly to the Rio Earth Summit, prompting one journalist to observe he was “preoccupied with winning the upcoming election (and) said he wasn’t going all the way to Rio to give a six-minute speech”.

It made Australia the only OECD nation not represented by its head of state, and sent the message that Australia was not taking a serious approach to the discussions.

5. ‘Jobs, jobs, jobs’ mantra

The Bureau of Meteorology this week confirmed this season’s horror bushfire crisis is linked to climate change. Planetary warming is clearly a threat to the nation’s economic well-being.

However Australian governments have routinely created a false dichotomy between environmental protection and jobs. Most recently, we’ve seen it in the Coalition government’s support for the Adani coal mine in central Queensland, and its repeated mantra of “jobs jobs jobs”.

The strategy has been used before. After the Franklin Dam fight in 1983, concern over environmental issues entered the political mainstream. But as former Labor science minister Barry Jones said later, that changed in 1991 when economic recession hit.

“Jobs, jobs, jobs became the priority and in some quarters there was a cynical reaction suggesting that environmental issues were luxuries which characterised affluent times […] This is a criminally short-sighted view,” he said.

What to do?

Only sustained citizen pressure will prevent a repeat of the past 30 years of political failures on climate change. The public must stay informed and demand better from our elected representatives.

Politicians can, when pressed, make better decisions. In April last year, the New Zealand government banned offshore oil and gas exploration after years of public pressure. And the following month, the UK Parliament declared a climate emergency after months of protests by activist group Extinction Rebellion.

It’s often said those who fail to learn from history are doomed to repeat it. But the world must act radically in the next decade to avoid catastrophic global warming. We cannot afford another 30 years of the same old mistakes.

Author: Marc Hudson, Researcher on sociomaterial transformations, social movements, Keele University

Fitch Ratings Expects Subdued Global Home Price Growth Despite Low Rates

Fitch Ratings forecasts subdued home price growth around the globe over the next couple of years due to a combination of stretched affordability, more challenging macro-economic conditions and macro-prudential measures restricting mortgage eligibility. This is despite falling or very low mortgage rates, insufficient supply in major cities and stable or improved employment levels in most countries.

Political risks and their impact on economic growth and policy decisions are also affecting our housing outlooks with lingering US-China trade uncertainty, despite the recent easing in tensions, and China’s de-risking drive, Brexit, and developments around mortgage and housing policy beginning to take a toll.

The US-China trade dispute and China’s de-risking drive are weighing on global and national growth prospects, not only for the US and China, but also for their closest trading partners (such as Australia and Canada) and areas like the EU that are exposed to global trade.

“Weaker economic growth is a key driver of more modest home price growth forecasts. UK home price growth will continue to be affected by lingering trade ‘cliff edge’ risks until the new UK-EU relationship is negotiated. Although the newly elected Conservative government is expected to pursue a formal exit next month, there is more uncertainty about its ability to negotiate a UK-EU Free Trade Agreement by the end of 2020,” said Suzanne Albers, Senior Director of Structured Finance at Fitch.

In some countries, there is also uncertainty around mortgage and housing policy. The US and Canada are reducing the government’s role in mortgage funding while in Mexico and Colombia new national housing plans may increase government participation.

Of the 24 countries covered in the report we expect a nominal price fall only in Italy and Japan, due to Italy’s sluggish economy and Japan’s post-Olympics hangover and a decline in real prices in Brazil, Canada, China and the UK. We also forecast accelerating growth in Australia and Sweden, where prices are recovering from recent falls, as well as in New Zealand and Colombia.

We forecast low arrears levels for most countries covered in the report in light of flat or falling policy rates. However, we also have concerns about long-term low rates. Under a market stress, the limited scope for further policy rate cuts would mean that home prices would not benefit from substantial rate cuts as per recent downturns.

In this low interest-rate environment, lenders are also struggling to originate the volumes needed to defend profits, which has resulted in higher loan-to-values (LTVs) and longer maturities being offered in several European countries. Household debt levels remain the highest in Australia, Canada, Denmark, the Netherlands and Norway, making their economies more exposed to shocks and borrowers more vulnerable to downturns.

Longer-term, the push towards ESG investments may change housing investment and mortgage funding.

“Fitch expects climate change will permanently affect housing demand in areas that are already or could become more exposed to natural disasters, if they fail to attract new buyers or affordable insurance. Population redistribution to cities will continue, which will support cities’ higher price dynamism, but conversely ageing populations and developments in remote working and self-driving vehicles are likely to also drive regional prices,” adds Albers.

Mortgage Stress Shoots Higher In December

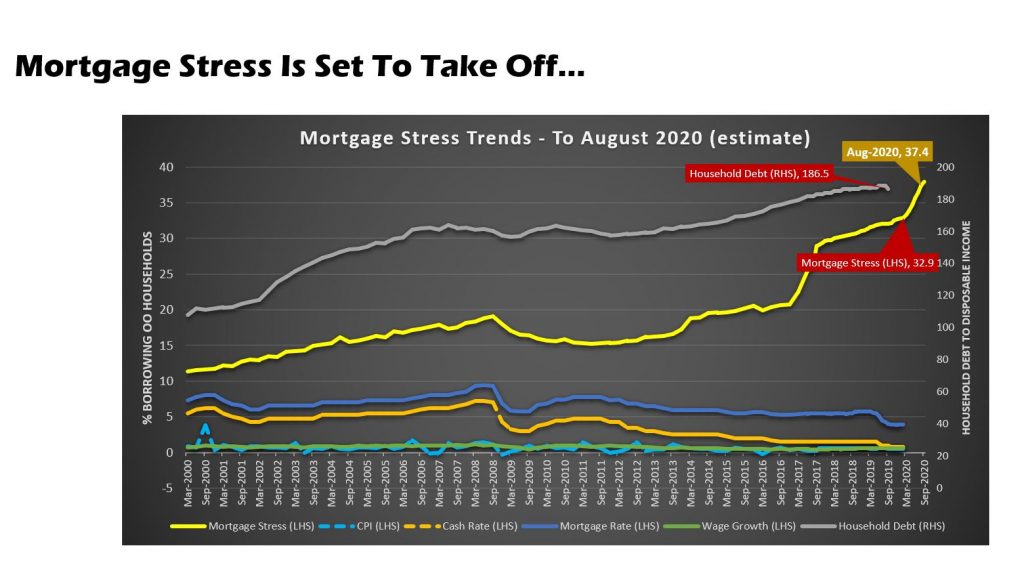
We are releasing the results of our rolling household surveys, which were completed before the latest round of bushfires started raging. Nevertheless, the results are a concern because the total number of households registering as financially stressed rose again, to 32.7% of borrowing households. This represent 1.1 million households across the country and a predicted default count of 83,220, despite lower cash rates, and some deeply discounted mortgages.

Stress is assessed in cash-flow terms, and when money in is not sufficient to cover the costs of the mortgage and other regular outgoings, the household is flagged as stressed. Granted they may have the capability to tap into deposits, pull down on credit cards, or even sell property, but on a regular basis they are in strife. We find a significant gap between those we assess as at risk, and those who believe they do have financial difficulty. Many adopt the head in the sand approach and hope things will improve, but given the current economic outlook, we think that is a courageous stance to take.

The RBA reported their E2 Selected Household ratios to September just before Christmas and weirdly, the entire debt to income ratio series was restated lower, not just the current quarter, but back through the series. As a result the average debt to income ratio dropped from 191 to a still high 186.5. We always have a issue with this series because it includes small business and households without borrowings, but the downshift in the series is quite significant, and unexplained. I have written to the RBA asking for an explanation. Note this is not the first time the series has been revised down, yet they do not include any explanation in the dataset.

Across the states, NT, SA and TAS recorded the highest proportion of households in difficulty, though WA has the highest default probability risk over the next 12 months at 4.2%, whereas the three most populous states, VIC, NSW and QLD sat at 2.2%. Victoria proportionally to New South Wales has a higher mortgage stress reading.

Among the DFA household segments, 57% of young growing households are in mortgage stress, and within this group there is a large cohort of first time buyers. 2.5% of these households risk default in the next 12 months.

47.5% of battling urban households are also in mortgage stress, and 1.7% risk default ahead. Many of these households occupy properties in the urban fringe, often on newish high density estates. The largest cohort is the disadvantaged fringe group, with 300,000 households in stress and 13,00 risking default. Stress continues to build in our more affluent segments too, with young affluent households at 11.3%, or 4,400 households and exclusive professionals at 21.5% in stress and 3.4% risking default. Losses from this exclusive group are expected to be as high as $1 billion dollars, and is the most value exposed group from a lender perspective.

Across the regions, the Central West of Queensland has 75% of households in stress, but only 300 households, followed by Alice Springs at 65% with around 2,000 households exposed.

In the larger urban centres Adelaide has 35.9% of households exposed, which equates to 75,000 households, followed by Brisbane and Moreton Bay at 29.2% or 148,000 household, Melbourne at 28.9% or 213,000 households and Sydney at 26.9% with 178,000 households under stress.

And across the top post codes, Toowoomba 4350, is the highest count at 7,300 households, or 48%, followed by Liverpool 2170 at 49% or 7,080 households, Fountain Gate and Narre Warren 3805 with 6,918 households or 59% and in WA Hocking, Tapping and Wanneroo with 45% of households equating to 6,732.

Given the current economic settings we expect stress to continue to rise. And shortly we will be looking at the latest household financial confidence index from DFA, which continues to highlight challenging times for more and more households.

But in closing, as I often say, households would do well to draw up a cash flow, to identify money in and money out, determine which spending is essential and prioritise accordingly. And remember, if you are in financial difficulty banks have an obligation to assist, so go talk to them, early. Avoid the head in the sand posture, as it leaves other parts horribly exposed!!

A Month To Stop The Great Bank Conspiracy!

Economist John Adams and Analyst Martin North discuss the Cash Restriction Bill with Emilie Dye, Policy Director, Australian Taxpayers’ Alliance.

In powerful testimony before the Senate, Emilie highlighted the risks of being trapped in the banking system as a result of this legislation, and the real risks of being “de-banked”. People should not be forced to use banking services.

The Australian Taxpayers’ Alliance has some useful information and tools relating to the war on cash here.

Weather Bureau – “Hottest, Driest Year On Record”

The Bureau of Meteorology’s annual climate statement just released confirms 2019 was the nation’s warmest and driest year on record. It’s the first time since overlapping records began that Australia experienced both its lowest rainfall and highest temperatures in the same year. Via The Conversation.

The national rainfall total was 37mm, or 11.7%, below the 314.5 mm recorded in the previous driest year in 1902. The national average temperature was nearly 0.2°C above the previous warmest year in 2013.

Globally, 2019 is likely to be the second-warmest year, with global temperatures about 0.8 °C above the 1961–1990 average. It has been the warmest year without the influence of El Niño.

Across the year, Australia experienced many extreme events including flooding in Queensland and large hail in New South Wales. However, due to prolonged heat and drought, the year began and ended with fires burning across the Australian landscape.

The effect of the long dry

Bushfire activity for the 2018–19 season began in late November 2018, when fires burned along a 600km stretch of the central Queensland coast. Widespread fires later followed across Victoria and Tasmania throughout the summer.

Persistent drought and record temperatures were a major driver of the fire activity, and the context for 2019 lies in the past three years of drought.

The dry conditions steadily worsened over 2019, resulting in Australia’s driest year on record, with area-average rainfall of just 277.6mm (the 1961–1990 average is 465.2 mm).

Almost the entire continent experienced rainfall in the lowest 10th percentile over the year.

Record low rainfall affected the central and southern inland regions of the continent and the north-eastern Murray–Darling Basin straddling the NSW and Queensland border. Many weather stations over central parts of Australia received less than 30mm of rainfall for the year.

Every capital city recorded below average annual rainfall. For the first time, national rainfall was below average in every month.

Record heat dominates the nation

2019 was Australia’s warmest year on record, with the annual mean temperature 1.52°C above the 1961–1990 average, surpassing the previous record of 1.33°C above average in 2013.

January, February, March, April, July, October, November, and December were all amongst the ten warmest on record for Australian mean temperature for their respective months, with January and December exceeding their previous records by 0.98°C and 1.08°C respectively.

Maximum temperatures recorded an even larger departure from average of +2.09°C for the year. This is the first time the nation has seen an anomaly of more than 2 °C, and about half a degree warmer than the previous record in 2013.

The year brought the nation’s six hottest days on record peaking at 41.9°C (December 18), the hottest week 40.5 °C (week ending December 24), hottest month 38.6 °C (December 2019), and hottest season 36.9 °C (summer 2018–19).

The highest temperature for the year was 49.9 °C at Nullarbor (a new national December record) on December 19 and the coldest temperature was –12.0°C at Perisher Valley on June 20.

Keith West in southeast South Australia recorded a maximum 49.2°C on December 20, while Dover in far southern Tasmania saw 40.1°C on March 2, the furthest south such high temperatures have been observed in Australia.

Accumulating fire danger over 2019

The combination of prolonged record heat and drought led to record fire weather over large areas throughout the year, with destructive bushfires affecting all states, and multiple states at once in the final week of the year.

Many fires were difficult to contain in regions where drought has been severe, such as northern NSW and southeast Queensland, or where below average rainfall has been persistent, such as southeast Australia.

The Forest Fire Danger Index, a measure of fire weather severity, accumulated over the month of December was the highest on record for that month, and the highest for any month when averaged over the whole of Australia.

Record-high daily index values for December were recorded at the very end of December around Adelaide and the Yorke Peninsula in South Australia, East Gippsland in Victoria and the Monaro in NSW. These regions which experienced significant fire activity.

Don’t forget the floods

Amidst the dry, 2019 also included significant flooding across Queensland and the eastern Top End.

Heavy rain fell from January into early February, with damaging floods around Townsville and parts of the western Peninsula and Gulf Country.

Tropical cyclone Trevor brought further heavy rainfall in April in the eastern Northern Territory and Queensland. Floodwaters eventually reached Lake Eyre/Kati Thanda which, amidst severe local rainfall deficiencies in South Australia, experienced its most significant filling since 2010–11.

There was a notable absence of rainfall on Australia’s snow fields during winter and spring which meant less snow melt. Snow cover was generous, particularly at higher elevations.

What role did climate change play in 2019?

The climate each year reflects random variations in weather, slowly evolving natural climate drivers such as El Niño , and long-term trends through the influence of climate change.

A strong and long-lived positive Indian Ocean Dipole – another natural climate driver – affected Australia from May until the end of the year, and played a major role in suppressing rainfall and raising temperatures for much of the year.

Spring brought an unusual breakdown of the southern polar vortex which allowed westerly winds to affect mainland Australia. This reduced rainfall, raising temperature and contributing to the increased fire risk.

Climate change continues to cause long-term changes to Australia’s climate. Conditions in 2019 were consistent with trends of declining rainfall in parts of the south, worsening fire seasons and rising temperatures.

Authors: David Jones, Climate Scientist, Australian Bureau of Meteorology; Karl Braganza, Climate Scientist, Australian Bureau of Meteorology; Skie Tobin, Climatologist, Australian Bureau of Meteorology