Tony Locantro from Alto Capital discusses his thoughts. Note the important disclaimers. This is not financial advice.
The
inf0rmation contained in this video is GENERAL IN NATURE and not should be
relied upon. Do not act on the content provided without first consulting your
advisor to determine whether the advice is appropriate for your investment
objectives. This is not intended to influence your decisions. DFA and Martin
North have not received any benefit from this video, and it’s the opinion of
Tony Locantro only and not Alto Capital or associates.
Tony
Locantro/clients have extensive holdings and has raised money for the companies
covered and paid fees for such service.
All
companies are to be considered HIGHLY SPECULATIVE IN NATURE
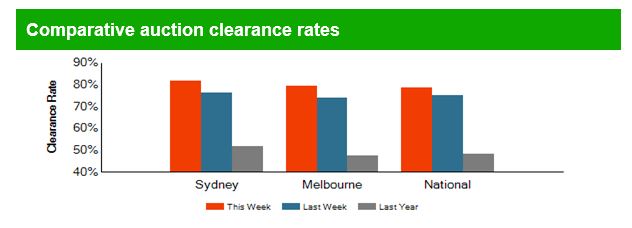
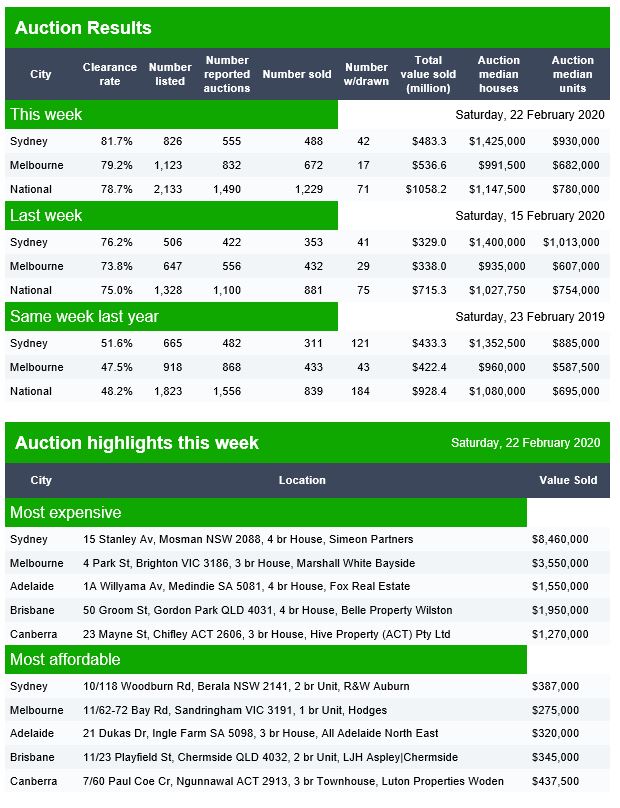
Domain released their latest preliminary results last Saturday. This is posted late due to DFA maintenance, but we have been asked to share as normal, if delayed.
Canberra listed 60 auctions, with 43 results in and 30 sold, 1 was withdrawn and 13 passed in to give a Domain clearance of 68%.
Brisbane listed 68 auctions, with 30 results in and 19 sold, 6 were withdrawn and 11 passed in to give a Domain clearance of 53%.
Adelaide listed 56 auctions, with 30 results and 20 sold, 5 were withdrawn and 10 passed in.
The latest edition of our weekly finance and property news digest with a distinctively Australian flavour.
Contents:
00:20 Introduction 0:45 US Markets 1:30 The WHO 3:20 US Economy 5:00 Supply Chain disruptions 07:45 China stimulus 10:20 Eurozone 11:35 HSBC 13:00 Bitcoin and Fedcoin 16:15 Australian Segments 16:20 Economic data 18:50 Bendigo Bank 20:20 Brokers Best Interests Duty 21:40 Poverty Line 23:30 Property Markets 28:20 Aussie Markets
For followers of the DFA blog, we are making some changes under the hood to our archives and blogging system. As a result, until further notice, posts from the blog will cease. However, we will still be releasing content via our Twitter, YouTube and Patreon channels.
We will let you know when normal service is restored. It may be a few days…
We have outgrown our current systems… (which is a good thing…)
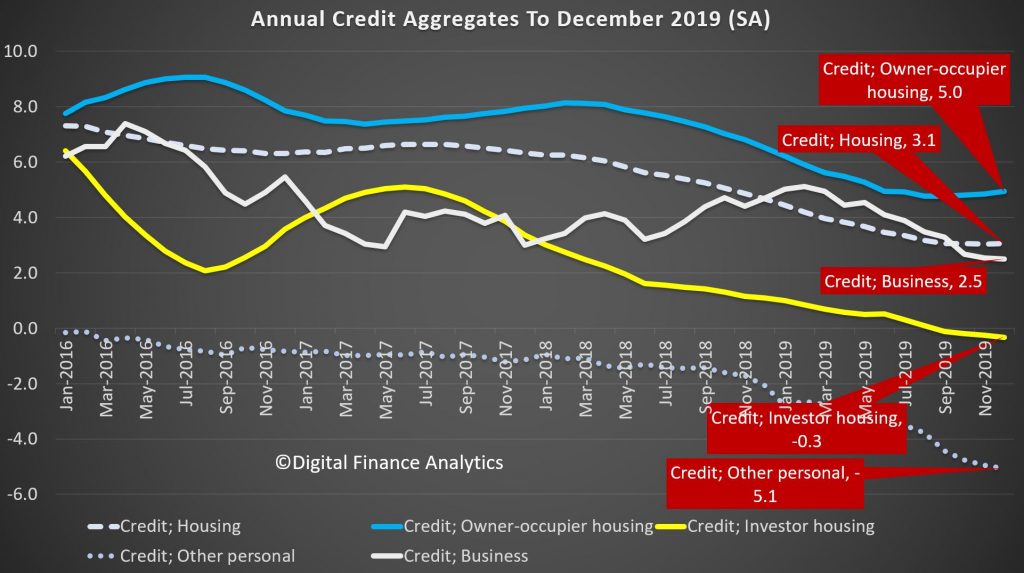
Australian banks have been dialing back their wealth management businesses in response to the Royal Commission, fees for no service issues and the confusion about advice models. The focus has been towards the simplification of their businesses with a focus on mortgage lending, despite this being at a time when lending growth, according to the RBA is at historic lows, and low cash rates are crushing margins, and competition destroying fee income. Housing credit to December was at a low 3.1%.
Elsewhere, especially in the US, the large investment banks are pivoting away from trading markets and lending TOWARDS wealth management. Bloomberg for example reported that Morgan Stanley has agreed to buy discount brokerage E*Trade Financial Corp. for $13 billion, pushing further into the retail market in the biggest acquisition by a Wall Street firm since the financial crisis.
The all-stock takeover adds E*Trade’s $360 billion of client assets to Morgan Stanley’s $2.7 trillion, the companies said Thursday in a statement. Morgan Stanley also gets E*Trade’s direct-to-consumer and digital capabilities to complement its full-service, advisory-focused brokerage.
“Our clients increasingly want digital access and digital banking, and their clients want wealth-management advice,” Chief Executive Officer James Gorman said in an interview. “It’s the continuing evolution of Morgan Stanley into a stable, well-diversified business.”
In reshaping the firm since the financial crisis, Gorman has been emphasizing Morgan Stanley’s wealth-management powerhouse. Purchasing E*Trade helps him add clients who are less wealthy than its traditional customers. The New York-based company has lost some business to the retail brokerages in recent years as those firms invested heavily in their web platforms.
“Wall Street banks continue to covet Main Street customers,” Greg McBride, an analyst at Bankrate.com, said in an email. The acquisition “gives them access to brokerage customers, employees with company stock, and the lifeblood of financial services — low-cost retail bank deposits.”
The retail-brokerage industry is being reshaped by price wars and consolidation. In early October, Charles Schwab Corp. eliminated commissions for U.S. stock trading, spurring other brokerages to follow suit and sweeping away an important revenue stream.
The following month, Schwab agreed to buy rival TD Ameritrade Holding Corp. for about $26 billion and create a mega-firm with $5 trillion in assets, forcing smaller brokerages like E*Trade to contend with a much more formidable competitor.
For Morgan Stanley, the deal “deepens the ‘safe’ wealth-management franchise — rich in fees and stability,” credit analyst David Havens at Imperial Capital wrote in a note to clients. “It reduces reliance on the more mercurial trading and markets businesses.”
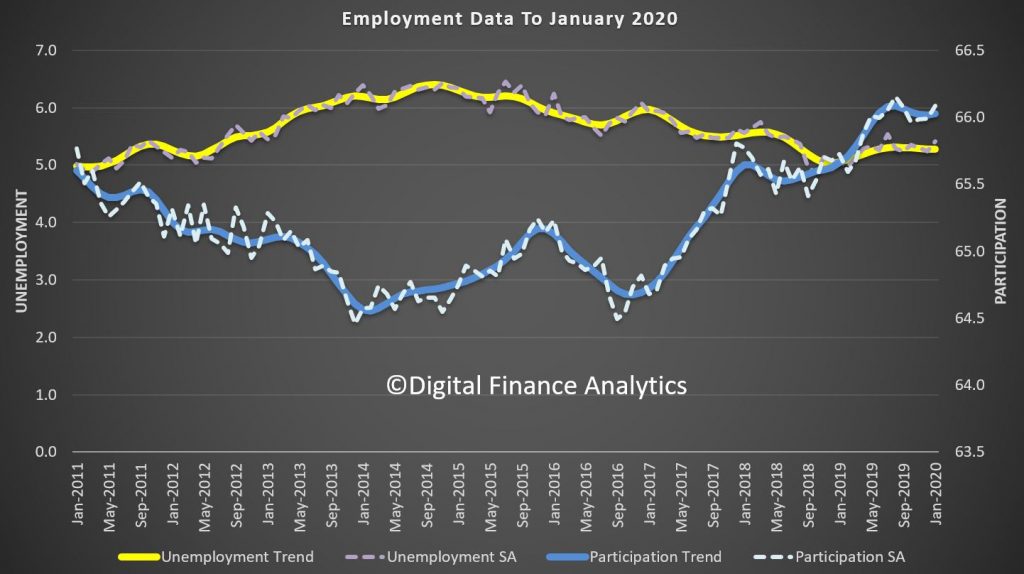
Interesting test today, as according to the latest ABS figures on unemployment trend stayed at 5.2%, but seasonally adjusted rose 0.2% to 5.3%. Who will report what (many were keen to highlight the recent falls in SA terms, will the reverse be true too?). We continue to prefer the more reliable trend series. Note too the incoming rotation group had a higher unemployment rate than the group it replaced. So, how much is real and how much noise? Still whatever, on these numbers you can forget wages growth. And this is before the China freeze really hit!
Employment and hours
In January 2020, trend monthly employment increased by around 20,000
people. Full-time employment increased by around 15,000 and part-time
employment increased by around 5,000 people.
Over the past year, trend employment increased by around 257,000 people
(2.0 per cent), in line with the average annual growth over the past 20
years (2.0 per cent).
Year on Year Employment Change Over 20 Years (%)
Full-time employment growth (1.7 per cent) was above the average annual growth over the past 20 years (1.6 per cent) and part-time employment growth (2.8 per cent) was below the average annual growth over the past 20 years (3.0 per cent).
The trend monthly hours worked increased by less than 0.1 per cent in January 2020 and by 1.3 per cent over the past year. This was lower than the 20 year average annual growth of 1.6 per cent.
Underemployment and underutilisation
The trend monthly underemployment rate remained steady at 8.5 per cent in January 2020, and increased by 0.2 percentage points over the past year.
“The underemployment rate continues to remain high, but is still below the levels from 2016-17,” said Mr Hockman.
The trend monthly underutilisation rate also remained steady at 13.7 per cent in January 2020, an increase of 0.4 percentage points over the past year.
States and territories trend unemployment rate
The monthly trend unemployment rate increased in Victoria and decreased in South Australia and Tasmania in January 2020. The unemployment rate remained steady in all other states and territories.
Over the year, unemployment rates fell in Western Australia, Tasmania and the Australian Capital Territory. Unemployment rates increased in New South Wales, Victoria, Queensland, and the Northern Territory. Seasonally adjusted data
The seasonally adjusted unemployment rate increased by 0.2 percentage points to 5.3 per cent in January 2020, while the underemployment rate increased 0.3 percentage points to 8.6 per cent. The seasonally adjusted participation rate increased by 0.1 percentage points to 66.1 per cent, and the number of people employed increased by around 14,000.
The net movement of employed in both trend and seasonally adjusted terms is generally underpinned by over 300,000 people leaving employment and around 300,000 people entering employment in the month.
In original terms, the incoming rotation group in January 2020 had a lower employment to population ratio than the group it replaced (62.0% in January 2020, compared to 64.2% in December 2019), and was higher than the sample as a whole (61.8%). The incoming rotation group had a lower full-time employment to population ratio than the group it replaced (43.2% in January 2020, compared to 44.5% in December 2019), and was higher than the sample as a whole (42.7%).
The incoming rotation group had a higher unemployment rate than the group it replaced (5.8% in January 2020, compared to 4.0% in December 2019), and was higher than the sample as a whole (5.7%). The incoming rotation group had a lower participation rate than the group it replaced (65.8% in January 2020, compared to 66.9% in December 2019), and was higher than the sample as a whole (65.6%).