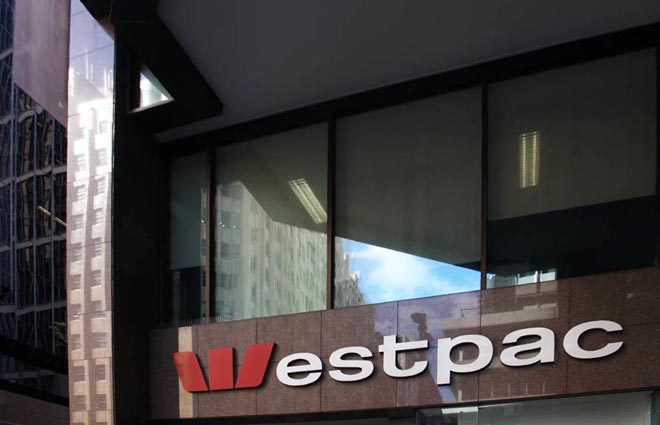
$185 million in compensation awarded to consumers in AFCA’s first 12 months

Australians in dispute with their bank, insurance provider, super fund, or other financial firms have lodged 73,000 complaints with the financial sector’s new ombudsman and have been awarded $185 million in compensation, in the first 12 months of its operation.

The Australian Financial Complaints Authority (AFCA) is celebrating 12 months since it opened its doors as the nation’s one-stop-shop for complaints about financial firms, replacing three former external dispute resolution schemes.

People made 73,272 complaints to AFCA between 1 November 2018 and 31 October 2019. This represents a 40 percent increase in complaints received compared to AFCA’s predecessor schemes, which in the 2017/18 financial year received a combined total of 52,232 complaints.

Of the complaints made, 56,420 have been resolved with the majority resolved in 60 days or less.

Research conducted in July this year showed that just three percent of Australians knew about AFCA. Yet, despite the need to raise awareness, Australians are making nearly 200 complaints a day.

AFCA Chief Executive Officer and Chief Ombudsman David Locke said AFCA was a fair, free and independent service that was fast becoming valued by the public and its members for its approach to dispute resolution.

“Every day we continue to hear from people who are dissatisfied with the way their financial firm has handled their complaint. These matters have not been resolved internally by financial firms and so the individual then brings their complaint to AFCA,” Mr Locke said.

“We take our commitment to fairness and independence very seriously, and where possible we encourage the financial firm and complainant to resolve the matter among themselves. The statistics show that this happened with 70 percent of all claims resolved in the past 12 months.

“Still, the increase in complaint numbers we are witnessing at AFCA indicates that there is still work to be done by firms to improve their practices and restore public faith in financial firms. AFCA will continue to focus on member engagement to help firms to enhance their own internal dispute resolution procedures.”

Mr Locke said he was proud of the significant milestones that AFCA and its people had achieved in its first year of operation.

“Establishing AFCA as a new organisation and handling a 40 percent increase in complaints was never going to be easy and we are still improving the way we operate,” he said.

“I am very proud of the AFCA team and what has been achieved so far. I am fortunate to work with a great team of people who are professional, passionate about fairness and independence, and who care about our customers.

“AFCA has also been in a major growth phase of staff to meet demand and has launched the first leg of a national roadshow to promote its service across the country.

“The Financial Fairness Roadshow has been a great success. So far we’ve been to 26 locations across Tasmania, Victoria, the ACT and regional New South Wales, where we’ve spoken with more than 7,000 people.

“We plan to tour the rest of the country in the first half of 2020.”

Mr Locke said AFCA had also hosted forums for small business, consumer advocates and AFCA members in 10 locations coinciding with the Roadshow’s itinerary.

Credit Impulse Dies Some More

We are getting to the rub now with the RBA releasing its Credit Aggregate data to end September 2019. This is loan stock data, reflecting the net effect of new loans coming on, old loans repaid, refinancing, and any reclassification which occurred in the month.

Over the month of September, total credit grew by 0.2%, with housing also at 0.2%, business at 0.4% and personal credit down another 0.7%. Owner occupied lending was a little firmer, but investment lending faded again.

For the year ending, total credit grew by 2.7%, the lowest since June 2011, Housing at 3.1%, the lowest at least since 1977, and business at 3.3%. Personal credit fell 4.4% over the year.

Given the strong link between home prices and housing credit, this suggests home prices will continue weaker ahead. And this, after all the recent adjustments to lending standards and rates.

The APRA data also shows some swings between lenders during the month (or reclassification, we cannot tell). NAB, ANZ and Westpac all dropped their investment loan balances, while Macquarie dropped their owner occupied loans.

Dwelling Approvals Fell Again In September

The number of dwellings approved fell 0.8 per cent in September 2019, in trend terms, and has fallen for 22 months, according to data released by the Australian Bureau of Statistics (ABS) today.

“The fall in trend dwelling approvals for September was the smallest monthly decline in six months,” said Daniel Rossi, Director of Construction Statistics at the ABS. “However, the number of dwellings approved remains 21.1 per cent lower than at the same time last year.”

Across the states and territories, dwelling approvals fell in the Northern Territory (9.3 per cent), Western Australia (2.4 per cent), Australian Capital Territory (1.8 per cent), New South Wales (1.2 per cent), Queensland (0.5 per cent) and Victoria (0.4 per cent). Tasmania (1.6 per cent) and South Australia (0.4 per cent) recorded increases, in trend terms.

In trend terms, approvals for private sector houses fell in Western Australia (2.7 per cent) and South Australia (1.3 per cent). Victoria rose 0.1 per cent, while private house approvals in New South Wales and Queensland were flat.

The seasonally adjusted estimate for total dwellings approved rose 7.6 per cent in September, driven by a 16.6 per cent increase in private dwellings excluding houses. Private sector houses rose 2.8 per cent.

The value of total building approved rose 1.4 per cent in September, in trend terms, and has risen for nine months. The value of residential building rose 0.5 per cent, while non-residential building rose 2.5 per cent.

Fed Cuts Again

As expected, the Fed cut rates again following their latest meeting. Its worth noting a slight change of tone, which some suggest this may be the last for some time. Worth reflecting though, if we are not in an economic crisis, just why are rates so low, and what firepower remains if one emerges? Their worry centres on trade and business investment. The “Non-QE” QE continues in parallel. The Dow was higher.

Information received since the Federal Open Market Committee met in September indicates that the labor market remains strong and that economic activity has been rising at a moderate rate. Job gains have been solid, on average, in recent months, and the unemployment rate has remained low. Although household spending has been rising at a strong pace, business fixed investment and exports remain weak. On a 12-month basis, overall inflation and inflation for items other than food and energy are running below 2 percent. Market-based measures of inflation compensation remain low; survey-based measures of longer-term inflation expectations are little changed.

Consistent with its statutory mandate, the Committee seeks to foster maximum employment and price stability. In light of the implications of global developments for the economic outlook as well as muted inflation pressures, the Committee decided to lower the target range for the federal funds rate to 1-1/2 to 1-3/4 percent. This action supports the Committee’s view that sustained expansion of economic activity, strong labor market conditions, and inflation near the Committee’s symmetric 2 percent objective are the most likely outcomes, but uncertainties about this outlook remain. The Committee will continue to monitor the implications of incoming information for the economic outlook as it assesses the appropriate path of the target range for the federal funds rate.

In determining the timing and size of future adjustments to the target range for the federal funds rate, the Committee will assess realized and expected economic conditions relative to its maximum employment objective and its symmetric 2 percent inflation objective. This assessment will take into account a wide range of information, including measures of labor market conditions, indicators of inflation pressures and inflation expectations, and readings on financial and international developments.

Voting for the monetary policy action were Jerome H. Powell, Chair; John C. Williams, Vice Chair; Michelle W. Bowman; Lael Brainard; James Bullard; Richard H. Clarida; Charles L. Evans; and Randal K. Quarles. Voting against this action were: Esther L. George and Eric S. Rosengren, who preferred at this meeting to maintain the target range at 1-3/4 percent to 2 percent

Mortgage Delinquencies Tick Higher As More Higher LVR Loans Written

Genworth, the Lenders Mortgage Insurer released their third quarter results today. Their statutory net profit after tax (NPAT) in 3Q19 was $25.1 million (3Q18: $19.6 million) and their underlying NPAT2 of $26.5 million (3Q18: $20.4 million).

Genworth said 3Q19 financial performance was “solid” with gross written premium up 24.4% from growth in our traditional lenders mortgage insurance (LMI), driven by increasing volumes in high loan to value lending by our lender customers.

The Delinquency Rate increased from 0.55% in 3Q18 to 0.60% in 3Q19. This was driven primarily by an increase in delinquency rates across most states (particularly in Western Australia, New South Wales and Queensland).

The increase also reflects the continued extended ageing of delinquencies due to slower loss management processing by lenders first called out in FY18. Encouragingly, signs of faster processing by some lenders has emerged this quarter. The Delinquency Rate remained flat between 2Q19 and 3Q19.

New Delinquencies was down slightly (3Q19: 2,622 versus 3Q18: 2,742) and in line with favourable trends usually experienced in the third quarter as new delinquencies reduced from 2,853 in 2Q19. Cures improved from 2,378 in 3Q18 to 2,439 in 3Q19 as lender customers started to emphasise remediation of aging delinquencies. However the cure rate is still lower than back in 2017.

The number of Paid Claims was up (3Q19: 361 versus 3Q18: 320) although the average paid per claim decreased from $115,700 in 3Q18 to $97,900 in 3Q19. This decrease is a result of the stabilisation of mining regions. However, the average paid per claim remains elevated as challenging market conditions remain across areas such as Perth and its specific sub-regions.

The aging also highlights the length of time it takes to get into difficulty, see the peak in loans written back in 2013-14.

Portfolio delinquency performance remained relatively steady quarter on quarter, following seasonal trends. Despite the overall stability, impacts from ageing delinquencies continue, but early signs of faster loss mitigation processing by lenders are emerging.

2006 and prior book years performances were affected by higher proportion of low doc lending which reduced significantly in 2009 following policy changes and decommissioning of the low docs product in the latter part of 2009.

Historical performance of 2008 09 book year was affected by the economic downturn experienced across Australia and heightened stress experienced among self employed borrowers, particularly in Queensland, which has been exacerbated by recent natural disasters.

2010 12 book year delinquencies at lower levels driven by stronger credit policies

Deterioration in 2013 14 book years reflect downturn in mining regions resulting in ongoing economic and housing market challenges.

But the most obvious issue ahead is the rising levels of delinquency in NSW. This will be one to watch in coming quarters, alongside a potential rise in the proportion of high loan to value loans being written now (thanks to the APRA loosening).

CPI Continues Below RBA Target

The Consumer Price Index (CPI) rose 0.5 per cent in the September 2019 quarter, according to the latest Australian Bureau of Statistics (ABS) figures. This follows a rise of 0.6 per cent in the June 2019 quarter.

All groups CPI seasonally adjusted rose 0.3%.

The trimmed mean rose 0.4%, following a rise of 0.4% in the June 2019 quarter. Over the twelve months to the September 2019 quarter, the trimmed mean rose 1.6%, following a rise of 1.6% over the twelve months to the June 2019 quarter.

The weighted median rose 0.3%, following a rise of 0.4% in the June 2019 quarter. Over the twelve months, the weighted median rose 1.2%, following a rise of 1.3% over the twelve months to the June 2019 quarter.

This is well below the RBA target.

The most significant price rises in the September 2019 quarter were international holiday, travel and accommodation (+6.1 per cent), tobacco (+3.4 per cent), property rates and charges (+2.5 per cent) and child care (+2.5 per cent).

The most significant price falls this quarter were automotive fuel (-2.0 per cent), fruit (-3.1 per cent) and vegetables (-2.5 per cent).

ABS Chief Economist, Bruce Hockman said: “Despite the price falls for fruit and vegetables this quarter, the drought is impacting on the prices for a range of food products. Prices rose this quarter for meat and seafood (+1.7 per cent), dairy and related products (+2.2 per cent) and bread and cereal products (+1.3 per cent).”

The CPI rose 1.7 per cent through the year to the September 2019 quarter. This follows a through the year rise of 1.6 per cent to the June 2019 quarter.

“Annual inflation remains subdued partly due to price rises for housing related expenses remaining low, and in some cases falling in annual terms. Prices for utilities (-0.3 per cent) and new dwelling purchase by owner-occupiers (-0.1 per cent) both fell slightly through the year to the September 2019 quarter, while rents (0.4 per cent) recorded only a small rise,” said Mr Hockman.

Main contributors by city:

Sydney (+0.5%)

  • International holiday, travel and accommodation (+6.9%)
  • Tobacco (+3.4%)
  • Wine (+2.6%).

The rise was partially offset by:

  • Automotive fuel (-2.2%)
  • New dwelling purchase by owner-occupiers (-0.6%). The fall in new dwelling purchase by owner-occupiers is mainly driven by base price reductions due to weak market conditions.
  • Sports participation (-3.5%) due to the introduction of a second $100 Active Kids sports voucher for school aged children in New South Wales.

Melbourne (+0.5%)

  • International holiday, travel and accommodation (+5.5%)
  • Tobacco (+3.5%)
  • Gas and other household fuels (+3.5%) due to the seasonal switch to peak winter gas prices.

The rise was partially offset by:

  • Electricity (-4.1%) due to the introduction of the Victorian Default Offer from 1 July 2019.
  • Motor vehicles (-2.0%)
  • Automotive fuel (-1.8%).

Brisbane (+0.6%)

  • International holiday, travel and accommodation (+4.7%)
  • Tobacco (+3.2%)
  • Electricity (+2.6%) driven by the $50 asset ownership dividend that was applied to consumers’ electricity bills last quarter.

The rise was partially offset by:

  • Automotive fuel (-2.6%)
  • Fruit (-2.7%).

Adelaide (+0.7%)

  • International holiday, travel and accommodation (+6.3%)
  • Tobacco (+3.4%)
  • Wine (+3.5%).

The rise was partially offset by:

  • Domestic holiday, travel and accommodation (-2.4%)
  • Insurance (-3.5%) due to the Compulsory Third Party insurance market being opened to competition on 1 July.
  • New dwelling purchase by owner-occupiers (-0.7%).

Perth (+0.5%)

  • International holiday, travel and accommodation (+6.8%)
  • Tobacco (+3.5%)
  • Electricity (+1.7%).

The rise was partially offset by:

  • Automotive fuel (-2.6%)
  • Fruit (-6.5%).

Hobart (+0.5%)

  • New dwelling purchase by owner-occupiers (+2.3%) due to a strong housing market.
  • International holiday, travel and accommodation (+6.2%)
  • Tobacco (+2.6%).
  • Hobart is the only capital city to record a rise in automotive fuel this quarter (+0.5%).

The rise was partially offset by:

  • Domestic holiday, travel and accommodation (-7.0%)
  • Vegetables (-2.5%).

Darwin (+0.3%)

  • Domestic holiday, travel and accommodation (+4.4%) due to increased demand during the peak tourist season this quarter.
  • Tobacco (+3.1%)
  • International holiday travel and accommodation (+4.6%).

The rise was partially offset by:

  • Rents (-1.8%); due to continued high vacancy rates
  • Other financial services (-3.2%) due to the introduction of the Territory home owner discount (THOD), which offers a discount on stamp duty when purchasing a dwelling for owner-occupier purposes from May 2019.
  • Sports participation (-9.0%) due to the biannual $100 sports voucher provided to school aged children in the Northern Territory.

Canberra (+0.7%)

  • International holiday, travel and accommodation (+6.5%)
  • Property rates and charges (+7.9%) due to reductions in stamp duty for property purchases being replaced by increases in general rates.
  • Domestic holiday, travel and accommodation (+3.2%).

The rise was partially offset by:

  • Other financial services (-7.6%) due to the introduction of the home buyer concession scheme.
  • Games, toys and hobbies (-3.6%)
  • Fruits (-3.1%).

Fitch Affirms Australia at ‘AAA’; Outlook Stable

Fitch says Australia’s ‘AAA’ rating is underpinned by an effective and flexible policy framework that has, in combination with strong net migration, supported 28 consecutive years of positive GDP growth in the face of substantial external, financial, and commodity-price shocks. A credible commitment to fiscal consolidation from a debt level that is already broadly in line with the ‘AAA’ median also supports the rating.

The federal government’s fiscal position continued to strengthen over the past year, bolstered by a cyclical upswing in revenue, largely from higher iron ore prices, and sustained spending restraint as part of the government’s consolidation efforts. On a Government Finance Statistics basis, Fitch estimates a federal government surplus in the fiscal year ending-June 2019 (FY19) of 0.1% of GDP; the first surplus since FY08. We forecast the federal surplus to trend slightly upward, reaching 0.3% by FY21. Fitch forecasts the general government deficit to decline to 0.5% of GDP by FY21, from 1.0% in FY19.

The government appears committed to continued fiscal consolidation, focusing on reaching an underlying cash surplus in FY20 (from a balance in FY19) and over the medium-term. Strong revenue growth allowed the government to pass additional personal income tax cuts in July, while remaining on track to achieve its fiscal targets. However, the fiscal trajectory remains sensitive to commodity-price developments. Iron ore prices have receded sharply from their mid-2019 highs, but remain above the assumptions incorporated into Fitch’s April 2019 budget outlook.

We estimate that general government gross debt remained stable at 41.0% of GDP in FY19, just below the ‘AAA’ median of 44%, and expect the debt ratio to fall gradually on improved fiscal performance.

Fitch forecasts GDP growth to slow sharply to 1.7% in 2019, from 2.7% in 2018, due to domestic factors triggered by a protracted housing-market downturn. We expect economic growth to rise to 2.3% in 2020, as the housing market stabilises and consumption is supported by recent monetary policy-rate cuts, tax cuts, and public-infrastructure spending. Risks are tilted to the downside given US-China trade frictions and slowing growth in China, as China is the destination of roughly 30% of goods exports.

The Reserve Bank of Australia (RBA) has cut its policy rate by a cumulative 75bp since June to a historic low of 0.75%, a considerable change in the interest-rate environment. Fitch now expects the RBA to remain on hold through 2021 to support economic growth and employment, and does not anticipate the use of quantitative easing. Inflation fell in 1H19 to 1.4% and Fitch forecasts it to remain below the RBA’s 2%-3% target band until 2021. The unemployment rate has edged up to 5.2% since April, but employment growth remains resilient and the participation rate has increased to historic highs.

Policy rate cuts and a relaxation of macroprudential policies have helped stabilise house prices after an 8.4% fall in the national house price index between the October 2017 peak and June 2019. Fitch expects an acceleration in house price growth in 2020, although housing turnover is still subdued and mortgage credit growth remains low, in part due to the tightening of underwriting standards. However, housing-loan approvals have increased in recent months and sustained low interest rates, along with continued strong net migration, will put upward pressure on house prices and household debt over the medium-term.

Household debt, at 191.1% of disposable income in 2Q19, is among the highest of ‘AAA’ rated sovereigns and poses an economic and financial stability risk in the event of a shock. Under current conditions, households appear well positioned to service their debts, with non-performing loans at just under 1% of total loans. However, a labour market or interest rate shock could impair households’ ability to service their debts. Mitigating these risks is that some households have prepaid their mortgages or maintain mortgage offset accounts that can be used to service debt in the event of a shock, though newer borrowers and financially weaker households could be vulnerable.

Australia’s banking system, which scores ‘aa’ on Fitch’s Banking System Indicator, is well positioned to manage potential shocks. Sound prudential regulation and ongoing strengthening of underwriting standards have improved the resilience of bank balance sheets and limited their exposure to riskier mortgage products.

Improved terms of trade caused by high commodity prices led to Australia’s first current-account surplus since 1975 in 2Q19. We forecast the surplus to be short-lived, as iron ore prices have declined from their mid-year highs, and expect the current account for the full year to be roughly in balance, against a deficit of 2.1% of GDP last year. Fitch forecasts the current-account deficit to widen to 1.5% of GDP by 2021, below its 4.1% average since 1990.

Net external debt remains among the highest within the ‘AAA’ category and we project it to reach 56.4% of GDP in 2019. Heavy reliance on external funding leaves Australia exposed to shifts in capital flows. Most external liabilities are denominated in local currency or are hedged to reduce currency and maturity mismatches. This helps to mitigate risks.