The Australian Securities and Investments Commission (ASIC) and
Australian Prudential Regulation Authority (APRA) have committed to
strengthen engagement, deepen cooperation and improve information
sharing.
The agencies today published an updated Memorandum of Understanding (MoU).
The updated MoU follows on from the recommendations of the Royal
Commission into Misconduct in the Banking, Superannuation and Financial
Services Industry[1]. APRA and ASIC are also working closely with Government on the legislative changes required to implement these recommendations.
ASIC Chair James Shipton said the updated MoU builds on the open and
collaborative relationship across all levels of the agencies.
‘ASIC and APRA will continue to proactively engage and respond to
issues efficiently to deliver positive outcomes for consumers and
investors.
‘The MoU facilitates more timely supervision, investigations and
enforcement action and deeper cooperation on policy matters and internal
capabilities.’
APRA Chair Wayne Byres said enhanced cooperation reinforced the twin
peaks model of regulation that has operated in Australia for more than
20 years.
‘ASIC and APRA share an interest in protecting the financial
wellbeing of the Australian community and achieving a fair, sound and
resilient financial system,’ Mr Byres said.
‘Strengthening engagement is a key priority of the ASIC Commissioners
and APRA Members. We will continue to work closely together to enhance
regulatory outcomes and achieve our respective mandates.’
This MoU, which will be reviewed on a regular basis, is only one
aspect of how ASIC and APRA are establishing closer cooperation. Led by
ASIC Commissioners and APRA Members, the agencies are regularly meeting
under a revised engagement structure and working together on areas of
common interest, including data, thematic reviews, governance and
accountability. Both agencies are committed to detecting prudential and
conduct issues early and working to revolve them efficiently and
effectively.
The updated MoU is available on the ASIC website here.
The final best interests duty bill for mortgage brokers has been tabled in Parliament, outlining the role brokers need to take when helping a borrower from 1 July 2020. From The Adviser.
The amended Financial Sector Reform (Hayne Royal Commission Response—Protecting Consumers (2019 Measures)) Bill 2019 has been tabled in Parliament today (28 November).
The key features of the new law are:
mortgage brokers must act in the best interests of consumers in relation to credit assistance in relation to credit contracts;
where
there is a conflict of interest, mortgage brokers must give priority to
consumers in providing credit assistance in relation to credit
contracts;
mortgage brokers and mortgage intermediaries must not accept conflicted remuneration;
employers,
credit providers and mortgage intermediaries must not give conflicted
remuneration to mortgage brokers or mortgage intermediaries; and
the circumstances in which these bans on conflicted remuneration apply are to be set out in the regulations.
Notably,
the duty to act in the best interests of the consumer in relation to
credit assistance is a principle-based standard of conduct that applies
across a range of activities that licensees and representatives engage
in.
As such, what conduct satisfies the duty will depend on the
individual circumstances in which credit assistance is provided to a
consumer in relation to a credit contract.
The duty does not
prescribe conduct that will be taken to satisfy the duty in specific
circumstances. Instead, it is the responsibility of mortgage brokers to
ensure that their conduct meets the standard of “acting in the best
interests of consumers” in the relevant circumstances.
However, the new duty will mean that there could be circumstances
where the mortgage broker may not have acted in a consumer’s best
interests even if the responsible lending obligations were complied
with. For example, even if a home loan product is ‘not unsuitable’,
recommending it to the consumer might not be in the consumer’s “best
interests”, the accompanying documentation reads.
The penalty for breaking this duty for both credit representatives and licensees is 5,000 penalty units.
Examples of the duty in action – white label called in question
In the explanatory materials, there are examples of steps that may need to be taken for this new duty. These include:
prior to recommending any home loan product or other credit contract to a consumer based on consideration of that consumer’s particular circumstances, the mortgage broker may need to consider a range of products (including the features of those products), form a view about which products are in the consumer’s best interests and then inform the consumer of the range and the options it contains;
any recommendations made would be expected to be based on consumer benefits, rather than benefits that may be realised by the broker; that is, a broker should not recommend a loan by prioritising factors that cannot be substantiated as delivering benefits to that particular consumer (such as the broker’s relationship with the lender), over factors and features which affect the cost of the product or are more relevant to the consumer;
in cases where critical information is not obtained when inquiring about a consumer’s circumstances, the broker could be expected to refrain from making a recommendation about a loan where there is a consequent risk that the loan will not be in the consumer’s best interests.
Interestingly, the new duty also
outlines that “a broker would not suggest, from their aggregator’s
panel of lenders, a white label home loan that has the same features as a
branded product from the same lender, but with a higher interest rate,
because it would not be in the best interests of the consumer to pay
more for an otherwise similar product”.
The explanatory materials go on to outline that during a periodic review, a broker “would not suggest that the consumer remain in a credit contract without considering whether this would be in the consumer’s best interests”.
“For
example, it may be a breach of the duty if the broker suggested the
consumer remain in their current home loan when they could refinance to a
cheaper product as the broker did not want to incur the consequent
liability to the lender when their commission payments were clawed
back,” it reads.
Helping consumers understand their decision implications
The
materials also outline that there may be situations where the
consumer does not properly understand the implications of different
choices and so the broker may have to assist them to understand why a
particular loan is or is not in their best interests, which could inform
the brokers’ actions.
An example given is if a consumer asks the
broker if they should take out an interest-only home loan on a property
they are looking to buy. The home loan will have a higher interest rate
than a principal and interest home loan. The broker helps the consumer
to understand the difference in cost of the two home loans, and other
differences in the way in which they operate, including that the
consumer will only build equity if the property’s value increases or
they make additional repayments, and the implications of moving to
higher repayments at the end of the interest-only period.
Another
example is if a consumer asks the broker if they should take out a home
loan with an offset account as they have heard this can save them money,
even though the interest rate is slightly higher. The broker helps the
consumer to understand what is in their best interests, based on the
difference between the higher interest rate and the savings that
consumer could reasonably expect through utilisation of the offset
account.
Comments from Frydenberg
At the second reading this afternoon (28 November), Treasurer Josh Frydenberg said: “[T]he
bill introduces a best interests duty for mortgage brokers that will
ensure that consumers’ interests are prioritised when a mortgage broker
provides credit assistance, as regulated by the National Consumer Credit
Protection Act 2009. In practice this will mean that, in accordance
with Commissioner Hayne’s recommendations, a duty will apply in relation
to the provision of consumer credit assistance and not business
lending.
“The
government is also reforming mortgage broker remuneration, and the bill
provides for a regulation making power to this end. The regulations will
require the value of upfront commissions to be linked to the amount
drawn down by borrowers instead of the loan amount; ban campaign and
volume based commissions and payments; and cap soft dollar benefits.
“Further,
the period over which commissions can be clawed back from aggregators
and mortgage brokers will be limited to two years, and passing on this
cost to consumers will be prohibited.
“After
careful consideration, the government decided to delay consideration of
aspects of Commissioner Hayne’s recommendations for mortgage
brokers—namely moving to a borrower-pays remuneration structure. We will
be doing a review with the Council of Financial Regulators and the
Australian Competition and Consumer Commission (ACCC). That will be
carried out in three years time.
“Implementation
of these reforms, as recommended by the royal commission, is a critical
component of restoring trust and confidence in Australia’s financial
system and is part of the Morrison government’s plan for a stronger
economy.”
The government will also introduce the Financial
Sector Reform (Hayne Royal Commission Response – Stronger Regulators
(2019 Measures)) Bill 2019. The Bill implements a further four
additional commitments the Government announced at the time of
responding to the Royal Commission and will ensure that ASIC can
effectively enforce existing laws.
“The government is taking
action on all 76 recommendations contained in the Final Report of the
Royal Commission and, in a number of important areas, is going further.
Restoring trust in Australia’s financial system is part of our plan for a
stronger economy,” Mr Frydenberg said.
Broadcast on Thursday 28th November 2019, Nucleus Wealth’s Head of Investment Damien Klassen, Head of Operations Tim Fuller, and founder of Digital Finance Analytics, Martin North discuss “Australia’s Housing Market Dilemma.”
According to an article in InvestorDaily, RBA Governor Philip Lowe has poured water on the prospects of quantitative easing (QE), saying Australia “shouldn’t forget about fiscal policy” to prevent a recession.
“QE is not on the agenda at this time,” Governor Lowe told at the annual dinner of the Australian Business Economists.
Interest
rates will have to hit 0.25 per cent before the RBA considers QE –
something that economists are predicting by mid-2020. But Governor Lowe
doesn’t think QE will be necessary, saying that the Australian economy
is in a good position and that the RBA will achieve its goals.
“At
the moment, though, we are expecting progress towards our goals over
the next couple of years and the cash rate is still above the level at
which we would consider buying government securities.”
However,
Governor Lowe hinted again that he would prefer the use of fiscal policy
rather than monetary policy to ward off a recession, citing a report
from the Committee on the Global Financial System (CGFS), which he
recently chaired.
“The
report also notes that there may be better solutions than monetary
policy to solving the problems of the day,” Governor Lowe said.
“It
reminds us that when there are problems on the supply-side of the
economy, the use of structural and fiscal policies will sometimes be the
better approach. We need to remember that monetary policy cannot drive
longer term growth, but that there are other arms of public policy than
can sustainably promote both investment and growth.”
Governor Lowe
also said that the willingness of central banks to provide liquidity
could reduce the incentive for financial institutions to hold their own
adequate buffers and create an “inaction bias” from prudential
regulators or fiscal authorities.
“If this were the case, it could lead to an over-reliance on monetary policy,” he said.
The
sentiments about quantitative easing have been echoed by fund managers.
Sarah Shaw, chief investment officer at 4D infrastructure and Chris
Bedingfield, principal at Quay Global Investors have urged the
government to instead allocate investment in infrastructure to create
jobs and boost productivity.
Ms Shaw noted the need to replace
roads, bridges and other structures with better planned
“forward-thinking” infrastructure is high.
“If you think about the
need for infrastructure spend that I’m talking about, if you put a
number on it, it’s maxed at $4 trillion by 2040 of infrastructure
capacity that’s needed,” she said.
“If you think about that and
you’re in an interest rate environment as low as it is today, if you’re
not borrowing to invest in a much-needed infrastructure, then there’s
something wrong.”
She added she looks for companies that are
locking in fixed term bet to invest for future cash flows, because “now
is the time to do it” with the current low cash rate.
“Why shouldn’t countries be doing that?” Ms Shaw queried.
“I’ll
give you an example: China during the GFC, biggest form of quantitative
easing – 35,000 kilometres of high-speed rail. That’s the sort of
quantitative easing that we should be looking at here in Australia.”
VanEck has predicted there will be more rate cuts in 2020.
As discussed with John Adams in our recent post, we did not come away with the same conclusion, and Westpac, for example is forecasting QE will hit during 2020.
Last night, in a much anticipated speech broadcast live on the Reserve Bank’s website, Governor Phil Lowe laid out in very clear terms the circumstances in which the bank would resort to quantitative easing and the way in which it would implement it. Via The Conversation.
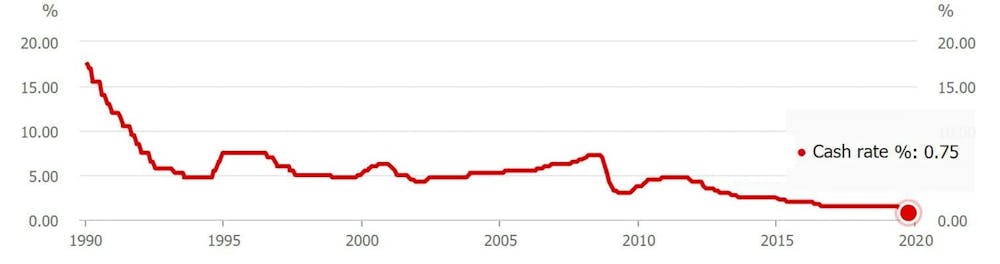
Quantitative easing is simply a change in the way it eases monetary policy when the official interest rate approaches zero.
Usually it does it by cutting the so-called cash rate, which is the rate banks pay each other for money deposited overnight.
Eight years ago the cash rate was 4.5%. Three years ago it was 1.5%.
After the most recent three cuts in June, July and October, it is just
0.75%
Last night, Governor Lowe said the effective lower bound was 0.25%.
Rather than let the cash rate get any lower or negative (an option he
explicitly ruled out), the bank will push down other longer-term rates
by buying government bonds.
It’s the “quantitative easing” approach adopted by the US Federal Reserve between 2009 and 2014.
Government bonds are sold by governments in return for money, a means
of borrowing. The buyer gets guaranteed interest payments and a
guarantee that their money will be returned in full after three, five,
ten or even 20 years depending on the length of the bond.
Once issued, bonds can be traded on a market, and the price at which
they change hands can be expressed as an implied interest rate, which
becomes the risk-free rate against which all other interest rates are
benchmarked.
How quantitative easing would work
Buying bonds from investors would push down that risk-free rate, pushing down the entire structure of long-term interest rates.
All other things being equal, this should also push down the exchange
rate by reducing the return on Australian dollar denominated financial
investments.
Governor Lowe indicated he might buy state government bonds as well as Commonwealth bonds.
Importantly, he argued that although the bank would be mindful of the
need to ensure private banks had enough access to the bonds they needed
to hold for regulatory purposes, those holdings would not be an
impediment to quantitative easing.
He ruled out buying residential mortgage-backed securities and other
private assets given that those markets are currently functioning well
and Reserve Bank purchases could distort them.
The approach borrows heavily from the US Fed.
As in the US, Lowe says quantitative easing would be complemented by
“forward guidance,” where the Reserve Bank would signal early how
long-term interest rates would be kept low and the circumstances in
which it expected to raise them again.
The guidance is designed to influence market expectations for future
interest rates, enhancing the effectiveness of cuts in long term
interest rates.
When it would happen
In addition to “how,” Governor Lowe spelled out “when” – the economic
circumstances in which the bank would resort to quantitative easing.
It would do it when the cash rate was at 0.25% and inflation and unemployment were moving away from its objectives.
The bank targets 2-3% inflation on average over time and has recently
identified 4.5% as the “full employment” unemployment rate.
Importantly, Lowe emphasised that the Australian economy has not yet
reached the point where a cash rate as low as 0.25% would be needed and
argued quantitative easing was unlikely to be needed in future.
The cash rate is at present 0.75%. Setting 0.25% as the effective
lower bound gives the Governor 0.5 percentage points left to cut before
implementing quantitative easing.
Implicitly, Governor Lowe is saying that those cuts of 0.5 percentage points will be enough to stabilise the economy.
A pause for a breath at 0.25%
Lowe also indicated the bank would not seamlessly transition to quantitative easing.
He implied there was an additional hurdle or threshold that would
need to be crossed, suggesting he would be reluctant to make the
transition.
His big problem is that neither inflation nor the unemployment rate are moving in the right direction.
The bank has undershot its inflation target since the end of 2014,
giving the economy a weak starting point going into an emerging global
downturn.
My research
on the US experience for the United States Studies Centre shows that
the main problem with is quantitative easing was that it was not done
soon enough or aggressively enough.
It might be better to be bold
While quantitative easing was effective, it could have been made more so had what was going to happen been made clearer.
The Fed went out of its way to limit the transmission of quantitative
easing to the rest of the economy, fearful it would be too potent and
lead to excessive inflation.
Those concerns proved misplaced. By pulling its punches, the Fed
ended up being less effective and having to pursue quantitative easing
for longer than if it had used it more aggressively.
Governor Lowe’s very obvious reluctance to go down the quantitative easing route suggests the Reserve Bank is in danger of making the same mistake, but it is not too late to learn from what happened in the US.
Author: Stephen Kirchner Program Director, Trade and Investment, United States Studies Centre, University of Sydney
The ABS released their preliminary data today. Tasmania apart, construction chain measures continue to fall. Trend estimate for residential building work done fell 3.0% this quarter and has fallen for four quarters.
The trend estimate for total construction work done fell 1.6% in the September quarter 2019.
The seasonally adjusted estimate for total construction work done fell 0.4% to $50,849.7m in the September quarter.
The trend estimate for total building work done fell 1.8% in the September quarter 2019.
The trend estimate for non-residential building work done rose 0.2% and residential building work fell 3.0%.
The seasonally adjusted estimate of total building work done fell 0.5% to $29,703.6m in the September quarter.
The trend estimate for engineering work done fell 1.1% in the September quarter.
The seasonally adjusted estimate for engineering work done fell 0.2% to $21,146.2m in the September quarter.
Trend percentage change: Total construction
The trend estimate for total construction work done fell 1.6% this quarter and has fallen for five quarters.
Trend percentage change: Engineering
The trend estimate for engineering construction work done fell 1.1% this quarter and has fallen for six quarters.
Trend percentage change: Building
The trend estimate for total building work done fell 1.8% this quarter and has fallen for four quarters.
Trend percentage change: Residential
The trend estimate for residential building work done fell 3.0% this quarter and has fallen for four quarters.
Trend percentage change: Non-residential
The trend estimate for non-residential building work done rose 0.2% this quarter and has risen for five quarters.
Chain volume measures – Trend estimates
New South Wales Victoria
Construction work done in New South Wales has fallen for four quarters.
Construction work done in Victoria has fallen for four quarters.
Queensland
Western Australia
Construction work done in Queensland has fallen for six quarters.
Construction work done in Western Australia has fallen for eight quarters.
South Australia
Northern Territory
Construction work done in South Australia has fallen for five quarters.
Construction work done in the Northern Territory has fallen for eight quarters.
Tasmania
Australia Capital Territory
Construction work done in Tasmania has risen for seven quarters.
Construction work done in the Australian Capital Territory has fallen for four quarters.
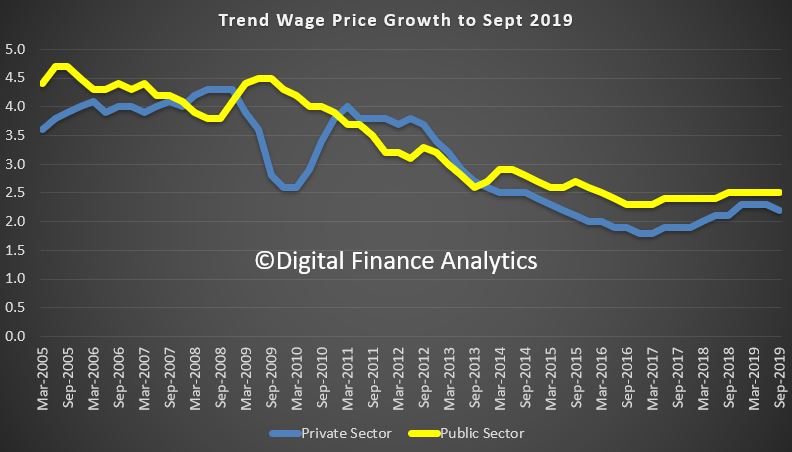
In the RBA’s Governor’s speech last night there was a reference to lower wages growth for longer, referring back to an earlier outing by Guy Debelle, Deputy Governor.
Debelle’s speech at Australian Council of Social Service (ACOSS) National Conference revealed at least to me that the RBA has no real idea as to why wages growth is so slow. They appear to have all but accepted it will be so. ” This increase in labour supply has meant that the strong employment outcomes in recent years has not generated the pick-up in wages growth that might otherwise have occurred. At the same time, I have highlighted the increased prevalence of wages growth in the 2s across the economy”.
We think the structural changes to the labour market (gig jobs, part-time work, multiple-jobs, etc) plus technological changes and globalisation all have a role to play. And the migration factors and temporary working visas are also playing into the mix. Finally, the balance between employee and employer seems to have shifted. Public sector wages are a little stronger.
He said: Over much of the past three years, employment has grown at a healthy annual pace of 2½ per cent. This has been faster than we had expected, particularly so, given economic growth was slower than we had expected. Employment growth has also been faster than the working-age population has been growing. As a result, the share of the Australian population employed is around its all-time high, which is a good outcome. Normally, we would have expected this strong employment growth to lead to a decline in the unemployment rate. But the unemployment rate has turned out to be very close to what we had expected and has moved sideways around 5¼ per cent for some time now.
So what is going on here? Strong employment growth but little change in the unemployment rate means
that the strength in labour demand has been met by strong growth in labour supply. This increase in
labour supply has come from more people joining the labour force and from some of those with jobs
putting off leaving the labour force. These trends have been particularly pronounced for females aged
between 25 and 54 and older workers of both sexes.
The surprising strength in labour supply has been one of the factors that has contributed to wages
growth being slower than we had expected. But at the same time, the lower growth in wages has probably
contributed to the strength in employment growth. My undergraduate honours thesis at Adelaide Uni
examined the aggregate labour demand curve in Australia which was a much debated topic at the time.[1] So more
than 30 years on, I will discuss similar issues today.
I will look at the rise in participation rates of females and older workers and discuss some of the
factors that have been contributing to it. I will also look briefly at what jobs have been created. In
doing so, I will make use of the micro data in the monthly labour force survey (LFS) as well as micro
data from the HILDA survey.[2] That is, we are examining the micro data to understand the macro trends in the
labour market.
By and large, the new jobs created over the past few years have been representative of the existing
stock of jobs. There have been low wage and high wage, lower skilled and higher skilled jobs created,
but about average on both counts. The jobs growth has been in household services jobs such as health
care, social assistance and, education, as well as in business services. Two-thirds of the employment
growth over the past two years has been in full-time jobs.
Then I will look at wages growth and show that the lower average wage outcomes of the past few years
have reflected the increased prevalence of wages growth in the 2s across the economy.
Finally, I will look forward and talk about the RBA’s forecasts for the labour market. Two of the
critical influences on that forecast are how much further labour supply will increase and how entrenched
are wage outcomes.
Participation
An increase in the number of people in employment can be met either by an increase in people entering
from outside the labour market or a decline in unemployment. The increase in people coming from outside
the labour force, causing an increase in the participation rate, is known as an ‘encouraged
worker’ effect – when economic conditions improve, there is a tendency for people to enter
or defer leaving the workforce.[3] Historically more of the increase in employment has translated into a reduction
in the unemployment rate than by a rise in the participation rate.
However, the past couple of years have been unusual. The increase in employment has been met
disproportionately by an increase in the number of people participating in the labour force
(Graph 1). The share of the population participating in the labour force is at a record high. The
two main groups contributing to this rise in participation are females and older workers. I will discuss
each of these in turn and some of the forces driving the outcomes over both the recent past and from a
longer perspective. An understanding of these forces can help us assess how much further these trends
are likely to continue.
Graph 1
Female participation
Female employment growth has accounted for two-thirds of employment growth over the past year. The
female participation rate is now at its highest rate, and the gap between female and male participation
is now the narrowest it has ever been (Graph 2).
Graph 2
The female participation rate has steadily increased over recent decades (from 40 per cent in
1970 to 61 per cent in 2019), and a similar upward trend is evident across other advanced
economies. Changing societal norms and rising educational attainment have contributed to more women
moving into paid employment or employment outside the home. Female participation has also been
influenced by the increasing flexibility of working-time arrangements, the availability and cost of
child care and policies such as parental leave.
Nearly half of employed females work part time, often to care for children. Over recent decades, the
participation rate of mothers with dependent children has trended higher, rising by 10 percentage
points since the early 2000s to 73 per cent. Over the past decade, the rise in participation
has been most pronounced for mothers with children aged between 0 and 4 (Graph 3). Of those
returning to work within two years after the birth of a child, an increasing majority are citing
‘financial reasons’ as their main reason for doing so. Other mothers returning to work
cite ‘social interaction’ or to ‘maintain career and skills’ as their main
reason. Financial reasons could be capturing a number of different considerations including low income
growth, the rise in household debt or child care costs.
Graph 3
Research suggests the cost and quality of child care does have a significant effect on the labour
supply of women.[4] Data from the HILDA survey show that the share of households using formal child care
for young children has increased notably over the past decade (Graph 4). However, access to child
care places and financial assistance with child care costs remain ‘very important’
incentives for females currently outside the labour force.
Graph 4
Another factor that is linked to higher rates of female participation over recent decades is the
increase in the level of mortgage debt of home owners (Graph 5). The rise in debt levels has
broadly coincided with the increase in the participation rate of females. However, it is difficult to
establish which way causality is going. Are debt levels higher because more households have two incomes
and can afford to borrow more? Or does the need to borrow more to afford housing drive the decision to
participate more? Or is it the case that the low level of income growth in recent years has meant that
households have more debt than they anticipated and need to work longer to pay it down? Research to
establish causality has usually found some evidence of a causal relationship running from higher debt
levels to higher participation.[5] However, the analysis indicates that the effects are not that large at an
aggregate level.
Graph 5
The rollout of the National Disability Insurance Scheme (NDIS) may also have encouraged increased
participation of female carers. We know from a detailed survey of NDIS participants and their families
that parents of those with disabilities work fewer hours on average and are more likely to be in casual
employment.[6] It is probably too early in the rollout of the scheme to see a material increase in the
number of parents re-entering the labour market. The survey suggests there has been a slight increase in
the average number of hours worked since the start of the scheme, but the percentage of families/carers
of NDIS participants who wanted to work more hours has not changed.
Thus two significant drivers of the increase in participation rates of females aged between 25 and
54 over a long period of time are child care costs and other financial factors. The open question
is how much more the participation rate of this group will rise.
Older workers
The share of the Australian population aged between 15 and 64 years has continued to decline,
and is expected to continue to decline. This is due to the ongoing transition of baby boomers into
retirement ages. All else being equal, an ageing population will result in a fall in the supply of
labour, since the generation retiring is larger than the generation entering the workforce. But there
has been a long-term trend for each cohort to participate more than previous cohorts did at the same
age. That trend has accelerated recently, and more than offset the effect of ageing on its own. The
share of 55 year olds and older that are employed is 35 per cent, compared to
22 per cent 20 years ago.
This cohort effect is particularly clear in the third panel of Graph 6. The much larger rise in
female participation than males over the past two decades is a stark illustration of the effect, as the
other drivers of participation in this age group should have similar influences on both male and female
participation.
Graph 6
Why are older people working longer?[7] One contributing factor is improved health. People are
working longer because they can, both because of their own health and also because the nature of work
has changed over the years towards services and away from manual work, which means most people are in
less physically demanding jobs.
It used to be the case that many older workers would have to choose between working full time and
retiring. From a labour economics point of view, the labour/leisure trade-off has much more choice than
it used to.[8] In the past, it was often an all or nothing decision. As the labour market has become
more flexible over recent decades, older workers may be able to reduce their hours but still participate
in the labour market. Indeed, around one-third of workers aged 55 years and older are working part
time, with over half doing so because they prefer to do so. The ABS Retirement and Retirement Intentions
survey suggests that of people aged 45 years and older, around one-third of workers intend to cut
down from full-time work to part-time work as they get older.
As people live longer, they may want to work longer voluntarily, depending on the value they get from
working. But they also may need to work longer to achieve the necessary income to support the standard
of living they would like in retirement.
Access to a retirement pension or superannuation is a very significant element in the decision to
retire. More than half of all retirees over 60 cite that reaching retirement age or becoming
eligible for the pension/superannuation as the main reason they retired from work. The male
participation rate begins to decline around age 50 and there is a noticeable change in the rate of
decline around 65; the historical pension age for men. For women there is a similar pattern, although in
the past there was also a change in the rate of decline around age 60.
Accordingly, announced and actual increases in pension ages are also likely to have contributed to
increased participation. This has been documented in the past for females after the government increased
the female pension age from 60 to 65 between 1996 and 2013 (in 6 month increments every
2 years).[9]
Currently the pension age is being raised to 67 years for both sexes; a process that began in
2017. The average age of job leavers over the age of 55 has increased slightly in recent years. Our
analysis of LFS micro data provides tentative evidence that the 2017 changes to the pension age had an
impact on workers’ retirement decisions. The participation rate of those born in 1952 and 1953 (who
were affected by the changes in 2017) does not decline as quickly when they turned 65, compared to the
earlier cohort groups that were not affected by the pension age increase.[10] In
aggregate, this analysis suggests that the pension changes boosted the participation rate by around
0.1 percentage point.
As I said above, some older workers are working for financial reasons. As we all know, one of the major
considerations for those contemplating retirement is their wealth and ability to fund their retirement.
Increasing house prices and share prices over much of the last decade are likely to have reduced
participation of older individuals.[11] The recent decline in house prices may have resulted in
some individuals delaying their retirement and not withdrawing their labour supply. However, the price
declines were modest compared to the earlier increase, so that those considering retirement would have
experienced a net gain in house prices and a decline in their debt.
Similar to females, the rise in the participation rate of persons aged 55 years or older is also
likely to have been related to developments in household debt. Over recent decades there has been a
trend towards greater indebtedness for these persons. The proportion of older households with
owner-occupied home loans has risen from around 20 per cent in the early 2000s to around
37 per cent today. The increase in debt has also been associated with a change in the
retirement intentions of older workers. Over time, the gradual shift towards later retirement has been
more noticeable for those with debt (Graph 7). As with the female participation story, there is a
question of causality. Are people working later in life because they have an unexpectedly high level of
debt? Or had they always intended to work longer and hence were more willing to borrow more and carry
more debt later in life?
Graph 7
To draw this together, participation rates have risen as employment has grown over the past three
years. This increase in supply has been unexpected, so it is important to try to understand what is
driving it to have some sense on how much further these trends are likely to run. The two major shifts
in participation have been amongst females aged 25–54 and older workers. These trends have
been there for a while and have been even stronger recently. I have presented some of the insights from
our analysis of various micro data sources but there is still more to understand. We will continue to
focus on this given its importance to the outlook, which I will come to later.
Employment
What sort of jobs have been created in recent years?
Some have assumed that the jobs that have been created in recent years are lower-skilled or lower-paid
jobs. However, when we break down the occupation-level data by skill type or pay level, this is not the
case. The strongest growth in employment over the past decade has been in highest-skilled (as defined by
the ABS) jobs. There has also been solid growth over the same period in lower-skilled jobs
(Graph 8). Similarly, the growth in employment has been broadly distributed across the pay spectrum
(Graph 9).
Graph 8
Graph 9
Another often stated view is that much of the job creation in recent years has been in the public
sector, rather than the private sector. According to the Labour Account data, the number of jobs created
in the private sector has far outnumbered the number of jobs created in the public sector
(Graph 10).[12] Private sector job creation has been particularly strong in health care and education
(which is partly, but a long way from entirely, due to government spending in these areas),
but also in business services and industries like construction and hospitality.
Graph 10
We have also used the micro data to look at the people that have moved into some of these growth areas.
For example, the share of employment in the health care & social assistance industry has increased
from 9 to 13 per cent over the past decade. Those entering or leaving health care and
social assistance tend to do so from a small number of other industries such as public administration,
support services, education and training and other services into health care and social assistance.
Around 10 per cent of people entering employment from outside the labour market are moving
into health care, while a slightly smaller share move into this sector from unemployment. A large share
of workers between the age of 55 and 69 years of age work in health care and social
assistance, so this is likely to be related to individuals delaying retirement.
Wages
Wages growth has declined noticeably since around 2012. As wages growth has fallen, the distribution of
wages growth has also become increasingly compressed. This fall in the dispersion in wages growth across
jobs mainly reflects a sharp fall in the share of jobs receiving ‘large’ wage rises. The
Bank has highlighted this previously, but I will update that analysis and illustrate the increased
pervasiveness of wage outcomes between 2 and 3 per cent across the labour market.[13]
The share of jobs that experience a wage change of more than 4 per cent has fallen from over
one-third in the late 2000s to less than 10 per cent of jobs in 2018 (Graph 11). Given
that firms are also unwilling or unable to reduce wages, this has meant that the vast majority of wage
growth observations in the labour market are now tightly clustered in the range of
0–4 per cent.
Graph 11
There is growing evidence to suggest that wage adjustments of 2 point something per cent have
now become the norm in Australia, rather than the 3–4 per cent wage increases that were
the norm prior to 2012. The rising prevalence of wage outcomes in the 2s can be seen in the official
data and in the Bank’s liaison with firms.
One notable example is the large increase in the share of enterprise bargaining agreements that provide
annual wage rises in the 2–3 per cent range. The share of such agreements has risen
from around 10 per cent over the 2000s to almost 60 per cent in 2019
(Graph 12). Over the same period, the proportion of agreements providing wage increases of
3 per cent or more has fallen sharply.
Graph 12
A similar picture emerges when we look at the job-level data that underlie the ABS’s wage price
index (WPI). These data, which also provide insights on wage outcomes for jobs where pay is set
according to individual arrangements, also show that the share of jobs getting wage rises in the
2–3 per cent mark has risen noticeably. The Bank’s liaison with firms also
confirms that the share of firms reporting wages growth of between 2 and 3 per cent has
increased to around 45 per cent in recent years. Prior to 2012, fewer than one in
10 firms were reporting wages growth in this range.
Another way to see this shift in wage setting over time is to look at the median rates of
wages growth across all jobs in the labour market (Graph 13). Unlike the mean, the median is less
affected by the large decline in ‘large’ wage rises in recent years and the changing
prevalence of wage freezes. Prior to 2012, median wages growth was firmly anchored at
4 per cent. In recent years, median wages growth has fallen to 2½ per cent, and
has remained at that level.
Graph 13
Different measures of wages growth capture slightly different concepts of labour costs. The WPI, which
is one of the main measures that the Bank monitors, tracks wage outcomes of individual jobs over time,
rather than tracking particular employees.[14] This feature of the WPI makes it useful for gauging
developments in wages growth after abstracting from any changes in the nature of work or the composition
of employment. However, this feature also means that the WPI does not capture wage rises that come from
getting promoted or changing firms.
But other surveys suggest that promotions can be a key source of earnings growth for individuals. On
average, a promotion leads to a 5 per cent boost in hourly wages, which is comparable to the
wage rise a worker gets when switching firms. Since 2012, there has been a broad-based decline in the
proportion of employees that are getting promoted at work or switching jobs (Graph 14). This means
that a smaller fraction of the workforce are receiving these wage rises.
Graph 14
Why have wage outcomes in the 2s become so prevalent?[15] One phenomenon that could explain it is the
well-known tendency for workers to resist reductions to their wages in real terms.[16] This
phenomenon, also known as ‘downward real wage rigidity’, leads to a clumping of
employees’ nominal wage changes in the vicinity of their expected rate of inflation, particularly
when nominal wages growth is tracking at a low level. In that sense, the RBA’s inflation target of
2–3 per cent on average over time provides a strong nominal anchor in wage
negotiations. When my colleagues looked at the job-level WPI data they did find evidence of a clumping
of wage outcomes either at, or just above, expected inflation.
While wage increases in the 2s have become very common for many employees, those whose wages are set
according to an award have generally been receiving wage increases in excess of 2 per cent in
recent years. This reflects the Fair Work Commission adjustments, which have provided support to wages
growth at the lower end of the skill distribution, given the prevalence of award-reliant jobs in this
part of the labour market. Wages growth for the least-skilled jobs has outpaced all other skill groups
since around 2013. This contrasts with the commodity price boom period, when wages growth was strongest
for higher-skilled jobs. Consistent with this, the ratio of average hourly earnings of award-reliant
employees to those of other employees has risen since 2012, largely reversing the falls seen in the
earlier period.
Outlook
The recent Statement on Monetary Policy provided the Bank’s latest forecasts for the
labour market and wages growth. GDP growth is forecast to gradually increase over the next couple of
years, which should result in a small decline in the unemployment rate from its current rate of
5¼ per cent. As Graph 15 shows, there is always uncertainty around that central
forecast. One of the key sources of uncertainty currently around the outlook for the unemployment rate
as well as wages growth, is whether labour supply will be as responsive to labour demand as it has been
in recent years. That is, will the expected increase in labour demand encourage as much participation as
it has most recently? How much further do some of these drivers of increased participation for older and
female workers have to run? That is a difficult question to answer.
Graph 15
The dynamics of participation and unemployment flows will have an important bearing on wages growth as
well as household income growth. We expect wages growth to remain largely unchanged at its current level
over the next couple of years.
Why don’t we think wages growth will pick up over the next couple of years? What we know from our
liaison program is that the proportion of firms expecting stable wages growth in the year ahead is
around 80 per cent and only around 10 per cent anticipate stronger wages growth. Of
those firms expecting stable wages growth, the share reporting wage growth outcomes of
2–3 per cent has steadily risen over time. This supports the case that lower wage rises
have become the new normal (Graph 16).
Graph 16
Recently there has been a rise in the proportion of new EBAs with a term of three years or more. The
lower wages growth incorporated in those agreements suggests that wages growth of around
2½ per cent for EBA-covered employees will persist for longer than in the past.
The more wages growth is entrenched in the 2s, the more likely it is that a sustained period of labour
market tightness will be necessary to move away from that. At the same time, I don’t think there is
much risk in the period ahead that aggregate wages growth will move any lower.
Conclusion
Today I have provided an overview of the current state of play in the labour market and the Bank’s
expectation about how it might evolve in the period ahead. I have highlighted some of the key forces
that have shaped these developments, in particular, the rise in the participation rates of female
workers and older workers. The Bank is trying to understand what has been driving these macro
developments using some newly available micro data sources. This greater understanding should help
inform our outlook for the labour market.
This increase in labour supply has meant that the strong employment outcomes in recent years has not
generated the pick-up in wages growth that might otherwise have occurred. At the same time, I have
highlighted the increased prevalence of wages growth in the 2s across the economy. A gradual lift in
wages growth would be a welcome development for the workforce and the economy. It is also needed for
inflation to be sustainably within the 2–3 per cent target range.
NAB has announced it will be taking part in the government’s first home loan deposit scheme, operational from 1 January 2020. Via Australian Broker.
The bank has been selected by the National Housing Finance and Investment Corporation (NHFIC) to offer mortgages under the scheme.
“We are proud to be chosen to partner with the federal government and
NHFIC,” said Mike Baird, NAB chief customer officer of consumer
banking.
“Every year our bankers help more than 15,000 Australians achieve
their dream of owning their first home. This scheme is a fantastic way
of helping even more customers, allowing them to potentially save
thousands of dollars on their mortgage.”
The scheme will provide 10,000 eligible Australians per year access
to a home loan with a deposit of as little as 5%. To implement the
scheme, the NHFIC will contract with a panel of selected lenders rather
than having direct contact with borrowers.
Before offering the guaranteed loans, lenders will need to update
their internal systems and train front-line lending staff on how to
apply the scheme eligibility criteria alongside regular considerations,
such as loan serviceability.
The NHFIC has communicated key considerations in its selection of
lender partners includes the loan products on offer, including interest
rates and other fees, as well as the quality of the customer experience.
According to Baird, NAB is the only major to have a special rate for
first homebuyers, which is currently 2.88% fixed for two years. The
major bank also emphasised it will not charge eligible customers higher
interest rates than equivalent customers outside of the scheme.
“We see this appointment as a great endorsement of NAB’s home loan
offering and our support of Australians looking to buy their own home
for the first time,” said Baird.
Before the scheme is live in the new year, customers are able to check their potential eligibility on the NHFIC website.