Domain has released their preliminary results for today. More evidence of a slowing. Last week the result was 39.2%, (off the scale on the Domain chart!).
Preliminary results show similar weakness, and will likely settle lower ahead. This signals lower home prices ahead.
Brisbane listed 102, reported 48 and sold 29 with 3 withdrawn giving a Domain clearance of 57%.
Adelaide listed 80, reported 49 and sold 35 with 5 withdrawn, giving a Domain clearance of 65%.
Canberra listed 96, reported 80 and sold 37 with 5 withdrawn, giving a Domain clearance of 44%.
Welcome to the Property Imperative weekly to 17th November 2018, our digest of the latest finance and property news with a distinctively Australian flavour.
Watch the video, listen to the podcast or read the transcript.
It has been a roller coaster ride on all fronts this week, with more market gyrations, larger predicted falls in home prices locally, and the first “unnatural act” from the Government to try and sustain the finance sector, ahead of next year’s election, expect more ahead.
And by the way you value the content we produce please do consider joining our Patreon programme, where you can support our ability to continue to make great content.
We start with the markets this week the Dow closed lower for the week, despite a rally on Friday that came despite the White House reportedly walked backed President Donald Trump’s upbeat comments on trade.
The Dow Jones Industrial Average rose 0.49% to 25,413 at the end of the week, the S&P 500 rose 0.22% to 2,736, but the Nasdaq Composite fell 0.15%.
After the falls earlier in the week, Wall Street went into rally mode Friday after Trump said he was hopeful the U.S. and China will reach a consensus on trade deal. Later the White House, however, peddled a more sombre narrative on trade in the wake of Trump’s comments, telling CNBC that a deal was not coming soon. Still, the broader averages held their gains, but that did little to avert a weekly loss following a rout in tech. The fear index, the VIX eased a little on Friday, down 9.21% to 18.14, but is still elevated, signalling uncertainty ahead.
In tech, Facebook fell 3% amid the fallout from a New York Times article detailing how the company conspired to cover up warnings that Russia had used the social media platform to disrupt the U.S. election in 2016. Apple moved higher after recent falls, up 1.11% to 193.53, while Alphabet fell 0.26% to 1,068. Intel was up 1.5% to 48.53.
Financials were mixed, with the S&P 500 Financials index up 0.06% on Friday to 443.45 but Goldman Sachs Group was down 0.8% to 202.12.
Sentiment on stocks were also lifted by easing concerns about steeper U.S. rate increases after Federal Reserve Vice Chairman Richard Clarida indicated that the U.S. central bank may stop at the neutral rate, rather than continue hiking beyond the neutral rate, which might be interpreted as an effective “rate cut,” JPMorgan said in a note to clients. The 3m bond rate slid 0.67% to 2.35, and the 10-year was 1.71% down on Friday to 3.065. Clarida does not expect a big increase in inflation this year. With that in mind, both central bankers are still confident enough in the domestic economy to proceed with a December rate hike, but there’s a good chance that it will be accompanied by a less hawkish outlook.
Energy added steel to the rally on Friday as oil prices settled flat, but slumped 6% for the week on concerns about a global glut in supplies. The WTI futures was up 0.66% to 56.83. Oil bears are back to taunting Saudi Arabia by pressuring the market again, just two days after giving a reprieve to the record sell off in crude.
In fact, West Texas Intermediate and Brent crude futures settled steady to slightly higher on Friday after rallying more than 2% earlier in the day on fears that the oil-rich kingdom and the OPEC cartel it leads could cut supplies substantially at a December 6-7 meeting. Friday’s s rebound didn’t help crude’s weekly loss of 6%, making it the sixth-straight week in the red.
Prices initially rose on an analysis from tanker-tracking firm ClipperData that showed Saudi Arabia was already loading fewer barrels on ships bound for the United States this month, continuing a trend that began in September. By sending fewer barrels to the United States, the Saudis hope to starve U.S. crude stockpiles, which have swelled by nearly 50 million barrels the past eight weeks. It’s a strategy the kingdom used last year while working alongside OPEC members, Russia and other producers to rescue oil prices from lows under $50 a barrel. But after the morning highs in New York trade, prices turned volatile before returning to positive territory just before the close. Adding pressure to the market was weekly U.S. oil rig data showing drilling activity at its highest in over three years, after an addition of two rigs this week.
In an extreme turn of events, the fire from Bitcoin Cash’s hardfork war has spread wildly across the entire crypto market, burning through virtually every cryptocurrency and leaving many investors burnt too. Bitcoin had more than $28 billion stripped from the market, as it fell beyond the support of its long-standing safety net at $5,800.
Gold was higher, up 1.9% to 1,222 on Friday, with some suggesting that the US$ bull run might be ending, as economic outperformance, rising interest rates, equity market pressure and trade policy all look suspect, and a switch to metals might make sense. But more likely it is the risks around Brexit, Theresa May could be fighting for her political survival, but the Brexit crisis she’s in has thrown gold bulls a lifeline. Initially resigned to losing the market’s $1,200 support level as the week began, fans of the yellow metal not only got to stay in their comfort zone but also saw their best weekly gain in five as hedgers rushed to the relative safely of bullion after the pounding taken by sterling from Britain’s EU-exit woes. Tory MPs may have enough votes – 48 are needed – for a letter of no confidence that would force a vote in Parliament. If the rebels within her ranks really do have the votes to force a no-confidence motion UK politics will be thrown into an even greater existential crisis.
Not that a change in leadership there would make much difference. U.K. Prime May on Friday reshuffled her minister team and took personal charge of the divorce talks with the European Union. The moves came at the end of an extraordinary week in which seven members of her government resigned and a push to force her from power gained momentum.
The pound gained 0.4% against the U.S. dollar on Friday, rebounding a bit from Thursday’s plunge. But sterling still suffered a loss for the week and volatility soared to a two-year high. The British Pound Dollar was up 0.48% on Friday to 1.2835, while the Euro USD rose 0.76% to 1.1414. The US Dollar index fell 0.51% to 96.43. Deutsche Bank, was down 0.06% to 8.59, not helped by recent Eurozone bank stress test results.
All 3 of the commodity currencies traded higher on Friday with the Australian hitting a 2-month high and the New Zealand dollar hitting a 4-month high. AUD and NZD ripped higher on the hope that President Trump will forgo another round of tariffs on China. Ever since the mid-term elections, his tone toward China has been softening. The Aussie ended up 0.76% to 73.32, helped by strong jobs numbers in October and bullish noises from both the treasurer and the RBA.
In the local market, the ASX 100 fell 0.17% to 4,711, reflecting similar weakness in US stocks. The ASX Financials was also down, 0.09% to 5,635.60 in bearish territory. Regional Bendigo bank was up 0.99% to 10.20, while Suncorp fell 0.15% to 13.54 and the Bank of Queensland was higher up 0.82% to 9.78. Macquarie who generates more than half of its business offshore, rose 0.16% to 119.00 whilst the majors were softer, with NAB down 0.46% to 23.77, Westpac down 0.28% to 25.27, then went ex. Dividend this week, ANZ was down 0.12% on Friday to 25.36 while CBA was up a tad to 68.90. Lenders Mortgage Insurer Genworth tracked lower down 0.91% to 2.18, not least because they are exposed to the housing sector and the investment markets, both of which look weaker. AMP continues in weak territory, although up 1.98% to 2.58. The Australian VIX index eased back, down 3.33% to 16.80, still will in the nervous zone. The Aussie Bitcoin dropped 2.76% to 7,492 and the Aussie Gold slid 0.06% to 1,666.43.
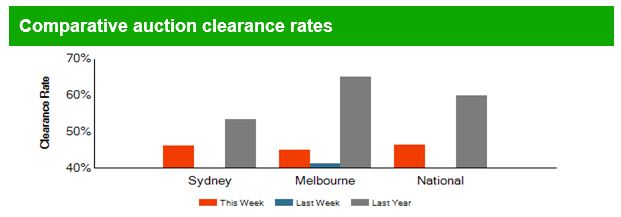
The property news continues south, with the latest CoreLogic average clearance rate down again last week, with only 42.7 per cent of homes successful at auction. And that excludes the large number of unreported results, so the true numbers in even worse. There were 1,541 auctions held across the combined capital cities, having decreased from the 2,928 auctions held over the week prior when a higher 47 per cent cleared. Both volumes and clearance rates continue to track lower each week when compared to the same period last year (2,046 auctions, 61.5 per cent).
In Melbourne, final results saw the clearance rate fall last week, with 45.7 per cent of the 266 auctions successful, down from the 48.6 per cent across a significantly higher 1,709 auctions over the week prior. Across Sydney, the final auction clearance rate came in at 42.6 per cent across a slightly higher volume of auctions week-on-week, with 813 held, up from 798 the previous week when 45.3 per cent cleared. Sydney’s final clearance rate last week was not only the lowest seen this year, but the lowest the city has seen since December 2008.
The only capital city to see more than 50 per cent of auctions successful last week was Adelaide (50.8 per cent), however this was lower than the prior week’s 57.6 per cent. Brisbane saw the lowest clearance rate, with only 30 per cent of homes selling.
Geelong recorded the highest clearance rate of all the non-capital city regions, with 57.1 per cent of auctions reporting as successful, while the Sunshine Coast region had the highest volume of auctions (55).
CoreLogic are expecting more auctions today, so we will see if this eventuate.
I discussed the latest household data at a UBS forum on Monday, other members of the Panel were included Tim Lawless from CoreLogic and Christopher Joye Coolabah Capital as well as Jon Mott Head of Banks at UBS and George Tharenou their Chief economist. You can watch my segment of the discussion “Some Thoughts About The Housing Market” via a scratch recording I made. Frankly demand for property continues to weaken, as supply rises, and sales volumes fall. First time buyers and investors are becoming more cautious. Jon Mott has been negative on the sector for some time and his new note proposes a worst case scenario in which Aussie house prices crash 30%, the RBA cuts rate to zero and launches quantitative easing, and banks are crushed by cascading bad debts, cut dividends and class actions. Smartly he has developed a range of different scenarios (scenarios will sound familiar to anyone following DFA, as we have been doing this for years, it’s the best way to communicate the intrinsic uncertainty in the system.
He thinks that his scenario 3 – housing correction is most likely, with a 10% drop in prices, and that the banks will be challenged in this environment. But if prices fall further, the banks get hit with class actions, and bad debts they will have to cut dividends.
SQM’s Louis Christopher also issued their latest Boom-to-Bust report, and guess what, he also used scenarios. SQM’s base case forecast is for dwelling prices to fall between -6% to -3%, which is a continuation of the current falls of 4.5% over the past 12 months. Sydney and Melbourne will drive the falls. Other cities will record mixed results with Hobart expected to have a third year of strong price rises of 5% to 9%. The base case forecasts assume no changes in interest rates, a Labor win at the next Federal Election with Negative Gearing repeal and CGT changes coming into effect 1 July 2020. If SQM Research is correct on the Sydney and Melbourne forecasts, it will mean by the end of 2019, the peak to trough declines will be at least in the order of 12% to 17% for these two cities. SQM Research believes that, presuming the RBA does not intervene in the market, 2020 could also record price declines due in part to the repeal of Negative Gearing which is a firmly stated Labor party objective. As such there is a risk that the total peak to trough declines could be in the order of 20% to 30% for our two largest capital cities. The range is dependent on: When, if and how the RBA responds to the downturn; How the economy responds to the downturn; Will the banks be required to lift rates out of cycle; Will negative gearing and capital gains tax concessions be repealed as per the Labor Party’s policy. Christopher said, “If the RBA does not respond and/or the bank lift interest rates again in 2019, it is possible the peak to trough falls in Sydney and Melbourne could be even more than this negative range. But we do take the view that the downturn in Sydney and Melbourne will be a significant negative for the overall economy, and so the central bank will eventually respond at some point and cut interest rates.”
Gareth Aird the senior economist at CBA discussed the drivers of dwelling prices, and identified four leading indicators that capture the momentum in the property market well. They are: (i) the flow of credit (i.e. housing finance); (ii) auction clearance rates; (iii) foreign residential demand; and (iv) the house price expectations index from the WBC/MI Consumer Sentiment survey. Presently all of these indicators are pointing to dwelling prices continuing to deflate over the near term (up to six months).
Indeed, credit and prices are strongly correlated, as we have discussed before. From a dwelling price perspective, the flow of credit matters more than changes in the stock. The annual change in housing finance has a close leading relationship with the annual change in dwelling prices by around six months. New lending is driven by the supply and demand for credit. The latest housing finance data indicates that the flow of housing credit continues to fall. And the pace of the decline has accelerated (chart 3). Credit to investors has been trending down for the past 1½ years. But it’s the shift downwards in lending to owner-occupiers that is behind the recent acceleration in the decline of credit.
Generally, auction clearance rates are a leading indicator of prices. Auction clearance rates tend to lead prices on average by two months. Auctions are more popular in Sydney and Melbourne as a means of selling a property. As such, the link between auction clearance rates and property prices is very much a Sydney and Melbourne story. As a rough rule of thumb, the annual change in dwelling prices tends to be negative when the auction clearance rate is below 55%.
Over the past two years, foreign investment in Australian property has waned. This is primarily due to a lift in state government stamp duties levied to foreign investors as well as tighter capital controls out of China. There is a decent relationship between the annual change in property prices against the share of sales going to foreign investors. Generally foreign purchases have led prices on average by around four months, although that lead time has shrunk more recently.
And finally on consumer sentiment, Aird says it has proved a very useful near term indicator of the annual change in dwelling prices. There is of course a self-fulfilling aspect at work. If households expect prices to weaken then demand for credit will fall and prices will correct lower. The reverse is also true when households expect price growth to accelerate. The WBC/MI house price expectations index is pointing to dwelling prices continuing to deflate over the near term.
He also again illustrated the fall in investor borrowing, the shift away from interest only loans, and a significant decrease in the maximum loan sizes now on offer – on average down 20%, though we think for some households the fall is significantly larger. He also showed some households were now paying higher rates, thanks to larger spreads over the P&I loan benchmark.
The trend unemployment moved a little lower according to the data from the ABS, from 5.2 per cent to 5.1 per cent in the month of October 2018. This is the lowest unemployment rate since early 2012 and the 25th consecutive monthly increase in employed full-time persons with an average increase of 20,300 employed per month. The trend underutilisation rate decreased 0.1 percentage points to 13.4 per cent and the trend participation rate remained steady at 65.6 per cent in October 2018.
But wages growth remains sluggish with the seasonally adjusted Wage Price Index (WPI) up 0.6 per cent in September quarter 2018 and 2.3 per cent through the year. The more reliable trend was 0.5% in the September quarter. Private sector wages grew by 0.55% over the quarter, whereas public sector wages grew by 0.61%. So Public Sector wages are growing more strongly, whilst the private sector continues to struggle. The weak wages growth will dent the budget projections and household budgets. Western Australia recorded the lowest through the year wage growth of 1.8 per cent while Tasmania recorded the highest of 2.6 per cent.
So no surprise that our household financial confidence index was lower in October The index measures households overall comfort level with their finances across a number of key dimensions. Recent home price trends, lower returns on deposits and share market gyrations have combined to take the index lower, despite strong employment trends. The wealth effect is now working in reverse, with a potential impact on future consumption. The index returned a result of 88.1, down from 88.4 last month. This continues the decline since late 2016, and is now approaching the lowest ratings from 2015. The convergence across the states continue as home price falls in NSW and VIC take a toll, with the southern state showing a significant slide. WA and QLD appear to be tracking quite closely. Across the age bands, younger households are under the most pressure (thanks to large mortgages, or renting) while those aged 50-60 years remain the most confident, thanks to lower net borrowing, and more savings and investments. For those aged 40-50 recent falls in property prices swamp any benefit from stock market performance. Those holding property for owner occupation remain the most positive, despite falls in paper values of their homes, but property investors are now registering significant concerns, thanks to flat or falling net income from rentals, falling capital values and concerns about the future of negative gearing and capital gains tax relief. More property investors signalled an intention to seek to sell property, as the switch from interest only to principal and interest loans continues. More than 41% of mortgage applications were rejected, compared with 5% last year, as more rigorous underwriting standards bare down. In fact those renting are in many cases more confident than property investors, significant turnaround. The great property investor decade in passing. You can watch our show “Household Financial Confidence Is In The Gutter”.
The use of the Household Expenditure Measure HEM may well be back in play, following the latest from the Westpac ASIC case. Given that at some banks HEM is still being used for around half of applications, and the Royal Commission commented specifically in the use of HEM, perhaps the law needs to be changed. The core of the argument is whether the loans were unsuitable, and that it seems would depend of the ultimate progress of the loan subsequently. In other words, it cannot be proved to be unsuitable until it falls over. ASIC would need to prove the loan was unsuitable! Actually we think the law says lenders have to verify expenses, and in other cases, for example in pay day lending specific inquiries are required as part of the assessment. But it’s as clear as mud at the moment! When is unsuitable lending to be demonstrated? This will have a significant impact on any potential class actions. And of course next week the Royal Commission start they next round, with senior bank executives and regulators on the stand. This should at very least be entertaining, and will perhaps get to the heart of the cultural issues in banking and finance. In this regard you should watch our recent show with John Dahlsen, business man and ex. ANZ Director, who has some important things to say about what has driven the poor outcomes from the sector and what needs to change. It’s a long piece, but highly relevant – “Thinking About Banking From The Inside”.
But for now, banks want more data on expenses, and the latest was ANZ who outlined new tighter rules from 20th November, where mortgage applicants will need to provide much more evidence, and history on income and expenditure. Any income from bonuses will be ignored and income shaded to 80% and evidence of continuous employment is needed. As well as more granularity and evidence on expenditure, they also will want more detail on potential changes to personal circumstances.
And finally, this week we saw the first “unnatural act” from the Government to support the banking sector, in an attempt to alleviate the home price falls and lending freeze ahead of the election next year. The proposed $2 billion funding pool is small beer in the estimated $300 billion SME lending sector. There is precedent a decade ago when the government’s $15 billion co-investment with the private sector into the residential mortgage-backed securities market during the GFC. So the federal government announced a new, $2 billion Australian Business Securitisation Fund to help provide additional funding to small business lenders. But this is lipstick on a pig in my view, and does not get to the heart of the matter at all. But I expect more such measures in the run up to the next election.
And if you want to understand what is ahead, then watch my recent interview with Harry Dent, as we discuss the limitations of central banks, and how QE has really created a monster which is still running rampant. And we are also extending our reach into the New Zealand market with the help of Joe Wilkes, see our latest Ireland V New Zealand – A Passion For Rugby & Property.
But to sum up the state of play, the Bears are indeed in town, and we should prepare ourselves for more falls ahead. Our scenarios continue to play out as expected.
Finally, a quick reminder, our next live Q&A session is now scheduled for November 20th at 8 pm Sydney time. You can schedule a reminder by using the YouTube Link and join in the live discussion, or send in questions beforehand. If previous sessions are any guide, it should be a lively event!
Property expert and economist Joe Wilkes and I continue our exploration of New Zealand property. Are there parallels with Ireland? (and we all know what happened there!).
Caveat Emptor! Note: this is NOT financial or property advice!!
In this discussion, Harry Dent, the famous author, strategist and economist and I discuss the problem of the role of Central Banks. Are they part of the problem, or the solution?
Australian fintech Tic:Toc – the world’s only fully digital home loan platform – has announced Bendigo Bank will use Tic:Toc’s proprietary technology to power its own instant home loan, Bendigo Bank Express.
The white label partnership will allow Bendigo Bank to be the first Australian lender offering a digital home loan application and assessment process under its own brand, accelerated with Tic:Toc technology.
Tic:Toc launched the World’s first instant home loan™ in July 2017, and is now collaborating with financial institutions to offer their platform as a service; helping bring traditional home loan processes up to speed.
Tic:Toc’s technology offers customers a streamlined digital fulfilment process, while lenders benefit from significant efficiencies in the way they can originate home loan customers. The automated assessment strips cost from the process and delivers higher responsible lending standards via inbuilt reg-tech and digital validation of income and expenses.
Announcing the agreement, Tic:Toc founder and CEO, Anthony Baum, said most importantly, the customer will be the ultimate beneficiary of the collaboration between financial institutions and fintechs.
“Tic:Toc is changing the customer experience when it comes to home loans. It’s no longer necessary to wait weeks for home loan approval, when it can be done digitally and conveniently.
“There’s actually not much difference between home loan options. But there can be a big difference in how that home loan is delivered, and the experience for the customer.
“Our automated assessment and approval technology also creates dramatic cost efficiencies for lenders.
“You only need to look to the United States to see how a digital home loan can change a market: Quicken Loans is now America’s largest home loan lender after launching their online product, Rocket Mortgage.
“Our partner, Bendigo and Adelaide Bank, shares our passion for great customer outcomes, so we’re delighted the Bank has chosen Tic:Toc to offer its customers a truly digital experience, if they want it.”
Bendigo and Adelaide Bank Managing Director, Marnie Baker said, “Our partnership with Tic:Toc is another example of Bendigo and Adelaide Bank investing in innovative technologies to offer Australian consumers more choice, and ultimately, better digital experiences.
“Our strategy means we can provide the best solution to customers by selecting the right partner to offer the right services to meet our customers’ needs and make it easier for them to do business with us. Fintech disruption, combined with banking innovation, is helping us drive better outcomes and we consider relationships with fintechs, such as Tic:Toc, as a mutually beneficial strategy.
“We believe we can grow our business through our vision of being Australia’s bank of choice and we will do this by providing new and existing customers with valued and relevant products and services, all while investing in new capability and innovation,” she said.
Bendigo Bank Express will be available to customers in early 2019.
Since its launch, Tic:Toc has received more than $1.6 billion in value of submitted home loan applications. While the white label product will be available directly from Bendigo Bank, the multi award-winning home loans originated by Tic:Toc are already available throughout Australia at tictochomeloans.com.
An interesting piece in the The Conversation. suggesting that regulation of banking will not deliver the outcomes we need:
The financial services royal commission resumes for its final round of hearings on Monday, and reappearing before Justice Hayne will be the chief executives each of the big six institutions he has in his sights: the Commonwealth Bank, Westpac, AMP, Macquarie, ANZ, and the National Australia Bank.
At issue are shockingabusesoftrust, and when the government responds after receiving the report in February it will be under pressure to introduce tighter rules that more closely regulate bankers’ behaviour.
There’s another, better, path it could follow. It could loosen the rules and treat bankers more like doctors.
Crude attempts to regulate behaviour fail
We trust doctors, not because their behaviour is tightly regulated but because it is self-regulated. As professionals they strive to be trustworthy, in the same way as citizens who don’t cheat on their social security claims, or restaurant customers who don’t eat without paying.
A regulation imposed on top of a relationship of trust can ruin it.
In a famous study titled A Fine Is A Price, economists Uri Gneezy and Aldo Rustichini examined what happened when an Israeli daycare centre attempted to impose fines on parents who picked up their children late.
Surprisingly, the trial of the fine resulted in more, rather than fewer, late pickups.
In the eyes of the late parents, the fine changed late pickups from bad behaviour into an acceptable outcome of cost-benefit analysis. They simply interpreted the fine as a babysitting cost, and weighed it against the benefit of arriving when it suited them. Moral motivations were crowded out.
Doctors take vows
Professionals with ethics take vows to honour their duty to their clients, even where the costs of doing so are greater than the benefits of not doing so.
Service providers who don’t take ethics seriously weigh the costs and benefits of acting in the interests of their clients versus acting in their own interests. This ‘moral optimization’ may take account of ethics, but only if it pays.
Many financial services workers don’t take ethics seriously partly because they have been trained in economics or finance – disciplines which teach that cost-benefit analysis applies to everything.
A start would be to train them better. Their teachers could listen to the words of the creator of much of the theory used to justify performance pay, Michael Jensen of Harvard:
We teach our students the importance of conducting a cost-benefit analysis in everything they do. In most cases, this is useful – but not when it comes to behaving with integrity.
Recent research on the psychological power of money suggests that financial market participants are at risk of negative ethical tendencies when money is used as an incentive, or even when they are just reminded of its importance, so-called money priming.
Money is used as an incentive to in order overcome the so-called principal-agent problem in which agents, (workers or chief executives) are tempted to put they own interests ahead of those of the firm they work for.
It can work, but if high-powered financial incentives communicate that the recipient’s only goal should be to maximise profit, then a culture of material self-interest takes hold, constrained at best by the letter of the law. And this crowds out other interests, such as those of their customers.
This means high-powered financial incentives can solve one kind of untrustworthiness, but only by creating another.
Professionals such as doctors and teachers solve the principal agent problem in another way: through ethics.
Banking could be a profession
Rather than further regulation, we propose a greater focus on ethics through a program of professionalisation, including:
Establishing an interim professional body run by outsiders who come with a proven ethic of serving the public in fields such as education or health. After five years the finance industry can apply to the government to staff and run the body itself, subject to performance.
A winding back of regulation in order to signal that “you are professionals who have to take responsibility for ethical judgements”. The professional body could stand down senior managers deemed to be showing commitment to the new culture.
A fundamental change of bonuses so that they become incentives for ethical behaviour. We suggest an automatic bonus payment of 10-20% of total pay. It could be withheld for two reasons: either poor financial performance of the firm, or an ethical breach. In effect, it would be a negative bonus. Multiple ethical breaches would result in the loss of professional status and employment.
Regulation hasn’t worked
Automatic bonuses remove the extreme money priming of the finance industry, and they can be helpful in maintaining employment in the event of a downturn. They can simply be reduced instead of laying off staff, as happened during the global financial crisis.
Boosting regulation and boosting the capability of regulators, as many say they want, could work against developing the ethics and the trust that makes other professions work.
Authors: Warren Hogan Industry Professor, University of Technology Sydney; Gordon Menzies Associate Professor of Economics, University of Technology Sydney
RBA Deputy Governor Guy Debelle summarised the Bank’s assessment of the various measures put in place to address the risks around housing lending. He argues risks are under control, though external shocks could still hit household balance sheets. Loose ending is not seen as a risk…. Hmmmm! Whilst the regulatory measures have significantly reduced the riskiness of new housing lending, we have masses of loans written under weaker regulation, which are exposed.
The motivation for implementing these various measures was to address the mounting risk to household balance sheets arising from the rapid growth of certain forms of lending, in particular lending to investors and interest-only (IO) lending. The strong growth in investor borrowing was increasing the risk that investor activity could be excessively boosting housing prices and construction and so increasing the probability of a subsequent sharp unwinding. This risk is greater for investor borrowing than owner-occupiers as investors can behave pro-cyclically, withdrawing from the market as it declines. The rise in the prevalence of interest-only borrowing for both investors and owner-occupiers increased the overall risk profile of household borrowing. No principal is repaid during the IO period, and the increase in required repayments can be large when the IO period expires.
I don’t see the riskiness of the borrowing as being the source of the negative shock. My concern is for its potential to be an accelerator to a negative shock from another source. To put it another way, I don’t regard it as likely that household borrowing will collapse under its own weight. Rather, if a negative shock were to hit the Australian economy, particularly one that caused a sizeable rise in unemployment, then the risk on the household balance sheet would magnify the adverse effect of that shock. This would have first order consequences for the economy and hence also for monetary policy.
To repeat the conclusion of the assessment in the FSR: the measures have helped to reduce the riskiness of new borrowing. In turn, this has stemmed the increase in household sector vulnerabilities and improved the resilience of the economy to future shocks. The measures have led to a slowing in credit growth but there is little evidence to suggest that the measures have excessively constrained aggregate credit supply. Housing credit growth has slowed, but it is still running at 5 per cent.
The various measures implemented to address the riskiness of housing lending fall into three categories:[1]
Lending standards or serviceability criteria. This includes tightening up the assessment and verification of borrower income and expenses, the discouragement of high loan-to-valuation ratio (LVR) loans and ensuring that minimum interest rate buffers were being applied, including on existing loans.
Investor lending growth benchmark. A 10 per cent cap on investor lending growth was introduced in December 2014.
A cap on the share of interest-only loans in new lending of no more than 30 per cent.
These measures were introduced progressively over a number of years. The scrutiny on serviceability by both APRA and ASIC has been underway for over four years now. For example, in September 2015, APRA noted that by then, serviceability practices had been tightened, such as the haircutting of various forms of income, including rental income. At the same time, APRA reported that minimum interest rate buffers and floors were also being more consistently applied.
This means that these tighter lending standards have been in place for a while now. They are not a recent phenomenon. But this also makes assessing the overall impact difficult in some cases, though the effect of some of the measures has been obvious. There clearly has also been an interaction between them.
What Has Been the Effect of These Various Measures?
Different interest rates are now charged across the various types of mortgages. Interest rates are higher on investor lending and interest-only lending than they are on owner-occupier lending (Graph 1). Previously there was little, if any, variation in the interest rate charged on different types of loans, beyond the size of the discount that varied with borrower income and the size of the loan.
Graph 1
Rather than use quantitative restrictions on the flow of new investor or interest-only lending to meet the requirements, banks chose to increase the interest rate on all loans of these types, both new and existing. Judging by what happened, it appears that the impact of the interest rate changes on borrower activity was difficult to calibrate. The banks seem to have increased rates by more than enough to achieve the requirements with most significantly undershooting the caps on both investor lending growth and the share of IO loans.
Investor lending growth took a while to respond to the introduction of the growth benchmark, in part because banks didn’t increase interest rates on investor loans until some time after its introduction (Graph 2). But there was a sharp and immediate slowing in response to the cap on IO lending. The share of IO loans in the flow of new lending declined sharply from 40 per cent in March 2017 to 17 per cent by September 2017 and has remained around 15 per cent since then. At the same time, the share of new lending with LVRs greater than 90 per cent has declined for both owner-occupiers and investors. In particular, there is now only a very small amount of loans to investors being written with LVRs over 90 per cent. Investor credit is now barely growing. Lending to owner-occupiers has slowed but is still growing at 6½ per cent.
Graph 2
As a result there has been a sizeable shift in the composition of the stock of housing lending. In addition, in response to both measures, a sizeable number of borrowers switched from an investor and/or IO loan to a principal and interest (P&I) owner-occupier loan reflecting the now significant interest differential. As a result of switching and weaker growth of investor lending, we estimate the share of housing loans to investors has declined by 5 percentage points to around one-third. Interest-only loans currently comprise 27 per cent of the stock, having been as much as 40 per cent (Graph 3). These changes decrease the riskiness of the stock of housing lending.
Graph 3
There has been a decrease in maximum loan sizes offered by banks to new borrowers in response to the tightening of the serviceability requirements. How big an effect might this have?[2] As any of you who have applied for a home loan may know, often the bank is willing to lend you much more than you want to borrow. Now they are willing to lend you less on average, by around 20 per cent. How much impact this actually has in aggregate depends on how many people are now constrained by this lower maximum loan size that weren’t previously. Using data from the HILDA survey, we estimate that the share of borrowers who are near their maximum loan and so are affected by this change is small, though for those who are constrained the effect can be quite large. Our assessment is that the aggregate impact is less than it would appear on the face of it.
As a consequence of the greater scrutiny of interest-only lending and the tightening of serviceability requirements, some borrowers are no longer able to roll over their IO loan at the expiry of the IO period. The shift to a P&I loan can cause their required payments to increase by as much as 30–40 per cent.[3] Liaison with lenders suggests that some borrowers have encountered repayment difficulties after switching to P&I repayments at the end of their IO terms, but that many have subsequently been able to adjust to higher payments within a year. Loan-level data from the Reserve Bank’s Securitisation Dataset supports this. It is also worth remembering that this process has already being going for quite some time, but we have yet to see it have a material effect on arrears rates. It still has a couple more years to run before the stock of expiring IO loans will have all been written under the current tighter serviceability criteria. But based on the experience to date, I don’t see this is a material risk, particularly given the current favourable macro environment.
Competition
Turning now to look at the effect on these measures on competition. (This is covered in more detail in the FSR Chapter). The investor lending benchmark did have a competitive impact for a time in that it constrained the ability of smaller lenders to gain market share by increasing their lending faster than 10 per cent. That said, with investor lending growing at or below 5 per cent since early 2016, it has not been a significant constraint on most lenders increasing their market share for some time now. Indeed, recently we have seen smaller lenders again gaining market share. Currently the major banks’ share of new lending is at its lowest in a decade. At the same time, there was no constraint on the ability of smaller lenders to gain market share in the owner-occupier market. The interest-only cap did not obviously have an effect on competition. Again, with nearly all lenders well below the 30 per cent threshold, it is not a binding constraint on lenders from increasing their market share.
The tighter lending standards have seen an increasing share of borrowers obtain finance from non-ADI lenders. These lenders are subject to regulatory oversight but less than that of ADI lenders. They are subject to ASIC’s responsible lending standards but not to prudential supervision by APRA. Non-ADIs’ housing lending has been growing rapidly, over twice the rate of growth of ADIs. As a result, the estimated non-ADI share of housing credit has also increased, although it remains less than 5 per cent of the total.
Effect on the Housing Market
The integral relationship between debt and housing prices means that these measures have clearly influenced conditions in the housing market. The FSR analyses in detail the impact on the housing market of the investor lending benchmark in 2014. It uses the fact that the share of investors varies across different parts of the housing market. Differentiating between ‘high’ investor regions and ‘low’ investor regions, the analysis shows that high investor regions had very similar price growth to low investor regions before the benchmark was implemented. In contrast, after the benchmark was introduced, house price growth has been notably slower in the higher investor regions.
Other factors may have also contributed to the divergent price growth between the high and low investor regions. For example, regions with a high share of investors may have also experienced larger increases in housing supply and so slower price growth in the period after the benchmark was introduced. The analysis attempts to control for these other factors and concludes that the policy effect accounts for around two-thirds of the 7 percentage point difference in average cumulative housing price growth between high and low investor regions from December 2014 to mid 2018 (Graph 4).
Graph 4
Again it is worth reiterating that the measures are aimed at the resilience of household balance sheets, not house prices. The assessment of their effectiveness is around the riskiness of household balance sheets, not the outcomes in the housing market. But at the same time, they clearly are having a notable effect on the housing market.
Housing construction activity has been at a high level for some time now. Our forecast is for it to continue at this level for at least a year given the amount of work in the pipeline. Beyond that, we expect construction activity to decline from its peak. Off-the-plan apartment sales in the major east coast cities have declined since around mid 2017, with developers citing weaker demand from domestic investors, as well as from foreign buyers. One risk is that tighter lending standards could amplify the downturn in apartment markets if some buyers of off-the-plan apartments are unable to obtain finance. This could lead to an increase in settlement failures, further price falls and even tighter financing conditions for developers. However, to date, in our liaison with developers, few have reported much evidence of this.
While not directly related to the housing measures, there has been some tightening in credit for developers of residential property. This reflects lenders’ reducing their desired exposure to dwelling construction, which is higher-risk lending, particularly given the longer planning and construction lags of higher density dwelling construction. That is, banks are less willing to lend given the fall in prices. To the extent that the housing policy measures have contributed to the decline in investor demand and prices, they have indirectly affected developers’ access to finance. There is a risk that this process overshoots leading to a sharper or more protracted decline in activity than we currently expect.
The effect of a tightening in lending to developers seems to me to be a higher risk to the economic outlook than the direct effect of the tighter lending standards on households, which has ameliorated risk. Relatedly, there may also be a bigger impact on lending to small business given the extensive use of property as collateral for small business loans. This would be further exacerbated if the banks’ risk appetite for small business lending declines for other reasons.
Housing prices have fallen by almost 5 per cent from their late 2017 peak while the pace of housing credit growth has slowed over the past couple of years. The fall in housing prices is a combination of a number of other factors, including the very large increase in the supply of houses and apartments both now and in prospect. It also reflects a reduction in foreign demand, which has been affected by a tightening in the ability to shift money out of China and an increase in stamp duty in some states.
Some have attributed the slowing in housing credit solely to a tightening in the supply by banks in response to regulatory actions. Others have suggested there has been a weakening in housing demand and so demand for credit, including because of the high level of and weaker outlook for housing prices. To me, reductions in both the demand and supply of credit have been at play and it is hard to separate their effects. For example, tighter lending conditions have reduced how much some people can borrow, and this contributed to weaker demand for properties and so softer prices. Price falls have themselves contributed to weaker demand by investors who are no longer confident of rising values. Assessing the relative importance of demand and supply is also complicated by the fact that banks have cut back most on their lending to less credit-worthy borrowers, but have more aggressively targeted safer borrowers with lower interest rates.
Conclusion
The regulatory measures have significantly reduced the riskiness of new housing lending. A smaller share of new loans are to investors, are interest-only, have high LVRs or are to borrowers more likely to have difficulty repaying the loan. But it takes time for the riskiness of the stock of outstanding loans to improve. When you implement a change in lending standards the existing loans are no different to how they were the day before. But over time a larger share of outstanding loans will have been written with more stringent lending standards, while the larger share of principal and interest loans will see more of the outstanding loans have a declining balance over time. Finally, in assessing the overall riskiness of the debt both before and after the various measures, it is worth remembering that arrears rates remain low.
To conclude, the available evidence suggests that the policies have meaningfully reduced vulnerabilities associated with riskier household lending and so increased the resilience of the economy to future shocks.
Property Expert and Economist Joe Wilkes and I discuss the impact of foreign buyers in the New Zealand market, in the light of the recent ban, and the implications for the markets ahead.
Joe also looks at the impact of marginal borrowers on home prices and sales, in the light of recent data. This is an important concept which describes the network effect on prices and volumes as demand eases.
You can watch his previous show where he starts the NZ conversation as part of the UK background discussion, and some context for his comments.
More shows in the works as we amp up our coverage of the New Zealand market.
I discuss the current state of banking in Australia with businessman John Dahlsen, who was a director at ANZ for many years.
He brings his extensive experience to the issues facing the sector, and lays out an approach which would create more customer centric, efficient and lower risk banks.
The ACCC says that the Federal Court has imposed record penalties totalling $18 million against We Buy Houses Pty Ltd (We Buy Houses) and its sole director, Rick Otton, for making false or misleading representations about how people could create wealth through buying and selling real estate, following ACCC action.
The penalties of $12 million imposed against We Buy Houses, and $6 million imposed against Mr Otton personally, are the highest ever imposed for contraventions of the Australian Consumer Law by a corporation and an individual, respectively.
The Federal Court also banned Mr Otton from managing corporations for 10 years in Australia and permanently restrained Mr Otton and We Buy Houses from further involvement in the supply or promotion of services or advice concerning real property transactions or investment.
“We Buy Houses and Mr Otton peddled false hope to people simply looking to get a foothold in the housing market or invest money in real estate for their future,” said ACCC Chair, Rod Sims.
“The record penalties imposed against both We Buy Houses and Mr Otton reflect their egregious conduct.”
“They have also effectively been permanently banned from any further involvement in real estate in order to protect consumers,” Mr Sims said.
“These record penalties demonstrate the determination of the ACCC to take strong and effective enforcement action against businesses and individuals who prey on consumers using the false hope of creating financial success. The judgement signals the Court’s condemnation of false and misleading property spruiking and get rich quick schemes.”
“This outcome also reflects a recent trend of higher penalties for Australian Consumer Law breaches. We can expect this to continue following recent law changes to increase maximum financial penalties under consumer law,” Mr Sims said.
We Buy Houses and Mr Otton taught real estate investment strategies via free seminars, and paid ‘boot camps’ and mentoring programs that claimed people could:
buy a house for $1, without needing a deposit, bank loan or real estate experience, or using little or none of their own money
create passive income streams through property and quit their jobs
build a property portfolio without their own money invested, new bank loans or any real estate experience, and
start making profits immediately and create or generate wealth.
“In her judgement on liability, Justice Gleeson said the free seminars were a waste of time, and that the boot camps and the mentoring programs were an expensive waste of time,” Mr Sims said.
The Court also found that Mr Otton had made false or misleading representations that he had successfully implemented the wealth creation strategies he taught. In addition, a book authored by Mr Otton, and websites operated by We Buy Houses and Mr Otton, included testimonials from ‘students’ claiming they were able to buy a house for $1, which the court found were false or misleading.
Background
The ACCC instituted proceedings against We Buy Houses and Mr Otton in March 2015 following a coordinated investigation with New South Wales Fair Trading. On 11 August 2017, the Federal Court delivered judgment on liability, finding that Mr Otton and/or We Buy Houses had engaged in multiple contraventions of sections 18, 29(1)(f), 29(1)(g), 34 and 37 of the Australian Consumer Law.
We Buy Houses had been conducting training programs including free seminars, boot camps and mentoring programs throughout Australia since around 2000. Between 2011 and 2014, We Buy Houses generated the majority of its $20 million revenue from conducting these training programs.