Negative Equity Rears It’s Ugly Head

As home prices fall, the risk of households with mortgages falling into negative equity is rising. This has the potential to have significant economic consequences for households and the community more generally. I discussed this with Frank Chung from new.com.au yesterday who posted an article based on the DFA analysis. As house price falls accelerate, a growing number of mortgage holders across the country are being left in the negative equity “prison”. Today I want to take that forward.

Negative equity is a simple concept, the mortgage you owe on a property is worth more than the current market value of the property.  This means that if a household needs to sell, they would be left with an outstanding debt to the bank. And meantime, because of the higher risk, borrowers might potentially facing higher interest rates.

If you are forced to sell, due to a change of circumstances such as the loss of a job, then you are in trouble. Australia has what’s known as “full recourse”, meaning your debt stays with you regardless of your financial situation.

Why is this so relevant now? Well, first forecasts grow darker for how much further the market has to fall, consensus is beginning to circle around the all-important 20 per cent, with 15 out of 21 economists and experts polled by Finder.com.au backing the figure.

As they put it, “The reason the 20 per cent figure is so crucial is most lenders require a 20 per cent deposit. If you borrow with a 20 per cent deposit and the price falls by 20 per cent, obviously you’re going to be in equity parity — any further and you’re going to be in negative equity. This is the first time we’ve seen decline forecasts starting to push into negative equity territory.”

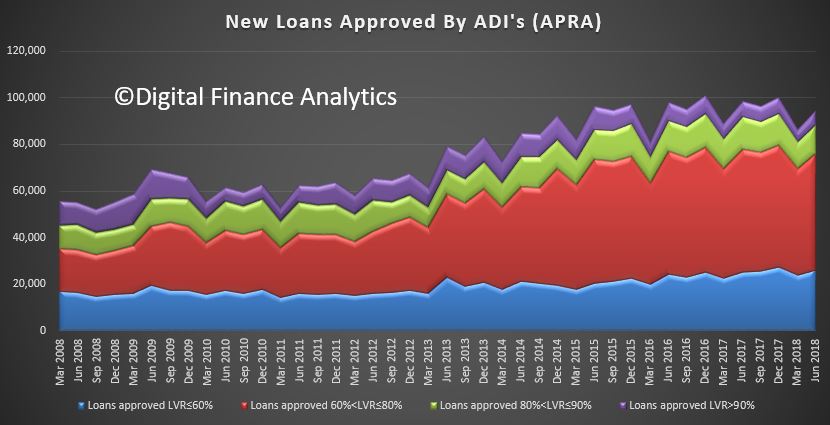
Data from APRA, the Property Exposures figures showed that banks wrote nearly 26,000 new mortgages with a loan to value ratio of more than 90%, and a further 51,000 with an LVR of between 80 and 90 percent. That is 20% of all loans written in the same period. I would expect these numbers to fall significantly, as lenders tighten their standards further.

But it’s also worth remembering that in some cases existing borrowers have pulled more equity out to allow them to pass funds to their kids – the so called bank of Mum and Dad, and in the case of a forced sale, the market value may well overstate the true recovery value of the property.   Using a property as an ATM does not work in a falling market.

Last month, a Roy Morgan survey of 10,000 borrowers found 8.9 per cent were slipping into negative equity — up from 8 per cent 12 months prior — which would work out to around 386,000 Australians.

We have run our own analysis with data to the end of November and on my modelling currently there are around 400,000 households across the country in negative equity, both owner-occupiers and investors. There are about 3.25 million owner-occupier borrowers and at least 1.25 million investors, so around 10 per cent of properties are currently underwater.

As you know we run a range of potential scenarios, but if our central case works out, with an average fall of 20-25 per cent, our modelling suggests that around 650,000 households would fall into negative equity. My more severe case, if an international crisis hits is for a 40 per cent price fall.

Then you’re getting close to one million households. That would be catastrophic for the economy. That’s analogous to what happened in Ireland where prices dropped 40 per cent. A decade later, there are still people in negative equity who’ve never recovered.

The next question to consider is which households are being impacted. In fact, negative equity is touching “lots of different segments” of the market for different reasons, but collectively it is an “early warning sign” for what was to come.

For example, people in Western Australia who bought at the peak of the mining boom, have seen prices fall by about 15 per cent over the past five or six years. In some locations, much more. So there are pockets of negative equity there.

More recent first time buyers perhaps enticed by first homebuyer grants and those who purchased in the past six to 12 months are now underwater, particularly if they bought new properties. This is because newly built properties are losing value faster that more established ones.  It’s like buying a new car, as soon as you drive it off the lot it drops about 15-20 per cent in value.

Then there are the highly leveraged property investors, often with overlapping mortgages. “Quite often we see investors with multiple properties all going underwater. That’s the real sharp end of this.

Meanwhile, investors in places like Brisbane who purchased off-the-plan apartments 18 months ago are now being required to “pony up” and complete the purchase, but the valuation is coming in at 15-20 per cent below the original price.

Realestate.com.au chief economist Nerida Conisbee was quoted as saying that will be a problem for people trying to settle because the banks might not lend them what they now owe, and could also be a problem for the developers.

And it’s not just first homebuyers and investors — people living in expensive suburbs are also feeling the pinch, as prices are falling faster at the more expensive end of the market. We are seeing pockets of negative equity in places you wouldn’t expect to see it, like Bondi and Mosman in NSW and Toorak in Victoria. So there are some more affluent households now suddenly find they’ve got issues too.

Now let’s consider the impact.  Most obviously, it means you’ve lost any paper profit you had. In fact, negative equity is a real bother, it really does have a very negative impact on the economy, households and the wealth effect – as prices rise people feel more confident, as they fall, the reverse is true.

As you know we believe the problem has been set up for decades by loose lending. There is a massive overhang of very highly indebted households, this was a correction that was always going to come — the question now is how far and how fast.

Negative equity also causes banks to “get twitchy” because it means they now have a risk on their book, which could cause them to put up a borrowers interest rate. This is because as the risk profile on that loan goes up the banks will probably put some sort of risk premium on the loan, and we already know many households are struggling with repayments because of flat incomes and rising costs. We will update our mortgage stress results tomorrow.

People with negative equity had very few options except trying to pay it off and wait for the market to rise. If you do sell, chances are you still have a loan remaining. History teaches us people stay put. It basically means you’re stuck, you’re a prisoner in your own property. You just keep paying off their loan, though if you are an investor, you may choose to sell and get out before the losses get worse.  As distressed sales mount, so prices will fall further.

Banks of course should also reappraise the risks in their mortgage books, and will need to lift provisions accordingly, which will depress profitability, and require them to hold more capital.

Realestate.com.au said that people have gotten used to rising prices, but when we look historically the people that do well are those that hold through down and up cycles. If we look at the worst price crash we’ve seen in the ‘80s, it took about four years for prices to recover. You need to be mindful property is a long-term game, it pays to hold, it doesn’t pay to panic sell. And If you do have an investment property and it’s gone underwater but you have a stable tenant and can afford to pay off the loan, “try and get through this cycle”.

“The biggest problem when prices fall is that we start to see distressed sales when people can’t service the loan,” they said.

I agree that the main thing is “don’t panic”. “If you are not forced to sell and can continue to make your payments, it’s a paper problem and most people will be in that situation. But if you are forced to sell, due to a change of circumstances such as the loss of a job, then you are in trouble. Australia has what’s known as “full recourse”, meaning your debt stays with you regardless of your financial situation.

And reflect in this, a decade after the GFC there are still households in Ireland and the UK who remain in the negative equity trap, with little prospect of property values recovering to pre-crash levels a decade later.

It seems to me the path ahead will be a rocky road, and just how big the potholes will be will be determined by the extent of the falls, and the length of the negative equity trap. As prices are still likely to fall further, anyone thinking of buying now needs to be very careful. We are in for a long haul.

Households Under The Pump According To ABS

The Australian economy grew 0.3 per cent in seasonally adjusted chain volume terms in the September quarter 2018, according to figures released by the Australian Bureau of Statistics (ABS) today.  But this was below expectations, and confirms the weaker performance of the economy. The household sector contribution is weakening, on the back of the weaker housing market, weak wages growth and higher costs.  Government spending and commodity prices helped support the weaker numbers.

The RBA was forecasting an annual 3.5% to December 2018, based on the recent Statement on Monetary Policy. With the first three quarters of the year reaching just 2.2%, it would require a December quarter of 1.3%, which seems unlikely.   So they will need to adjust their forecasts down.

All this looks to signal RBA cash rate cuts ahead.

In addition, the per-capita data went negative in September at – 0.1 % meaning that it is population growth alone which is responsible for lifting the GDP.

The per capita income and savings ratios also were negative, with the savings ratio back to lows not seen since 2007, as people dip into reserves to maintain lifestyle and pay the bills – as expected given our household financial confidence index.

And net disposable income per capita fell 0.3% in the last quarter.

We continue to see the economy quite differently from the RBA’s rose tinted windows in Martin Place.  Had it not been for strong commodity prices the story would have been worse still.  But the household sector growth engine is misfiring badly now, as the markets have recognised.

The ASX was down 1.14% at lunchtime to 4,642 on the back of the weak GDP and falls overnight on Wall Street.

The local fear index was higher, up 8.66% t0 16.11, indicating increasing uncertainty.

The Aussie slide against the USD, down 0.34% to 73.14.

And the DOW was down 3.1% overnight, on renewed fears about US recession as the yield curve inversion looks more likely, and trade talks with China continue, and Bexit uncertainty grows.

Signals from the Federal Reserve last week that it may be nearing an end to its three-year rate hike cycle has pushed the 10-year U.S. Treasury yield to three-month lows below 3 percent. The spread between the two-year and 10-year Treasury yields was at its flattest level in over a decade.

Concerns about slowing U.S. growth have accelerated the flattening of the yield curve, a phenomenon in which longer-dated debt yields fall faster than their shorter-dated counterparts.

A flatter curve is seen as an indicator of a recession, with lower longer-dated yields suggesting that the markets see economic weakness ahead.

This is what the ABS said:

ABS Chief Economist, Bruce Hockman, said: “The household sector drove domestic growth with increased consumption supported by moderate rises in household income.”

Household consumption rose 0.3 per cent driven by non-discretionary spending on food and housing. Spending on discretionary items slowed during the quarter. Household gross disposable income continued to grow at a slow pace due to moderate growth in household income being partially offset by a rise in income tax payable.

The subdued growth in gross disposable income coupled with an increase in household consumption resulted in the household saving ratio declining to 2.4 per cent in the September quarter. This is the lowest saving rate since December 2007.

Compensation of employees increased across all states and territories with the exception of the Northern Territory. “The increase in wages was consistent with strong employment growth as reported in the latest ABS Labour Force data, as well as a lift in wage rates.” Mr Hockman added.

Public spending was funded through increased revenue. General government final consumption expenditure increased 0.5 per cent underpinned by continued expenditure in health, aged care and disability services. Public investment remained at high levels with continued work on a number of large infrastructure projects around the nation.

Health care and social assistance output also recorded strong growth reflecting ongoing public investment in health care. Growth was also observed in services industries supporting infrastructure projects. Professional, scientific and technical services, Rental, hiring and real estate services and Administrative and support services all recorded growth during the quarter.

US Agencies Seek To Weaken Mortgage Underwriting Standards

Three US agencies, the Board of Governors of the Federal Reserve System, Federal Deposit Insurance Corporation and Office of the Comptroller of the Currency have released a proposal seeking to lift the property value at which a full appraisal is required.

The three federal banking agencies announced they are seeking public comment on a proposal to raise the threshold for residential real estate transactions requiring an appraisal from $250,000 to $400,000. The appraisal threshold has remained unchanged since 1994, and the agencies believe an increase would provide burden relief without posing a threat to the safety and soundness of financial institutions.

All three agencies have approved the proposal, with the FDIC and the OCC acting on November 20. Comments will be accepted until 60 days after publication in the Federal Register.

Rather than requiring an appraisal for transactions exempted by the threshold, the proposal would require the use of an evaluation consistent with safe and sound banking practices. Evaluations provide an estimate of the market value of real estate but could be less burdensome than appraisals because the agencies’ appraisal regulations do not require evaluations to be prepared by state licensed or certified appraisers. In addition, evaluations are typically less detailed and costly than appraisals. Evaluations have been required for transactions exempted from the appraisal requirement by the current residential threshold since the 1990s.

This proposal responds, in part, to comments the agencies received during their recent review of regulations that the current exemption level for residential transactions had not kept pace with price appreciation.

Additionally, the proposal would incorporate the appraisal exemption for rural residential properties provided by the Economic Growth, Regulatory Relief and Consumer Protection Act and similarly require evaluations for these transactions. In addition, the proposal would require institutions to appropriately review all appraisals required by the agencies’ appraisal rules to ensure their compliance with appraisal industry standards.

Property Downturn: Out And About In “Sunny” New Zealand

Joe Wilkes visits residential developments in the Bay of Plenty and highlights the massive number of new homes under construction there.

What could possibly go wrong?

Some object lessons which are highly relevant to other property markets too!

Caveat Emptor! Note: this is NOT financial or property advice!!

Please share this post to help to spread the word about the state of things….

Please consider supporting our work via Patreon, or make a one off contribution to help cover our costs via PayPal.


RBA Holds, Again (and Again)

At its meeting today, the Board decided to leave the cash rate unchanged at 1.50 per cent.

The global economic expansion is continuing and unemployment rates in most advanced economies are low. There are, however, some signs of a slowdown in global trade, partly stemming from ongoing trade tensions. Growth in China has slowed a little, with the authorities easing policy while continuing to pay close attention to the risks in the financial sector. Globally, inflation remains low, although it has increased due to the earlier lift in oil prices and faster wages growth. A further pick-up in core inflation is expected given the tight labour markets and, in the United States, the sizeable fiscal stimulus.

Financial conditions in the advanced economies remain expansionary but have tightened somewhat. Equity prices have declined and credit spreads have moved a little higher. There has also been a broad-based appreciation of the US dollar this year. In Australia, money-market interest rates have declined, after increasing earlier in the year. Standard variable mortgage rates are a little higher than a few months ago and the rates charged to new borrowers for housing are generally lower than for outstanding loans.

The Australian economy is performing well. The central scenario is for GDP growth to average around 3½ per cent over this year and next, before slowing in 2020 due to slower growth in exports of resources. Business conditions are positive and non-mining business investment is expected to increase. Higher levels of public infrastructure investment are also supporting the economy, as is growth in resource exports. One continuing source of uncertainty is the outlook for household consumption. Growth in household income remains low, debt levels are high and some asset prices have declined. The drought has led to difficult conditions in parts of the farm sector.

Australia’s terms of trade have increased over the past couple of years and have been stronger than earlier expected. This has helped boost national income. Most commodity prices have, however, declined recently, with oil prices falling significantly. The Australian dollar remains within the range that it has been in over the past two years on a trade-weighted basis.

The outlook for the labour market remains positive. The unemployment rate is 5 per cent, the lowest in six years. With the economy expected to continue to grow above trend, a further reduction in the unemployment rate is likely. The vacancy rate is high and there are reports of skills shortages in some areas. The stronger labour market has led to some pick-up in wages growth, which is a welcome development. The improvement in the economy should see some further lift in wages growth over time, although this is still expected to be a gradual process.

Inflation remains low and stable. Over the past year, CPI inflation was 1.9 per cent and in underlying terms inflation was 1¾ per cent. Inflation is expected to pick up over the next couple of years, with the pick-up likely to be gradual. The central scenario is for inflation to be 2¼ per cent in 2019 and a bit higher in the following year.

Conditions in the Sydney and Melbourne housing markets have continued to ease and nationwide measures of rent inflation remain low. Credit conditions for some borrowers are tighter than they have been for some time, with some lenders having a reduced appetite to lend. The demand for credit by investors in the housing market has slowed noticeably as the dynamics of the housing market have changed. Growth in credit extended to owner-occupiers has eased to an annualised pace of 5–6 per cent. Mortgage rates remain low, with competition strongest for borrowers of high credit quality.

The low level of interest rates is continuing to support the Australian economy. Further progress in reducing unemployment and having inflation return to target is expected, although this progress is likely to be gradual. Taking account of the available information, the Board judged that holding the stance of monetary policy unchanged at this meeting would be consistent with sustainable growth in the economy and achieving the inflation target over time.

Australia’s net foreign debt liability position increased $12.6 billion to $1,044 billion In Sept 2018

All the talk today will be about the reduction in the current account deficit thanks to increased goods and services exports as shown in the ABS release to Sept 2018. International trade is expected to contribute 0.4 percentage points to growth in the September quarter 2018 Gross Domestic Product.

But the real story should be the continued expansion of foreign debt to $1,044 billion in Sept 2018. This is where our exposure is to rising interest rates (and we know already the US will continue to hike rates). The 1 Year LIBOR rate, for example, is rising still and this foreshadows real issues ahead.  The debt bomb is alive and well….

Australia’s current account deficit in seasonally adjusted terms decreased $1,368 million in the September quarter 2018 driven mainly by increased goods and services exports, according to latest figures from the Australian Bureau of Statistics (ABS).

The balance on goods and services surplus in the September quarter 2018 was $6,607 million, a rise of $2,704 million. Exports of goods and services rose $3,390 million (3 per cent) following a continued rise in exports of other mineral fuels which includes natural gas, offset by rising imports of goods and services, up $688 million (1 per cent). The net primary income deficit widened by $1,162 million to $16,911 million in the September quarter 2018.

In volume terms, imports falling and strong exports resulted in an expectation for international trade to contribute 0.4 percentage points to growth in the September quarter 2018 Gross Domestic Product. In seasonally adjusted chain volume terms, the balance on goods and services surplus increased $1,603 million, widening the surplus to $2,853 million.

Australia’s net international investment position was a liability of $940.2 billion at 30 September 2018, a decrease of $17.3 billion on the revised 30 June 2018 position of $957.5 billion.

Australia’s net foreign equity asset position increased $29.9 billion to $103.9 billion at 30 September 2018. Australia’s net foreign debt liability position increased $12.6 billion to $1,044.0 billion.

AMP betting on 20% fall in property prices

Top forecaster Shayne Oliver believes there is still plenty of room for property prices to head south as homes weaken to GFC levels; via InvestorDaily.

Australian capital city dwelling prices fell another 0.9 per cent in November marking 14 months of consecutive price declines since prices peaked in September last year. This has left prices down 5.3 per cent from a year ago, their weakest since the GFC.

The decline is continuing to be led by Sydney and Melbourne.

Sydney dwelling prices fell another 1.4 per cent and have now fallen 9.5 per cent from their July 2017 peak. Meanwhile, Melbourne prices fell another 1.0 per cent and are down 5.8 per cent from their November 2017 high.

Perth also saw prices fall by 0.7 of a percentage point, but Hobart and Darwin saw prices rise by 0.7 of a percentage point. Prices in Canberra rose 0.6 of a percentage point and Brisbane and Adelaide prices rose 0.1 of a percentage point.

“The decline in property prices is being driven by a perfect storm of tighter credit conditions, poor affordability, rising unit supply, reduced foreign demand, the switch from interest only to principle and interest mortgages for a significant number of borrowers, fears that negative gearing and capital gains tax concessions will be made less favourable if there is a change of government, falling price growth expectations and FOMO (fear of missing out) risking turning into FONGO (fear of not getting out) for investors,” AMP  Capital chief economist Shayne Oliver said.

“These drags are most evident in Sydney and Melbourne because they saw the strongest gains into last year and had become more speculative with a greater involvement by investors.

“Ongoing weakness in these two cities is evident in very weak auction clearance rates and auction sales volumes. Recent auction clearance rates averaging just below 40 per cent in Sydney and Melbourne are consistent with ongoing price declines of around 7 to 10 per cent per annum.”

The economist believes the decline in Sydney and Melbourne property prices has much further to go as Comprehensive Credit Reporting kicks in, making it even harder to get multiple mortgages.

Many homebuyers will be watching out for changes to negative gearing and capital gains tax, which could become the new reality after a change of government at the coming federal election.

“In these cities we expect to see a top to bottom fall in prices of around 20 per cent spread out to 2020,” Mr Oliver said.

“However, the plunge in clearance rates and the uncertainty around credit tightening and tax concessions indicate that the risks are on the downside. So there is more to go yet.”

Dwellings approved in Australia fell by 1.1 per cent in October

The number of dwellings approved in Australia fell by 1.1 per cent in October 2018 in trend terms, according to data released by the Australian Bureau of Statistics (ABS) today.

NUMBER OF TOTAL DWELLING UNITS

Graph: Number of total dwelling units

The trend estimate for total dwellings fell 1.1% in October.

NUMBER OF PRIVATE SECTOR HOUSES

Graph: Number of private sector houses

The trend estimate for private sector houses approved fell 0.5% in October.

NUMBER OF PRIVATE SECTOR DWELLINGS EXCLUDING HOUSES

Graph: Number of private sector dwellings excluding houses

The trend estimate for private sector dwellings excluding houses fell 1.8% in October.

VALUE OF NEW RESIDENTIAL BUILDING

Graph: Value of new residential building

The trend estimate for value of new residential building approved fell 1.5% in October and has fallen for ten months.

“The trend for total dwellings has been steadily declining over the past twelve months,” said Justin Lokhorst, Director of Construction Statistics at the ABS. “The decrease in October was mainly driven by private sector dwellings excluding houses, which fell 1.8 per cent. Private sector houses also declined, by 0.5 per cent.”

Among the states and territories, dwelling approvals fell in October in the Northern Territory (12.5 per cent), South Australia (5.0 per cent), Western Australia (4.4 per cent), Queensland (2.9 per cent) and New South Wales (2.3 per cent) in trend terms. Victoria (2.4 per cent) and the Australian Capital Territory (0.8 per cent) were the only states to record an increase in dwelling approvals in trend terms, while Tasmania was flat.

NEW SOUTH WALES

Graph: Dwelling units approved - NSW

The trend estimate for total number of dwelling units in New South Wales fell 2.3% in October. The trend estimate for private sector houses rose 0.2% in October.

VICTORIA

Graph: Dwelling units approved - Vic.

The trend estimate for total number of dwelling units in Victoria rose 2.4% in October. The trend estimate for private sector houses rose 0.6% in October.

QUEENSLAND

Graph: Dwelling units approved - Qld

The trend estimate for total number of dwelling units in Queensland fell 2.9% in October. The trend estimate for private sector houses fell 1.3% in October.

SOUTH AUSTRALIA

Graph: Dwelling units approved - SA

The trend estimate for total number of dwelling units in South Australia fell 5.0% in October. The trend estimate for private sector houses fell 2.6% in October.

WESTERN AUSTRALIA

Graph: Dwelling units approved - WA

The trend estimate for total number of dwelling units in Western Australia fell 4.4% in October. The trend estimate for private sector houses fell 3.7% in October.

Approvals for private sector houses fell 0.5 per cent in October in trend terms. Private sector house approvals fell in Western Australia (3.7 per cent), South Australia (2.6 per cent) and Queensland (1.3 per cent). Victoria (0.6 per cent) and New South Wales (0.2 per cent) recorded increases.

In seasonally adjusted terms, total dwellings fell by 1.5 per cent in October, driven by a 4.8 per cent decrease in private dwellings excluding houses. Private houses rose 2.7 per cent in seasonally adjusted terms.

The value of total building approved fell 1.5 per cent in October, in trend terms, and has fallen for twelve months. The value of residential building fell 1.4 per cent while non-residential building fell 1.8 per cent.

RBA subsidiaries fined $22m over bribes

The Central Bank has finally released details of the landmark prosecution that involved two of its subsidiary companies involved in bribing overseas officials for note-printing contracts, via InvestorDaily.

Following a decision by the Supreme Court of Victoria this week, the Reserve Bank of Australia (RBA) is able to disclose that in late 2011, its subsidiaries – Note Printing Australia (NPA) and Securency – entered pleas of guilty to charges of conspiracy to bribe foreign officials in connection with banknote-related business.

The offences were committed over the period from December 1999 to September 2004.

The RBA and the companies were not permitted to disclose these pleas prior to today due to suppression orders, which have now been lifted. The orders were not sought by the RBA or the companies.

In a statement this week, the RBA said the boards of NPA and Securency decided to enter guilty pleas at the earliest possible time rather than to defend the charges, reflecting an acceptance of responsibility and genuine remorse.

“The decisions to plead guilty were based on material that became available to the boards after allegations about Securency had been referred to the Australian Federal Police (AFP) and followed extensive legal advice. The decisions also took into account the public interest in avoiding what was expected to be a costly and lengthy court process,” the central bank said.

No evidence of knowledge or involvement by officers of the RBA, or the non-executive members of either board appointed by the RBA, has emerged in any of the relevant legal proceedings or otherwise.

“The Reserve Bank strongly condemns corrupt and unethical behaviour,” Reserve Bank governor Philip Lowe said.

“The RBA has been unable to talk about this matter publicly until today, although the guilty pleas were entered in 2011. The RBA accepts there were shortcomings in its oversight of these companies, and changes to controls and governance have been made to ensure that a situation like this cannot happen again.”

In 2011, the Reserve Bank Board commissioned a thorough external review of the RBA oversight of the companies. The RBA oversaw a comprehensive strengthening of governance arrangements and business practices in the two companies.

In early 2013, the RBA sold its interest in Securency, having ensured that all the compliance issues of which the RBA was aware had been addressed.

With the lifting of the suppression orders, the RBA is now also able to disclose that the companies paid substantial penalties as a result of the court proceedings.

NPA paid fines totalling $450,000 and a pecuniary penalty under the Proceeds of Crime Act 2002 of $1,856,710. Securency paid fines totalling $480,000 and a pecuniary penalty under the Proceeds of Crime Act of $19,809,772.

Since the companies entered their pleas, four former employees of Securency have pleaded guilty to charges of conspiring to bribe and/or false accounting. Charges against four former employees of NPA were permanently stayed on the basis that continued prosecution of these individuals would bring the administration of justice into disrepute.

ANZ CEO weighs in on the HEM debate

The use of the Household Expenditure Measure to assess serviceability was initially less common for broker-originated loans, but such is no longer the case, ANZ chief Shayne Elliott has revealed, via The Adviser.

Appearing before the financial services royal commission in its seventh and final round of hearings, ANZ CEO Shayne Elliott was questioned over the bank’s use of the Household Expenditure Measure (HEM) to assess home loan applications.

In round one of the commission’s hearings, ANZ general manager of home loans and retail lending practices William Ranken admitted that the bank did not further investigate a borrower’s capacity to service a broker-originated mortgage.

In his interim report, Commissioner Kenneth Hayne alleged that using HEM as the default measure of household expenditure “does not constitute any verification of a borrower’s expenditure”, adding that “much more often than not, it will mask the fact that no sufficient inquiry has been made about the borrower’s financial position”.

Counsel assisting the commission Rowena Orr QC pointed to a review of ANZ’s HEM use by consultancy firm KPMG upon the Australian Prudential Regulation Authority’s (APRA) request.

The KPMG review found that 73 per cent of ANZ’s loan assessments defaulted to the HEM benchmark.

Mr Elliott noted that since the review, ANZ has taken steps to reduce its reliance on HEM, with the CEO stating that the bank plans to reduce the use of HEM for loan assessments to a third of its overall applications.

When asked if there was a disparity between the use of HEM through the broker channel and branch network, Mr Elliott revealed that prior to the bank’s move to reduce its reliance on the benchmark, the use of HEM was less prevalent for broker-originated loans.

“Perhaps surprisingly, when we did the review, when we were talking about the mid-70s [percentage], the branch channel actually had slightly higher usage or dependency on HEM as opposed to the broker [channel].

“[That] actually is counterintuitive,” he added. “I think it would be reasonable to expect that if [ANZ] knows these customers, one might expect to use HEM less.”

Mr Elliott attributed the disparity to the higher proportion of “top-ups” for existing loans through the branch network, noting that ANZ’s home loan managers would be more likely to “shortcut the process” through the use of the HEM benchmark.

However, the CEO said that according to the latest data that he’s reviewed, the branch network’s reliance on HEM is lower than in the broker channel.

“[It’s] changing as we speak,” he said.

“As in the latest data I saw, the branch network is now lower in terms of its usage or reliance on HEM versus the broker channel. And that’s because we are in, if you will, greater control of that process in terms of our ability to coach and send signals to our branch network.”

However, he added that the use of the benchmark for broker-originated loans is “coming down rapidly” in line with the bank’s overall commitment to reduce its reliance on HEM.

Flat-fee ‘credible alternative’ to commission-based model

Further, as reported on The Adviser’s sister publication, Mortgage Business, Mr Elliott told the commission that a flat fee paid by lenders to brokers is a “credible alternative” to the existing commission-based remuneration model.

When asked by Ms Orr about his view on broker remuneration, Mr Elliott said that a flat fee paid by lenders is a “credible alternative” to the current commission-based model.

In a witness statement provided to the commission, Mr Elliott said that there’s “merit in considering alternative models for broker remuneration to ensure that the current model remains appropriate and better than any alternative”.

Reflecting on his witness statement, Ms Orr asked: “Is that because you accept that there’s an inherent risk that incentives might cause brokers to behave in ways that lead to poor customer outcomes?”

The ANZ CEO replied: “There is always that risk. [The] term incentive is to incent behaviour. Therefore, it can be misused or it can cause unintended outcomes if the broker is apt to be led by their own financial reward.”

Mr Elliott acknowledged that “no system’s perfect” and that a “fixed fee is also capable of being misused and leading to unintended outcomes”.

However, he added: “It is just my observation that there is at least some data on this from other markets, most notably in northern Europe. It seems a model that’s worth looking at.”

Mr Elliott continued: “I’m not suggesting it’s necessarily an improvement. It just feels like a credible alternative.”

The ANZ CEO compared a flat-fee model in the broking industry to the financial planning industry.

“The service is the work you are paying for, and perhaps the fee should not necessarily be tied to the outcome.

“I think that’s not an unreasonable proposition.”

However, the ANZ chief noted the negative implications of a flat-fee model, stating that with lenders ultimately passing on costs to consumers, the model would be a “major advantage” to higher income borrowers.

“The difficulty with the fixed fee, if I may, is it essentially is of major advantage to people who can afford and have the financial position to undertake large mortgages,” he said.

“[A] subsidy would be paid by those least able to afford it, and it runs the risk of making broking a privilege for the wealthy.”

There’s ‘merit’ in a fees-for-service model

Ms Orr also asked Mr Elliott for his view regarding a consumer-pays or “fees-for-service” model.

The QC asked whether such a model would address some of the concerns expressed by Mr Elliott about a flat-fee model.

Mr Elliott said that if a fee is paid by borrowers, it would be “uneconomic” for people seeking a loan to visit a broker, repeating that using a broker would become a “service for the wealthy”.

Ms Orr then asked the CEO for his thoughts on a Netherlands-style fees-for-service model, supported by Commonwealth Bank CEO Matt Comyn, in which both branches and brokers would charge a fee for loan origination.

Mr Elliott replied: “There’s merit in looking at that, [but] it still is an imposition of cost that would otherwise not have been there.”

Mr Elliott added that there would be “new costs” associated with a Netherlands-style model, noting that borrowers seeking a “top-up” for an existing loan would need to pay an additional fee.

In response, Ms Orr alleged that under the current commission-based model, costs are also “filtered back down” to consumers.

To which Mr Elliott replied: “In general terms, yes. Not necessarily in direct terms like that fee I charge you as a borrower, [and] at ANZ, we have, for some time, disclosed [commissions]. So, when you do get a mortgage through a broker, we do advise the customer what we have paid that broker. So, it is disclosed to them.”

The ANZ CEO also said that under a fees-for-service model, consumers could be incentivised to take out larger loans to avoid paying a fee if they wish to top up their loan.

Conversely, Mr Elliott added that if a flat fee is paid by lenders, some brokers may be incentivised to encourage clients to borrow less and “come back for more top-ups so that they get more fees”.

Mr Elliott reported that top-ups on existing loans make up 30 per cent ($17 billion) of total volume settled by ANZ.

The ANZ chief also told Ms Orr that he doesn’t believe a move to introduce an alternative remuneration model would be “hugely successful” without regulatory intervention.