More Cultural Badness From The Finance Sector.

Today we take a look at the latest from the Royal Commission into Financial Service Misconduct, which recommenced its hearings yesterday again, with a focus on the Financial Planning Sector.

Financial Advisers provide advice on a range of areas of consumer finance, investing, superannuation, retirement planning, estate planning, risk management, insurance and taxation.

ASIC says between 20 and 40% of the Australian adult population use or have used a Financial Planner.  That means that around 2.3 million Australians over 18 received advice. A number of issues have surfaced in recent years, including charging fees for no service, or advice not provided in full, the provision of inappropriate financial advice, as well as improper conduct by financial advisors and the misappropriation of customer’s funds.

There has been massive growth in the number of financial advisers, to more than 25,000 up 41% from 2009.  5,822 Financial Advice licences were issued in Australia to firms able to offer advice. What you may not know is that the top five players in Financial Advice in Australia are the big four banks and AMP, who together have nearly 48% of the $4.6 billion dollars in annual revenue.  30% of advisers work for one of the major banks and 44% work for the top 10 organisations by revenue, so it is very concentrated. Then there is a long tail of smaller organisations with 78% operating a firm with less than 10 advisors. The average advice licence covers 34 individuals operating under it.

There have been a number of significant scandals relating to the provision of financial advice in recent years.

Townsville based Storm Financial encourage investors to borrow against their home to invest in indexed share funds, in a “one size fits all model” of advice. Storm collapsed in 2009 will losses of more than $3 billion dollars. Around 3,000 of its 14,000 clients had suffered significant losses. Many of the investors were retired or about to retire, and with limited assets and income. Some lost their family homes or had to postpone their retirement. The founders were found to have caused or permitted inappropriate advice to be given and had breech their duty of care under the corporations’ act. Specifically, the one size fits all model of advice failed to take into account individual circumstances which led to devastating consequences for the individual investors. They had focused too much on the profitability of the business as opposed to the best interests of individual investors. ASIC worked with a number of major players for customers who had made investments through Storm. CBA undertook to make $136 million dollars in compensation to many CBA customers who borrowed from the bank to invest through Storm and who had suffered financial losses. This is in addition to $132 million CBA paid under the Storm resolution scheme.  ASIC looked at settlements distributed by Macquarie Bank to Storm investors leading to a revised agreement where the bank agreed to pay $82.5 million by way of compensation and costs. Bank of Queensland agreed to pay $17 million as compensation for Storm related losses.

The second scandal involved Commonwealth Financial Planning Limited. A whistle-blower revealed allegations of misconduct within CFL to ASIC in 2010. It was suggested that some advisers were encouraging investors to invest in high risk, but profit generating products which were not appropriate. Some were even switching products without the client’s permission. This also included forging client signatures. When the GFC hit in 2008, thousands of CFL clients, many of whom were nearing or in retirement, lost significant amounts as a result of this misconduct.   More than $22 million was paid to clients in compensation for receiving inappropriate financial advice from two financial planning advisers. Later it became evident the misconduct was more widespread so CBA implemented a second programme of compensation relating to advice from advisers. Their Open Advice programme had conducted more than 8,600 assessments, of which more than 2,500 required compensations to a total of $37.6 million has been offered.

So turning to the hearings. First up was Peter Kell from ASIC who described the “Fee for no service” problem.

The Future of Financial Advice reforms (FOFA) has tightened the rules, but the fees can be significant. And as we will see, some players simply took the fees to bolster their profits.

Next up was AMP, and we heard over the next day or so of more than 20 occasions when AMP failed in their duty to notify ASIC of a number of potential breaches.

Despite the fact AMP was aware of a range of issues they simply allowed the practices to continue.  There was an absence of monitoring activities, what AMP said it was going to do to ASIC, e.g. training for staff in new procedures was different from what they actually did.  The issues had been occurring since 2009, and AMP acknowledge that on at least 20 occasions they made false and misleading statements to ASIC about potential breeches.

Worse, the Royal Commission revealed today that AMP’s law firm, Clayton Utz, removed outgoing chief executive Craig Meller’s name from a draft of a critical report about the business.

So once again we see the cultural norms in financial services driving poor behaviour, which may bolster profits but at the expense of their customers, and an apparent willingness to avoid the issues with the regulators. This is shameful, but not surprising.

So we see mismanagement again, and failure of regulation.

We suspect we will see more of the same in the day ahead. Frankly I am not surprised because the cultural norms we see displayed here are precisely the same as were observed in the previous lending related hearings. The quantum of change required within our financial services organisations is profound and I also believe the scope of the Royal Commission should be expanded to include the role and function of our regulators.

Multiple failures are clearly costing households dear. But then the companies seem willing to cop the settlements, and move on, without root cause analysis and fixing the problem. This is not acceptable behaviour in my book and is well below community expectations.

Has The Next Asset Collapse Begun?

From  Econimica

After nearly a half century of unlimited dollar creation, multiple bubbles and busts…the current asset reflation has been the most spectacular…but alas, perhaps too successful.

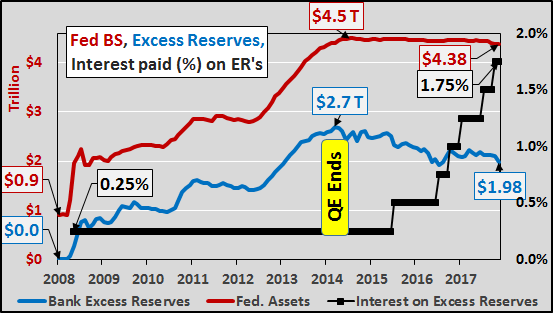
The Fed’s answer to control or restrain this present reflation is raising interest rates to stem the flow of business activity, lending, and excessive leverage in financial markets.  But in the Fed’s post QE world, a massive $2 trillion in private bank excess reserves still waits like a coil under tension, ready to release if it leaves the Federal Reserve.  Thus, the only means to control this centrally created asset bubble is to continuously pay banks higher interest rates (almost like paying the mafia for protection…from the mafia) not to return those dollars to their original owners or put them to work.  With each successive hike, banks are paid another quarter point to take no risk, make no loan, and just get paid billions for literally doing nothing.

The chart below shows the nearly $4.4 trillion Federal Reserve balance sheet, (acquired via QE, red line), nearly $2 trillion in private bank excess reserves (blue line), and the interest rate paid on those excess reserves (black line).  While the Fed’s balance sheet has begun the process of “normalization”, declining from peak by just over a hundred billion, bank excess reserves have fallen by over $700 billion since QE ended.  So what?


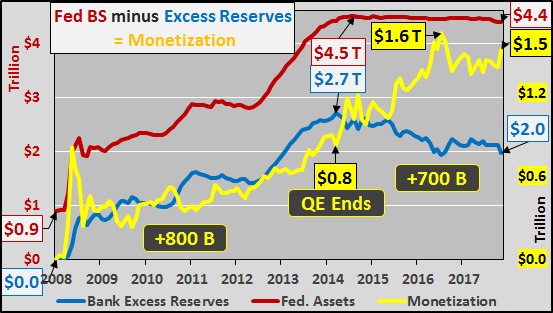
The difference between the Federal Reserve balance sheet and the excess reserves of private banks is simply pure monetization (the yellow line in the chart below).  This is the quantity of dollars that were conjured from nothing to purchase Treasury’s and mortgage backed securities from the banks.  But instead of heading to the Fed to be held as excess reserves, went in search of assets, likely leveraged 2x’s to 5x’s (resulting anywhere from $3 trillion to $7.5+ trillion in new buying power).


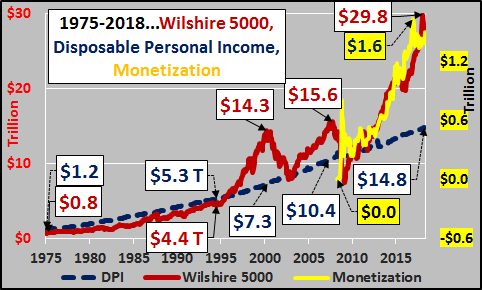
From world war II until 1995, equities were closely tied to the disposable personal income of the American citizens (DPI representing total annual national income remaining after all taxation is paid, blue line).  However, since ’95 lower and longer interest rate cuts have induced extreme levels of leverage and debt.  The Fed actions have created progressively larger asset bubbles more divergent from disposable personal income at peak…but falling below DPI during market troughs.  But after the ’07 bubble, the pure monetization found its way into the market with spectacular effect.  As the chart below shows, the Wilshire 5000 (representing the market value of all publicly traded US equities, red line) has deviated from the basis of US spending, US total disposable income (the total amount of money left nationally after all taxes are paid, blue line).

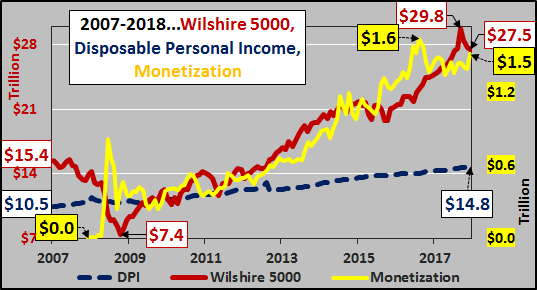
In the chart below, the growth in monetization has acted as a very nice leading indicator for equities.  As each successive pump of new money left the Federal Reserve and entered found its way to the market in search of assets, assets subsequently reacted.  Likewise, each drawdown in monetization saw a similar pullback in equities.

What happens next?  The Federal Reserve plans to systematically reduce its balance sheet via raising interest rates on excess reserves.  This is to incent and richly reward the largest of banks to maintain these trillions at the Federal Reserve.  As the chart below shows, theoretically this means the monetized money is set to continue evaporating, and assuming it was highly levered, then the unwind and volatility of deleveraging should only continue to worsen.

And…if the Federal Reserve is true to its word and even halves its balance sheet while banks maintain the excess reserves at the Fed, then all the digitally conjured $1.5 trillion is set to be “un-conjured”.  Again, assuming the monetized monies were at least somewhat levered, the unwind of that leverage will continue to produce a chaotic and volatile slide in markets.  As the chart below suggests, if US equities (and broader assets) follow the unwind of the monetization, then equities are likely on their way back down to and through their natural support line, disposable personal income.  Conversely, I’ve included the 7.5% long term anticipated market appreciation for reference (green dashed line).  Quite a spread between those differing views on future asset valuations.

Of course, the “data dependent” Fed could change its mind, or perhaps banks will continue to pull those excess reserves and put them to work (with growing leverage) rather than take the risk-free money from the Fed…either way this is something worth watching.

ABA Says Banking Reforms Progressing At Cracking Pace

The ABA says today’s release of the final report of independent governance expert, Mr Ian McPhee AO PSM, shows that Australia’s banks have made significant progress on the Better Banking Reform Program, including finalising many of its measures.

The program, which began in April 2016, outlined a range of changes and initiatives to achieve three outcomes – better products, better service and better culture. Banks have been implementing these reforms over the last two years, with Mr McPhee independently monitoring their program as part of the industry’s commitment to accountability and transparency.

A major part of this reform has revolved around changes to the way banks pay their staff, as outlined in the Sedgwick Review completed in 2017. These changes include removing direct sales incentives, abolishing mortgage broker commissions directly linked to loan size and introducing balanced scorecards in each bank. The review set a deadline for these changes to be completed by 2020 however banks are already well underway in implementing these reforms.

Australian Banking Association CEO Anna Bligh thanked Mr McPhee for his expert oversight over the last two years providing independent governance advice and monitoring for the ambitious industry reform program.

“Ian McPhee and Price Waterhouse Coopers have done a rigorous job over the last two years in their independent monitoring of the implementation of the Better Banking Reform Program,” Ms Bligh said.

“The industry has set a cracking pace on some of the toughest reforms in over a decade, as detailed in Mr McPhee’s final report, however there is still further work to be done to bed these down.

“Banks have made a large investment in reform to better meet community expectations, such as changing the way bank staff are paid and improving customer protections under the new Banking Code.

“Banks are on track to meet the 2020 deadline set by the Sedgwick Review to reform the way they pay their staff including abolishing direct sales incentives and scrapping mortgage broker commissions directly linked to loan size.

“While this is the final report by Ian McPhee the industry has taken his advice and will be putting in place further arrangements for public reporting.

“Banks will be making further regular public reports on the success of the program and their ongoing implementation of the Sedgwick recommendations and the new Banking Code,” she said.

Key initiatives already implemented include:

  • Customer advocates within banks to ensure complaints are resolved quickly and fairly
  • Improving protections and awareness of processes for whistleblowers, including best practice industry guidelines
  • Stamping out poor conduct in the industry by ensuring staff with records of poor behaviour do not simply move around the industry.

Bank of Queensland 1H 18 Results – Meh!

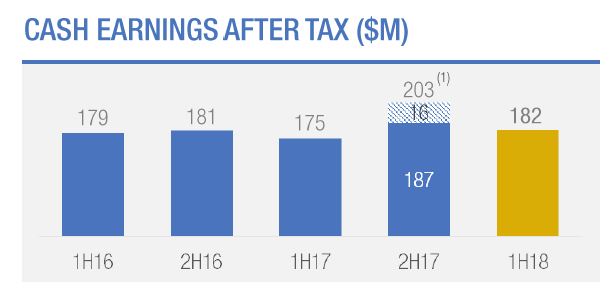
Bank of Queensland (BOQ) has announced cash earnings after tax of $182 million for 1H18, up 4 per cent on 1H17. This is weaker than expected. They continue to bat on a sticky wicket. Being a regional bank is a tough gig! The BOQ Board has maintained a fully franked interim dividend of 38 cents per ordinary share.

Statutory net profit after tax increased by 8 per cent to $174 million.

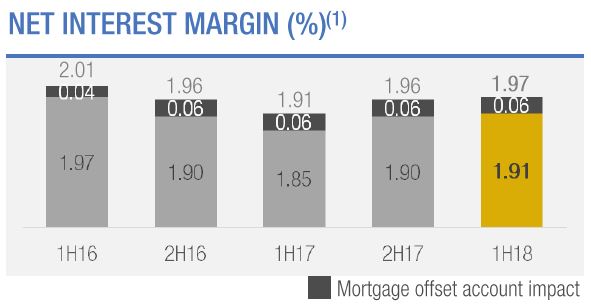
Net Interest Margin was up 1 basis point on the prior half to 1.97%, helped by loan book growth and deposit repricing, but under pressure thanks to intense new mortgage loan discounting. Growth in overall NIM was lower than expected. Ahead we think the higher BSBW rates will impact NIM adversely alongside discounted attractor rates..

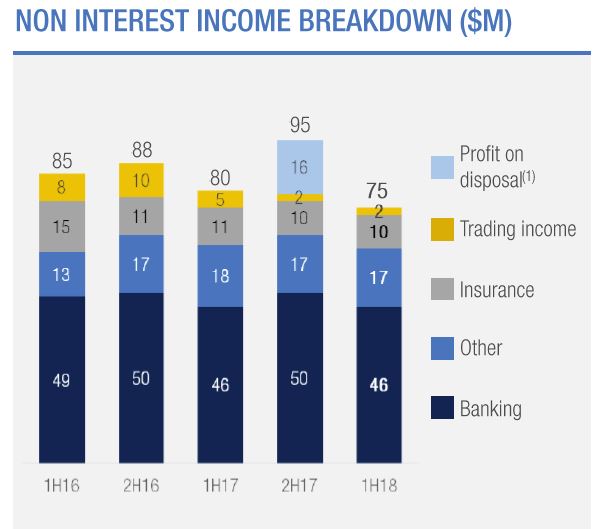
In addition, lower than expected non-interest income hit the result, thanks to an ATM fee impact of $0.6m, banking fees under pressure and a fall in trading income opportunities.

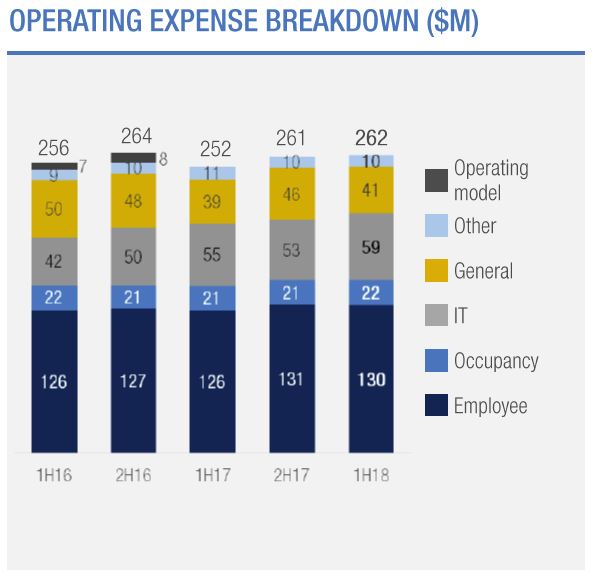
Also higher than expected costs impacted the result. Their Cost to Income ratio was up 20 bps to 47.6%

BOQ also today announced the sale of St Andrew’s Insurance to Freedom Insurance Group. More detail on this transaction is provided in a separate announcement. The CET1 uplift was estimated at 20 basis points after completion, with completion expected in second half of the year.

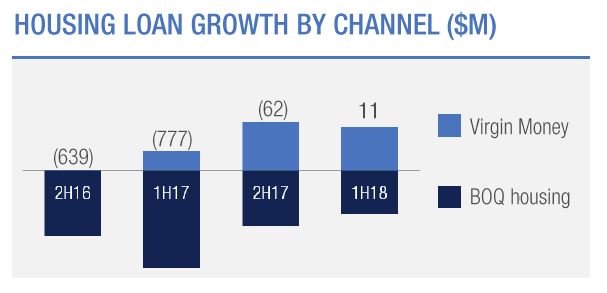
The Banks says there has been a notable improvement in lending growth, continuing the positive business momentum that returned in the previous half. This was supported by the commercial niche segments, as well as home loan growth through the Virgin Money, BOQ Specialist and BOQ Broker channels. Total lending growth of $671 million in 1H18 represents an uplift of more than $800 million compared to the contraction of $157 million in 1H17.

This has been delivered through 3 per cent annualised housing loan growth (+$382 million) at 0.5x system, together with strong commercial loan growth of 6 per cent annualised (+$292 million), which was 1.6x system.

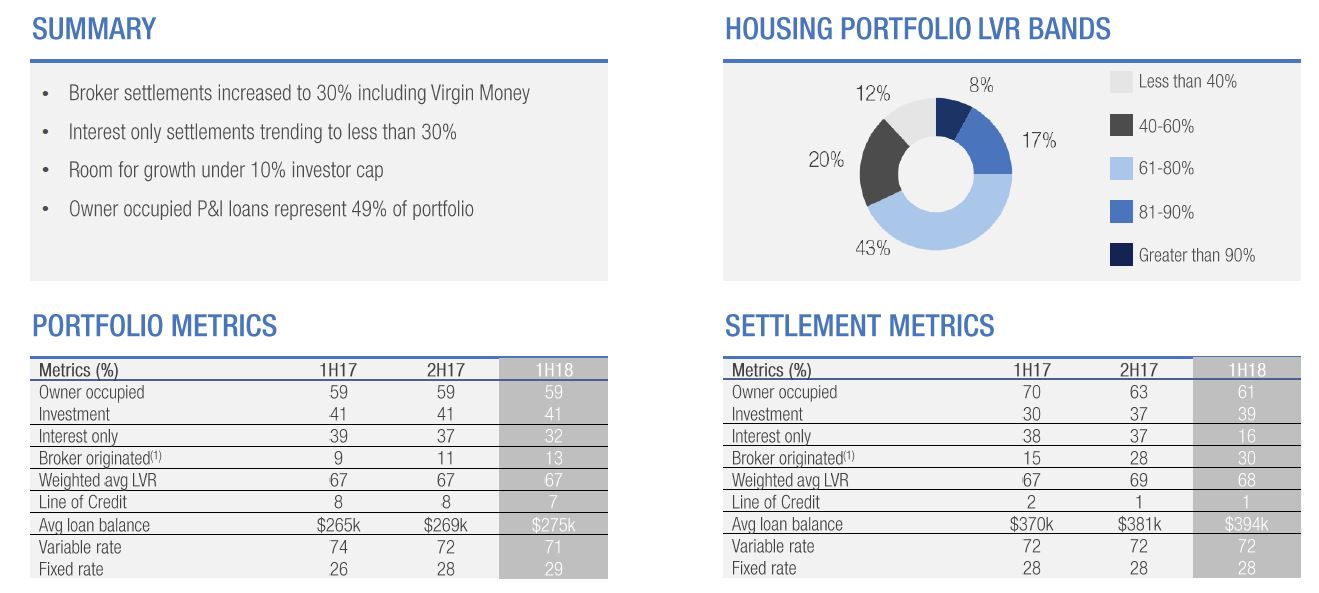
They show that broker settlements increased to 30%, including via Virgin Money, whilst the proportion of investment loans rose to 39%, compared with 30% a year ago. Interest only loans were 16% of flows, compared with 38% a year ago, and represents 32% of their portfolio.  The average loan balance has risen to $394k and the weighted average LVR on new loans was 68%.

“We moved to adopt enhanced servicing, validation and responsible lending practices much earlier than many of our peers” the bank said.

“Although this has hampered our growth in prior periods, we think it was the most prudent approach to take for the long term,” he said.

Impaired assets as a percentage of gross loans were down to 39 basis points, while loan impairment expense was just 10 basis points of gross loans during the half.

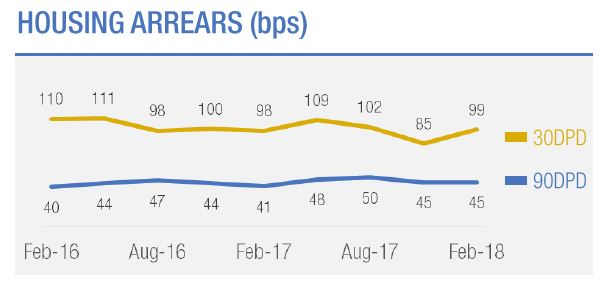
Arrears levels remained benign across all portfolios and there were signs of improvement in the Queensland and Western Australian economies. But they noted an uptick in the most recent quarter in housing …

… and consumer credit.

They also showed potential construction exposure to apartments – at $90m, at 16 developments across 3 states completing 2018 to 2019. They observed this was a well diversified cross-state portfolio.  But $53m is in Victoria.

They also have $100m exposure to the mining sector.

Loan impairment rose, but remained at 10 basis points of GLA. Impaired assets fell a further 10% from 2H17 and new impaired asset volumes also reduced to the lowest level since pre-2012.

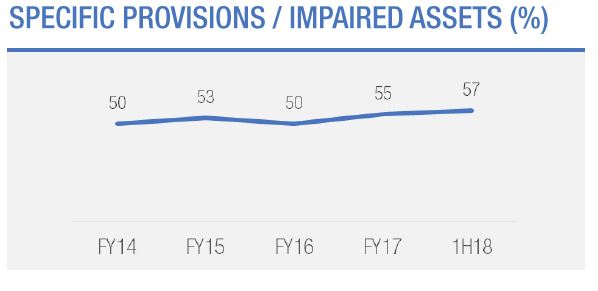
Specific provisions were increased to 57%.

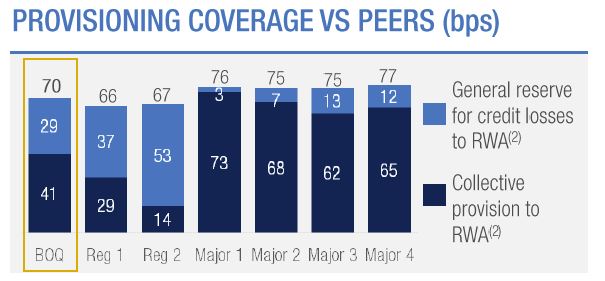
They say total provisions remain strong and provisional coverage compares favorably with peers.

BOQ’s capital position has been maintained. The CET1 ratio was up 3 basis points over the half to 9.42 per cent.

The bank said that the recent Basel and APRA papers suggest BOQ’s current CET1 ratio positions it well for the changes that are coming.

Ahead, they said that the industry was facing a number of headwinds, but BOQ remains well placed.

“The industry faces challenges of low credit growth, low interest rates, regulatory uncertainty, increasing consumer expectations and increased scrutiny of conduct and culture.

“In this environment, our long term strategy remains the right one; we are building out our business bank in higher growth sectors of the economy and opening up new retail channels.

“We also remain focused on our customers, investing in a number of initiatives across the group that will improve our digital offering, bring us closer to our customers and enable us to provide them with a differentiated service offering.

“Our very strong capital position provides us with flexibility to consider options that will deliver the best value to our shareholders,”

FBAA calls for less speculative reporting on broker remuneration

From MPA.

The FBAA has called for “perspective” on broker remuneration amid “unprecedented, unnecessary and crazy” opinions by some ill-informed commentators on the industry.

FBAA executive director Peter White has criticised the number of probes by authorities – including the Productivity Commission, ACCC and Royal Commission – as they `”are falling over each other on their quest for profile.” He also said ASIC itself has only recently conducted a comprehensive review

“I have never seen such craziness around our sector, and this is leading to reactionary comments rather than considered approaches,” he said in a statement.

White pointed out the industry has already been undergoing a process of reform directly with regulators for the past few years to achieve better consumer outcomes.

White believes  “there really is no problem” – It’s just that “these multiple inquiries and statutory bodies have to justify their existence and fat pay packets by kicking someone, and at the moment it’s finance brokers.”

“Let’s keep in mind that consumers are not complaining; we know they are happy with the current system because they are voting with their feet and overwhelmingly choosing brokers,” White added.

White suggests that brokers avoid reacting to quotes coming from bank bosses because their words can easily be edited and used out of context.

He recognizes that banks have raised some eyebrows, but he also points out that their Royal Commission submissions, except for one bank, show support for the existing system. And that doesn’t surprise him because he believes “it’s better for banks, brokers, and borrowers.”

White hopes to hear less speculative reporting, and more rational and informed discussion moving forward.

Investors Still Game, But Weaker Volumes

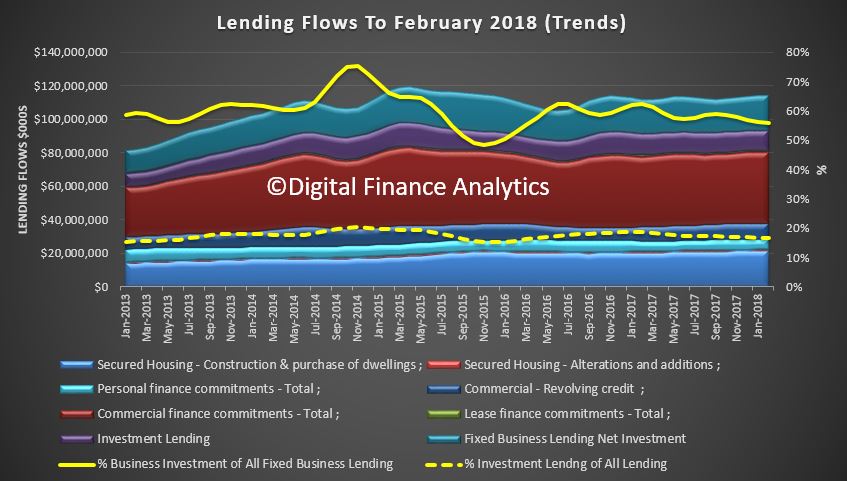
The ABS released their lending finance data today to February 2018. We discuss the results. The Great Credit Binge Is Ending!

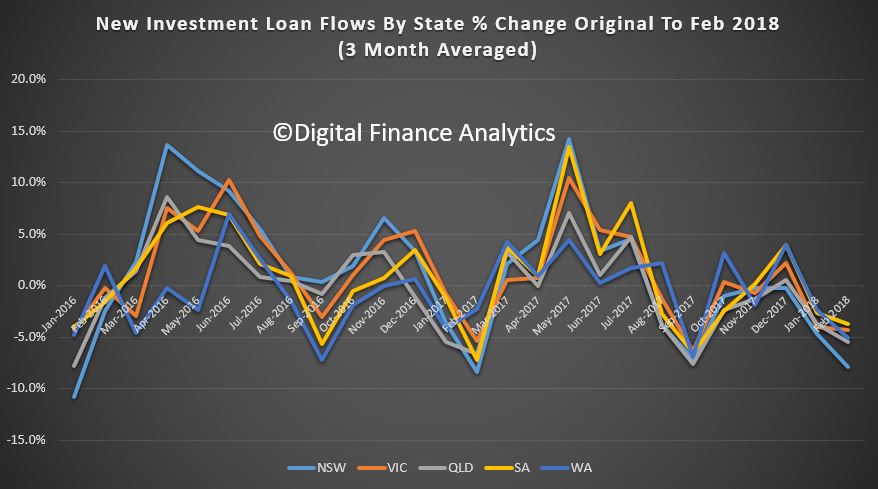
To start at the end of the story, we see significant falls across most states in investment lending flows, with the most significant falls in the Sydney market.

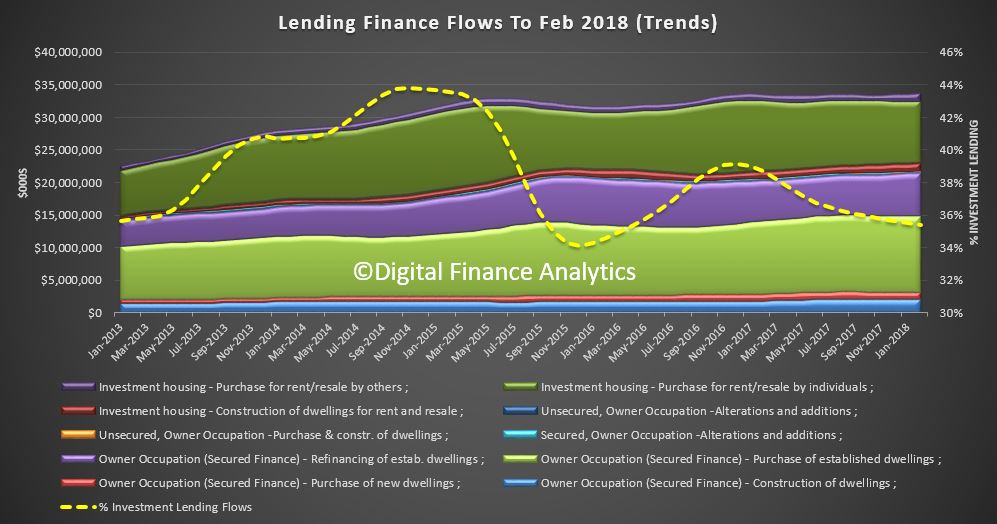
The share of investment flows continues to drift lower, to around 35%. But that is still substantial investment lending!

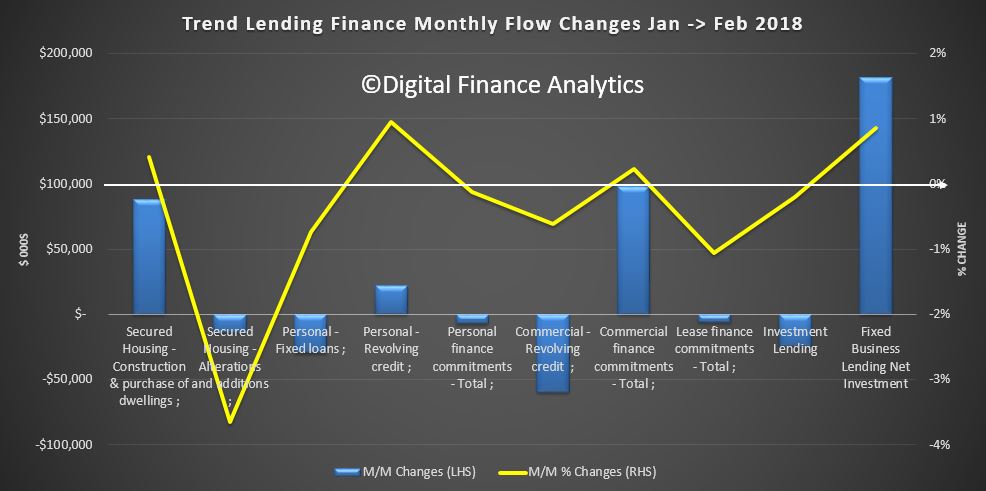
More broadly, the monthly changes from January to February shows the total value of owner occupied housing commitments excluding alterations and additions rose 0.4% in trend terms.

The trend value of total personal finance commitments fell 0.1%. Fixed lending commitments fell 0.7%, while revolving credit commitments rose 1.0%.

The trend value of total commercial finance commitments rose 0.2%. Fixed lending commitments rose 0.5%, while revolving credit commitments fell 0.6%. Within that investment loan flows fell just a little.

The trend series for the value of total lease finance commitments fell 1.1% in February 2018.

Finally, the percentage of investment lending of all lending flows is below 20%, and shows a small fall. But we also see a fall in business lending to around 55%, excluding investment property lending.

Auction Results Show Mainly Lower Volumes

From CoreLogic

There were 1,890 homes taken to auction across the combined capital cities this week, with preliminary results showing a 64.5 per cent success rate. In comparison, 1,839 auctions were held last week and the final clearance rate came in at 62.8 per cent.


Over the same week last year, auction volumes were significantly lower due to the Easter weekend with just 493 homes going under the hammer across the combined capital cities, although the clearance rate was a stronger 73.9 per cent.

2018-04-16--auctionstats


In Melbourne, a preliminary auction clearance rate of 64.3 per cent was recorded across 874 auctions this week, down from 68.2 per cent across 723 auctions last week. Over the same week last year, 102 homes were taken to auction across the city, returning a clearance rate of 81.3 per cent.

Sydney was host to 774 auctions this week, with preliminary results showing a 64.9 per cent success rate, up from 62.9 per cent across 795 auctions last week. This time last year, the clearance rate was a stronger 77.0 per cent across 279 auctions.

2018-04-16--auctionclearancerate


Canberra recorded the highest preliminary clearance rate this week (74.3 per cent), followed by Adelaide (70.6 per cent).

Looking at auction volumes, Melbourne was the only city to see an increase in the number of homes taken to auction this week, while all other cities saw lower volumes week-on-week.

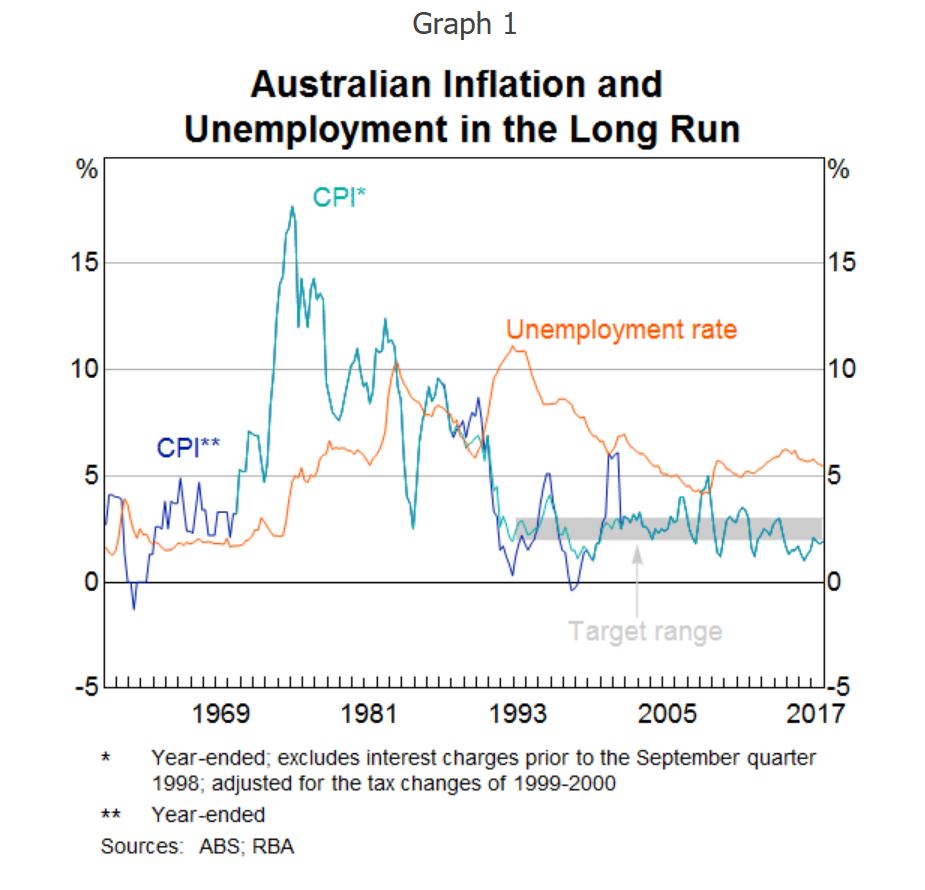
RBA On Inflation Targetting

RBA Deputy Governor Guy Debelle spoke at the RBA Conference 2018 “Twenty-five Years of Inflation Targeting in Australia“.

There are a number of open issues worth considering.  Most obvious is the question of the link between inflation targetting and financial stability.  Would price level targetting offer a better alternative? Some argue this  delivers predictability of the price level over a long horizon. Then there are questions about the correct level to target. More broadly, is it still relevant?

And in addition we would ask, as inflation targetting relies on the CPI dataset, are these telling the full story, or not?

It has been 25 years since Australia adopted an inflation-targeting regime as the framework for monetary policy. At the time of adoption, inflation targeting was in its infancy. New Zealand had announced its inflation target in 1989, followed by Canada and Sweden. The inflation-targeting framework was untested and there was little in the way of academic analysis to provide guidance about the general design and operational principles. Practice was very much ahead of theory.

Now 25 years later, inflation targeting is widely used as the framework for monetary policy. While there are differences in some of the features across countries, the similarities are more pervasive than the differences. And generally, the features of inflation-targeting frameworks have tended to converge over time.

It is interesting to firstly examine how the inflation-targeting framework in Australia has evolved over the 25 years. Secondly, it is also timely to reassess the appropriateness of the regime.

Open Issues

I have argued that the inflation target has delivered macroeconomic outcomes that have been beneficial for the Australian economy. I think a strong case can be made that it has contributed materially to better economic outcomes than the monetary frameworks that preceded it. I have also noted that the framework in Australia has not changed much over the 25 years of its operation, with the notable exception of communication.

So does that mean that the current configuration of the inflation target is the most appropriate or that even that is the most appropriate framework for monetary policy? What changes could be contemplated? Those questions are going to be addressed in other papers at this conference. But let me raise some here and discuss issues worth considering around each of them.

The first is the role of financial stability in an inflation-targeting framework. The Reserve Bank research conference last year considered this issue at some length. As I said earlier, financial stability is now articulated in the Statement on the Conduct of Monetary Policy. I talked about this issue at the Bank of England last year and Ben Broadbent is addressing it at this conference. One question that arises is how the financial stability goal interacts with the inflation target. Is it a separate goal that sets up potential trade-offs or is it aligned with the inflation-targeting goal? In the latter case, a potential reconciliation is the time horizon. When it materialises, financial instability is likely to be detrimental to inflation and unemployment/output: the global recession of 2008 and the subsequent slow recovery in a number of economies bears testament to the potential costs of financial instability (although here in Australia we didn’t experience this to as great an extent). So over some time horizon, potentially quite long, the inflation target and financial stability are aligned. But translating this into monetary policy implications over a shorter time horizon is a large challenge, which still seems to me to be far from resolved.

What about alternative regimes? Price level targeting is one that has been considered in some countries, including Canada, and has been proposed in the academic literature. One argument for a price level target is that it delivers predictability of the price level over a long horizon. It is not clear to me that this is something that is much valued by society. By revealed preference, the absence of long-term indexed contracts suggests that the benefits are not perceived to be high. I struggle to think of what contracts require such a degree of certainty. To me the benefits mostly derive from having inflation at a sufficiently low level that it doesn’t affect decisions. That supports an inflation target rather than a price level target. One important difference is that an inflation target allows bygones to be bygones, whereas a price level target does not. In a world where there are costs to disinflation (and particularly deflation), the likely small gains from the full predictability of the price level that comes with a price level target are not likely to offset the costs of occasional disinflations following positive price level shocks. Another challenge is how fast the price level should be returned to its target level. This presents both a communication and operational challenge as the speed is likely to vary with the size of the deviation.

While the argument at the moment is that a price level target allows the central bank to let the economy grow more strongly after a period of unexpectedly low inflation, again I do not think that practically this will deliver better outcomes than a flexible inflation target. That is an empirical question in the end which is worth testing.

The appropriate level of the inflation target is currently being debated in some parts of the world, including the US. The argument for a higher target rate of inflation is that it might reduce the risk of hitting the zero lower bound because a higher inflation rate would result in a higher nominal interest rate structure. In thinking about this, we should ask the question as to whether what we have seen is the realisation of a tail event in the historical distribution of interest rates (for a given level of the real interest rate).? While this event has now lasted quite a long time, if you thought it was a tail event, then you would expect the nominal rate structure to revert back to its historical mean at some point. If it is a tail event, and the world has just been unlucky enough to have experienced a realisation of that tail event, then there would not obviously be a need to raise the inflation target. We also need to question whether the real interest rate structure has shifted lower permanently, because of permanently lower trend growth say, which would also shift down the nominal rate structure and increase the likelihood of hitting the zero lower bound.

Also, as with price level targeting, in thinking about this question, it needs to be taken into account that it is highly beneficial to have the inflation target at a level where it doesn’t materially enter into economic decision-making. Two to three per cent seems to achieve that. We know that some number higher than a 2–3 per cent rate of inflation will materially enter decision-making, because we have had plenty of experience of higher rates of inflation that demonstrates that. How much higher though, we don’t really exactly know.

Another consideration in answering the question of whether the inflation target is at the right level is the range of policy instruments in the tool kit. Over the past decade, this tool kit has expanded in a number of central banks. For example, we now know that the zero lower bound is not at zero. Asset purchases have been utilised and these have included sovereign paper but also assets issued by the private sector. An assessment of the effectiveness of these instruments is still a work in progress. We also need to think about whether they are part of the standard monetary policy tool kit or whether they should only be broken out in case of emergency.

Nominal income targeting is another alternative regime to inflation targeting. I am not convinced that flexible inflation targeting of the sort practiced in Australia is significantly different from nominal income targeting in most states of the world. I also think that there are some quite significant communication challenges with nominal income targeting. Firstly, nominal income is probably more difficult to explain to people than inflation. Secondly, as a very practical matter, nominal income is subject to quite substantial revisions, which poses difficulties both operationally and again in communicating with the public.

Finally, one criticism of inflation targeting more generally is that central banks are fighting the last war. The fact that for a number of years now, inflation globally has been stubbornly low is not obviously the signal to declare victory over inflation and move on. Indeed, the declaration of victory may well be the signal that hostilities are about to resume and that inflation will shift up again. Moreover, even if victory can be declared that doesn’t mean you should go off to fight another war in another place without securing the peace. Inflation targeting can help secure the peace.

Online SME lending growing at 79%, could hit $2B by 2020

The online small business lending market in Australia is growing at a faster rate than the US market did at a similar stage of development and could reach over $2 billion in annual originations by 2020, Noah Breslow, OnDeck Global CEO told the AltFi Australasian Summit in Sydney.

“Having grown at a compound annual growth rate of 151% since 2013, we expect to see continued strong growth in the coming years” Noah Breslow said.

Mr. Breslow said that despite over 6,000 banks offering small business lending options in the US, online lending to small businesses has flourished.

“When you compare that to Australia with a more concentrated banking system, there is even more opportunity for online lenders to provide innovative lending solutions to SMEs” he said.

Research shows Australia has overtaken Japan to become the second largest alternative finance player in the Asia Pacific region, second only to China.

“In addition, increased access to data, supportive government initiatives and favourable small business sentiment are all likely to lead to further growth for the industry.

Furthermore, the Government’s ‘Review into Open Banking’ and the introduction of mandatory comprehensive credit reporting (CCR) will likely promote greater competition in the Australian market,” Mr. Breslow said.

Awareness still an issue

Yet despite the Australian market’s growth potential, awareness of alternative finance sources still remains an issue, according to OnDeck’s latest Small Business Owners’ (SBO) Survey, commissioned by research firm YouGov Galaxy.

“Our research shows that despite increasing competition in the Australian alternative finance space, only 30% of small business owners think the number of lending options has increased in the last five years, compared to 70% in the US,” Mr. Breslow said.

The majority of small businesses have been heavily reliant on traditional banks (63%), followed by specialist financiers (29%), credit unions (27%) and family/friends (27%) to source finance.

The research also found signs of unmet demand, with 55% of business owners having been rejected for financing they requested. Difficulties with accessing finance affected the delivery of products and services (37%) and caused layoffs or issues with hiring new employees (32%).

When it comes to future borrowing plans, 33% of Australian SBOs planning to seek additional finance for their business indicated that they would consider an online lender.

“There is a real opportunity for the online SME lending industry to increase awareness of the innovative products and services that are now available, as an alternative to the traditional loans offered by banks.”

OnDeck in Australia

“After pioneering online small business lending more than ten years ago in the US, it is encouraging to see many markets globally adopting similar alternative financing solutions.

For OnDeck, Australia is an exciting market to be operating in and we’re thrilled with the results so far.”

OnDeck entered the Australian market in 2015 via a partnership with MYOB, a leading accountancy software provider, to help close the funding gap between small business financing needs and the availability of capital from traditional sources. The business is also working with brokers and aggregators, including Connective Asset Finance and College Capital.

Globally, OnDeck has delivered more than USD $8 billion in loans to 80,000 small businesses in 700 different industries

Shadow profiles – Facebook knows about you, even if you’re not on Facebook

From The Conversation.

Facebook’s founder and chief executive Mark Zuckerberg faced two days of grilling before US politicians this week, following concerns over how his company deals with people’s data.

But the data Facebook has on people who are not signed up to the social media giant also came under scrutiny.

During Zuckerberg’s congressional testimony he claimed to be ignorant of what are known as “shadow profiles”.

Zuckerberg: I’m not — I’m not familiar with that.

That’s alarming, given that we have been discussing this element of Facebook’s non-user data collection for the past five years, ever since the practice was brought to light by researchers at Packet Storm Security.

Maybe it was just the phrase “shadow profiles” with which Zuckerberg was unfamiliar. It wasn’t clear, but others were not impressed by his answer.

Facebook’s proactive data-collection processes have been under scrutiny in previous years, especially as researchers and journalists have delved into the workings of Facebook’s “Download Your Information” and “People You May Know” tools to report on shadow profiles.

Shadow profiles

To explain shadow profiles simply, let’s imagine a simple social group of three people – Ashley, Blair and Carmen – who already know one another, and have each others’ email address and phone numbers in their phones.

If Ashley joins Facebook and uploads her phone contacts to Facebook’s servers, then Facebook can proactively suggest friends whom she might know, based on the information she uploaded.

For now, let’s imagine that Ashley is the first of her friends to join Facebook. The information she uploaded is used to create shadow profiles for both Blair and Carmen — so that if Blair or Carmen joins, they will be recommended Ashley as a friend.

Next, Blair joins Facebook, uploading his phone’s contacts too. Thanks to the shadow profile, he has a ready-made connection to Ashley in Facebook’s “People You May Know” feature.

At the same time, Facebook has learned more about Carmen’s social circle — in spite of the fact that Carmen has never used Facebook, and therefore has never agreed to its policies for data collection.

Despite the scary-sounding name, I don’t think there is necessarily any malice or ill will in Facebook’s creation and use of shadow profiles.

It seems like a earnestly designed feature in service of Facebooks’s goal of connecting people. It’s a goal that clearly also aligns with Facebook’s financial incentives for growth and garnering advertising attention.

But the practice brings to light some thorny issues around consent, data collection, and personally identifiable information.

What data?

Some of the questions Zuckerberg faced this week highlighted issues relating to the data that Facebook collects from users, and the consent and permissions that users give (or are unaware they give).

Facebook is often quite deliberate in its characterisations of “your data”, rejecting the notion that it “owns” user data.

That said, there are a lot of data on Facebook, and what exactly is “yours” or just simply “data related to you” isn’t always clear. “Your data” notionally includes your posts, photos, videos, comments, content, and so on. It’s anything that could be considered as copyright-able work or intellectual property (IP).

What’s less clear is the state of your rights relating to data that is “about you”, rather than supplied by you. This is data that is created by your presence or your social proximity to Facebook.

Examples of data “about you” might include your browsing history and data gleaned from cookies, tracking pixels, and the like button widget, as well as social graph data supplied whenever Facebook users supply the platform with access to their phone or email contact lists.

Like most internet platforms, Facebook rejects any claim to ownership of the IP that users post. To avoid falling foul of copyright issues in the provision of its services, Facebook demands (as part of its user agreements and Statement of Rights and Responsibilites) a:

…non-exclusive, transferable, sub-licensable, royalty-free, worldwide license to use any IP content that you post on or in connection with Facebook (IP License). This IP License ends when you delete your IP content or your account unless your content has been shared with others, and they have not deleted it.

Data scares

If you’re on Facebook then you’ve probably seen a post that keeps making the rounds every few years, saying:

In response to the new Facebook guidelines I hereby declare that my copyright is attached to all of my personal details…

Part of the reason we keep seeing data scares like this is that Facebook’s lacklustre messaging around user rights and data policies have contributed to confusion, uncertainty and doubt among its users.

It was a point that Republican Senator John Kennedy raised with Zuckerberg this week (see video).

Senator John Kennedy’s exclamation is a strong, but fair assessment of the failings of Facebook’s policy messaging.

After the grilling

Zuckerberg and Facebook should learn from this congressional grilling that they have struggled and occasionally failed in their responsibilities to users.

It’s important that Facebook now makes efforts to communicate more strongly with users about their rights and responsibilities on the platform, as well as the responsibilities that Facebook owes them.

This should go beyond a mere awareness-style PR campaign. It should seek to truly inform and educate Facebook’s users, and people who are not on Facebook, about their data, their rights, and how they can meaningfully safeguard their personal data and privacy.

Given the magnitude of Facebook as an internet platform, and its importance to users across the world, the spectre of regulation will continue to raise its head.

Ideally, the company should look to broaden its governance horizons, by seeking to truly engage in consultation and reform with Facebook’s stakeholders – its users — as well as the civil society groups and regulatory bodies that seek to empower users in these spaces.

Author : Andrew Quodling PhD candidate researching governance of social media platforms, Queensland University of Technology