Why Are Interest Rates So Low? – Blame Central Banks

Current statements from central bankers around the world argue that current low real interest rates reflect a change in the “neutral” rate, and is linked to demographic shifts, investment patterns and globalisation.  In other words, monetary policy is NOT to blame – they are simply reacting.

However, an interesting (and complex) working paper Why so low for so long? A long-term view of real interest rates?  from the Bank for International Settlement raises serious questions about the assumption which Central Banks are working with. In fact, their analysis suggests that monetary policy is the cause of the low rates, not a reaction to them and this has long range impact. This turns current thinking on its head. Central Bankers policy have driven rates lower!

Global real (inflation-adjusted) interest rates, short and long, have been on a downward trend throughout much of the past 30 years and have remained exceptionally low since the Great Financial Crisis (GFC). This has triggered a debate about the reasons for the decline. Invariably, the presumption is that the evolution of real interest rates reflects changes in underlying saving-investment determinants. These are seen to govern variations in some notional “equilibrium” or natural real rate, defined as the real interest rate that would prevail when actual output equals potential output, towards which market rates gravitate.

Prevailing explanations of the decline in real interest rates since the early 1980s are premised on the notion that real interest rates are driven by variations in desired saving and investment.

But based on data stretching back to 1870 for 19 countries, our systematic analysis casts doubt on this view. The link between real interest rates and saving-investment determinants appears tenuous. While it is possible to find some relationships consistent with the theory in some periods, particularly over the last 30 years, they do not survive over the extended sample. This holds both at the national and global level. By contrast, we find evidence that persistent shifts in real interest rates coincide with changes in monetary regimes. Moreover, external influences on countries’ real interest rates appear to reflect idiosyncratic variations in interest rates of countries that dominate global monetary and financial conditions rather than common movements in global saving and investment. All this points to an underrated role of monetary policy in determining real interest rates over long horizons.

Overall, our results raise questions about the prevailing paradigm of real interest rate determination. The saving-investment framework may not serve as a reliable guide for understanding real interest rate developments. And inflation may not be a sufficiently reliable signal of where real interest rates are relative to some unobserved natural level. Monetary policy, and financial factors more generally, may have an important bearing on persistent movements in real interest rates.

Note: BIS Working Papers are written by members of the Monetary and Economic Department of the Bank for International Settlements, and from time to time by other economists, and are published by the Bank. The papers are on subjects of topical interest and are technical in character. The views expressed in them are those of their authors and not necessarily the views of the BIS.


ANZ Bank New Zealand’s Sale of UDC Finance Blocked

ANZ Bank New Zealand has been informed that New Zealand’s Overseas Investment Office has declined HNA Group’s application to acquire UDC Finance.

ANZ Bank Group Executive and New Zealand CEO David Hisco said: “While the sale agreement between the parties remains in place, unless HNA successfully overturns the OIO decision, the sale will not proceed.

“We don’t know if HNA will attempt to overturn the decision.

“If the sale does not proceed, we’ll assess our strategic options regarding the future of UDC. It’s a great business and there is no immediate requirement to do anything, particularly given the strength of ANZ’s capital position.

“UDC continues to be a highly profitable and strong business, with great staff and customers, and a growing loan portfolio across a range of industries.

“UDC’s focus remains on its core business of financing vehicles and equipment for people and companies across New Zealand. So, it will be business as usual for our staff and customers.”

This OIO decision has no impact on the recently announced $AUD1.5 billion on-market buy back of ANZ Banking Group shares.

The UDC transaction proceeds are equivalent to ~10 basis points of APRA CET1 capital. If the transaction does not go ahead, ANZ’s FY18 earnings will no longer be adjusted for the sale. The transaction summary detail was included in the ANZ Banking Group News Release of 11 January 2017.

Bank Stress Testing Is Maturing But Diverse

The Basel Committee’s Working Group on Stress Testing has published a 66 page report “Supervisory and bank stress testing: range of practices“. APRA is mentioned several times through the report, most notably about the limited disclosure of results here, compared with some other countries. Also the scope and purpose of these tests vary considerably, and the extensions into macroprudential differs.  So the approach, and outputs of stress testing are very different.

The report sets out a range of observed supervisory and bank stress testing practices with the aim of describing and comparing these practices and highlighting areas of evolution. The level of data reported on supervisory stress tests reflects the differing objectives and areas of focus across supervisors.

It draws on the results of two surveys completed during 2016: (i) a survey completed by Basel Committee member authorities (banking supervisors and central banks), which had participation of 31 authorities from 23 countries; and (ii) a survey completed by 54 respondent banks from across 24 countries, including 20 global systemically important banks (G-SIBs). Case studies, and other supervisory findings.

There are two fundamental types of supervisory stress tests: (1) those in which the supervisors collect data from the firms and then use their own models and scenarios to assess the performance of the firms under stress (referred to in this report as either “supervisor-run” or “top-down” tests), and (2) those in which the supervisors issue scenarios and guidance to the firms, which then run their own models and report the results to the supervisor (the “institution-run” or “bottom-up” tests).

A number of authorities now use stress tests specifically for capital adequacy assessment or to inform macroprudential policies such as the countercyclical capital buffer. In some cases, stress testing frameworks aim to address multiple objectives. For example, in Canada the macroprudential stress test outcomes inform ongoing supervisory work, such as capital adequacy assessments and risk identification, prioritisation, and measurement, as well as financial stability policy initiatives. Stress testing can also be used to facilitate communication with relevant domestic and foreign parties regarding the stability of the financial system.

In the US, supervisory estimates of post-stress capital ratios for each bank under adverse and severely adverse economic and financial conditions are publicly released along with detailed information on losses and revenues. In the EU, for all regular EU-wide stress test exercises hitherto, the EBA Board of Supervisors decided to publish the quantitative results at the bank-level and provide comprehensive granular data for several types of portfolios on a regular basis (eg sovereign portfolios and risk weights from internal models).

In contrast, for a number of countries, only aggregate-level results are published; often this is in the context of an FSAP review. For example, the Australian Prudential Regulation Authority (APRA) has traditionally disclosed only the aggregate results.

APRA do not impose capital requirements directly based on stress test results, but see stress testing as a strong tool to inform supervisors’ judgments of capital adequacy. Stress testing is also expected to be reflected in banks’ capital decisions, helping banks to set target surplus thresholds and fostering greater understanding of the dynamics between capital and risk.

APRA has used stress tests results to evaluate the adequacy of banks’ recovery planning. In particular, a bank’s management actions in a stress test scenario should be consistent with and linked closely to a bank’s recovery plan in order to be credible.

In 2014 and again in 2017, the Australian and New Zealand supervisory authorities completed a coordinated banking industry stress test. Although both countries had worked together for previous banking industry stress tests, the level of engagement increased in 2014 with close coordination and collaboration on scenario design, templates, analysis and outcomes.

There is a strong link between the banking sectors in Australia and New Zealand; the four major Australian banks have significant exposures to New Zealand and their subsidiaries dominate the New Zealand banking system.

APRA was responsible for the overall coordination and execution of the stress test. There was a common scenario and set of reporting templates covering Australia and New Zealand. Timing of all stages was closely coordinated. The Reserve Bank of New Zealand (RBNZ) provided challenge and input into the scenario and determined the specific economic parameters for New Zealand, which focused on additional agricultural risks. The RBNZ was responsible for analysing the results for New Zealand banks. Each authority engaged directly with the banks within their jurisdiction on queries and feedback throughout the process.

Ongoing engagement and communication was critical to the success of the exercise. Particular consideration was given to issues that differed between the two jurisdictions. At the highest level this involved ensuring that the economic parameters between Australia and New Zealand were realistic and consistent in a stressed environment. For example, there was discussion and challenge as to the relationship between interest rates in Australia and a corresponding level for interest rates in New Zealand.

Here is a summary of their overall observations:

  • In recent years, there has been significant advancement and evolution in stress testing methodologies and infrastructure at both banks and authorities.
  • Supervisory authorities and central banks continue to devote more resources to enhance the stress testing of regulated institutions, with most supervisory stress testing exercises being carried out on at least an annual basis. This is resulting in significant progress in how the exercises are performed and how they are incorporated into the banking supervision process.
  • Banks have been making improvements to their governance structures, with banks’ boards, or delegated committees of boards, taking active roles in reviewing and challenging the results of stress tests, in addition to providing oversight of the overall framework.
  • Banks are increasingly looking to leverage the resources dedicated to stress testing frameworks to inform the risk management and strategic planning of the bank. Stress testing frameworks are increasingly integrated into business as usual processes.
  • Key challenges that remain for banks include finding and maintaining sufficient resources to run stress testing frameworks, and improving data quality, data granularity and the systems needed to efficiently aggregate data from across the banking group for use in stress tests. For national authorities, greater coordination of stress testing activities across authorities is needed, eg via the exchange information on stress test plans and results through supervisory colleges.

Microprudential use of supervisory stress tests

  • Supervisory stress test results are primarily used by supervisory authorities for reviewing and validating the Internal Capital Adequacy Assessment Process (ICAAP) of banks and their liquidity adequacy assessments.
  • Since the global financial crisis, an increasing number of countries assess capital ratio levels under adverse scenarios and use the resulting assessment for evaluating capital adequacy or required capital. However, a wide variety of practices exist.
  • Certain supervisor set capital add-ons for banks by using rules-based methods based solely on stress tests (eg by benchmarking against formal hurdle rates). Those authorities which require add-ons based on stress tests mostly employ a combination of formal process and supervisory judgment. A few jurisdictions have a more rules-based treatment.
  • It is less common for supervisors to use outputs from stress tests for other purposes than those related to capital/liquidity assessments. Nevertheless, some supervisors review and challenge banks’ business plans or banks’ recovery plans on the basis of stress test findings.

Macroprudential use of supervisory stress tests

  • Stress tests are increasingly used to calibrate macroprudential measures and supervisory policy changes. Other macroprudential uses are early warning exercises to identify potential weaknesses of the system and enhance crisis management plans.
  • Macroprudential stress tests are increasing in importance as a way of assessing the financial resilience of banking systems, as they can allow for a more direct assessment of feedback loops, amplification mechanisms and spillovers. These important effects are most frequently assessed via top down approaches.


Mobile Apps Can Be a Double-edged Sword

From The Conversation.

Intense retail competition has led old standbys, such as Sears, to close dozens of stores. Walmart is venturing online more. And Amazon is expanding offline, opening stores and buying Whole Foods. The fight for retail dollars is fierce, and the battleground will soon migrate into the palms of customers’ hands – via apps on their smartphones.

This isn’t just happening with mega-retailers. Moviechains and pet supply stores are increasingly connecting with their customers through their own branded apps. Zumiez, a specialty clothing chain with 600 stores in the U.S., has an app. Scooter’s Coffee, an Omaha-based coffee chain with 200 stores, has one too. So does New York Pizza Oven, a single pizza parlor in Vermont.

Mobile apps are becoming key ways for customers and retailers to interact. Our recent analysis of data from a large U.S. retailer of video games and electronics (whose name we agreed to keep confidential) found that apps can even affect consumers’ offline buying habits.

Growth in use – and spending

The number of people who have the option to use mobile apps is skyrocketing. More than 70 percent of the world population will own a smartphone by 2020. And they’ll spend more than 80 percent of their on-phone time using task-specific apps.

Is there no line because people are ordering ahead on their mobile phones? jessicakirsh/Shutterstock.com

Letting buyers learn about products, discover deals, locate nearby stores and even place orders in advance is a huge business opportunity. At Starbucks, for example, an app allowing people to order and pay on the go – just swinging into the store for pickup – helped customers avoid standing in line and waiting: Over five years, 20 percent of its sales shifted to online transactions.

Research has also begun to show that people who use mobile shopping apps buy more than they might otherwise. After individual shoppers started purchasing using eBay’s mobile app, their purchases from eBay’s website increased. Similarly, a tablet app from major Chinese e-tailer Alibaba led customers to spend about US$923.5 million more each year with the company than they would have without the app. Some of that increased spending is from shoppers using the app to buy impulsively – making one-off purchases of items they are interested in, or adding items to larger orders.

Our research recently found a new dimension to this app-related spending boost. Over 18 months, customers who downloaded the branded app of the retailer we studied spent 30 percent more in stores than they would have without the app. We can infer this by looking at data on customers’ spending before and after the app was installed, and by comparing that to the spending of a random sample of customers who had similar demographics and shopping behavior before the app launched.

We learned that most of the increase was because customers used the app to find out about products before buying them. For example, by closely analyzing the data on app use and purchases, we could see these customers started increasing purchases of lesser known video games when they started using the app.

App users return products more

While shoppers who use a retailer’s mobile app tend to buy more online and in stores, we find that they are also more prone to subsequently returning the products they purchased.

In particular, customers who use a retailer’s app tend to return products most often when they purchased those products on discount, and within seven days of making the original purchase. Apps often make it easier to purchase items on impulse. When customers receive some of the items and are dissatisfied, they regret the decisions and return the items.

Even taking into account the high rate of returns, app users spend more both online and in physical stores. But that’s when the apps work as customers expect them to.

App failures –- and consequences

Apps that load information slowly or crash frequently can deter not only online purchasing, but in-person spending, too. Surveys show that more than 60 percent of users expect an app to load within four seconds. And our ongoing research suggests that more than half of users will abandon an app that freezes or crashes frequently.

App slowdowns can be costly. One estimate suggests that if each Amazon webpage took just one second longer to load, the company’s sales could drop as much as $1.6 billion a year. For smaller retailers, a similar drop of 2 to 3 percent would be a smaller dollar amount but still a significant blow.

Our ongoing research with Stanford’s Sridhar Narayanan suggests that poor app performance reduces users’ in-store spending too. Specifically, we studied how shoppers react when an app is not accessible for five or six hours, due (users were told) to a server error. Our preliminary results suggest that in the following two weeks, those shoppers spent 3 to 4 percent less in stores than they would have otherwise. Less-frequent customers reduced their spending even more than the company’s more regular shoppers.

Unnati Narang discusses her ongoing research on failures in mobile shopping apps.

Interestingly, customers who experience app failures spend less in stores, but their online spending remains unchanged. A deeper analysis indicates that when a retailer’s app fails, shoppers often go to the retailer’s website to complete their intended transactions. But the negative experience from app failure discourages them from buying more in the retailer’s store.

Our research illustrates some ways mobile apps can be a double-edged sword for customers and retailers alike. Shoppers can use apps to learn more about prospective purchases, be inspired on the fly and save time at the cash register. But if the software fails, they may be frustrated, discouraged and even spend less at physical stores. Retailers can see increased sales and faster transactions, but may have to handle more returns – though they’ll still make more money. The longer-term effects of mobile apps on the retail business have yet to be seen, of course, but in an ever-changing landscape, companies and customers alike will be exploring the options.

Authors: Venkatesh Shankar, Professor of Marketing; Director of Research, Center for Retailing Studies, Texas A&M University; Unnati Narang, Ph.D. student in Business Administration (Marketing), Texas A&M University


GOP tax plan doubles down on policies that are crushing the middle class

From The Conversation.

The U.S. middle class has always had a special mystique.

It is the heart of the American dream. A decent income and home, doing better than one’s parents, and retiring in comfort are all hallmarks of a middle-class lifestyle.

Contrary to what some may think, however, the U.S. has not always had a large middle class. Only after World War II was being middle class the national norm. Then, starting in the 1980s, it began to decline.

President Donald Trump has portrayed the tax plan Congress is wrapping up as a boon for the middle class. The sad reality, however, is that it is more likely to be its final death knell.

To understand why, you need look no further than the history of the rise and decline of the American middle class, a group that I’ve been studying through the lens of inequality for decades.

The middle class rises

The middle class, which Pew defines as two-thirds to two times the national median income for a given household size, began to grow after World War II due to a surge in economic growth and because President Franklin Delano Roosevelt’s New Deal gave workers more power. Before that, most Americans were poor or nearly so.

For example, legislation such as the Wagner Act established rights for workers, most critically for collective bargaining. The government also began new programs, such as Social Security and unemployment insurance, that helped older Americans avoid dying in poverty and supported families with children through tough times. The Home Owners’ Loan Corporation, set up in 1933, helped middle-class homeowners pay their mortgages and remain in their homes.

Together, these new policies helped fuel a strong postwar economic boom and ensured the gains were shared by a broad cross-section of society. This greatly expanded the U.S. middle class, which reached a peak of nearly 60 percent of the population in the late ‘70s. Americans’ increased optimism about their economic future prompted businesses to invest more, creating a virtuous cycle of growth.

Government spending programs were paid for largely with individual income tax rates of 70 percent (and more) on wealthy individuals and high taxes on corporate profits. Companies paid more than one-quarter of all federal government tax revenues in the 1950s (when the top corporate tax was 52 percent). Today they contribute just 5 percent of government tax revenues.

Despite high taxes on the rich and on corporations, median family income (after accounting for inflation) more than doubled in the three decades after World War II, rising from $27,255 in 1945 to nearly $60,000 in the late 1970s.

The fall begins

That’s when things started to change.

Rather than supporting workers – and balancing the interests of large corporations and the interests of average Americans – the federal government began taking the side of business over workers by lowering taxes on corporations and the rich, reducing regulations and allowing firms to grow through mergers and acquisitions.

Since the late 1980s, median household incomes (different from family incomes because members of a household live together but do not need to be related to each other) have increased very little – from $54,000 to $59,039 in 2016 – while inequality has risen sharply. As a result, the size of the middle class has shrunk significantly to 50 percent from nearly 60 percent.

One important reason for this is that starting in the 1980s the role of government changed. A key event in this process was when President Ronald Reagan fired striking air-traffic control workers. It marked the beginning of a war against unions.

The share of the labor force that is organized has fallen from 35 percent in the mid-1950s to 10.7 percent today, with the largest drop taking place in the 1980s. It is not a coincidence that the share of income going to earners in the middle fell at the same time.

In addition, Reagan cut taxes multiple times during his time in office, which led to less spending to support and sustain the poor and middle class, while deregulation allowed businesses to cut their wage costs at the expense of workers. This change is one reason workers have received only a small fraction of their greater productivity in the form of higher wages since the 1980s.

Meanwhile, the real buying power of the minimum wage has been allowed to erode since the 1980s due to inflation.

While the middle class got squeezed, the very rich have done very well. They have received nearly all income gains since the 1980s.

In contrast, household median income in 2016 was only slightly above its level just before the Great Repression began in 2008. But according to new unpublished research I conducted with Monmouth University economist Robert Scott, the actual living standard for the median household fell as much as 7 percent due to greater interest payments on past debt and the fact that households are larger, so the same income does not go as far.

As a result, the middle class is actually closer to 45 percent of U.S. households. This is in stark contrast to other developed countries such as France and Norway, where the middle class approaches nearly 70 percent of households and has held steady over several decades.

The Republican tax plan

So how will the tax plan change the picture?

France, Norway and other European countries have maintained policies, such as progressive taxes and generous government spending programs, that help the middle class. The Republican tax package doubles down on the policies that have caused its decline in the U.S.

Specifically, the plan will significantly reduce taxes on the wealthy and large companies, which will have to be paid for with large spending cuts in everything from children’s health and education to unemployment insurance and Social Security. Tax cuts will require the government to borrow more money, which will push up interest rates and require middle-income households to pay more in interest on their credit cards or to buy a car or home.

The benefits of the Republican tax bill go primarily to the very wealthy, who will get 83 percent of the gains by 2027, according to the Tax Policy Center, a nonpartisan think tank.

Meanwhile, more than half of poor and middle-income households will see their taxes rise over the next 10 years; the rest will receive only a small fraction of the total tax benefits.

Trump touts the GOP tax plan with a group of ‘middle-class families.’ Reuters/Kevin Lamarque

From virtuous to vicious

While Republicans justify their tax plan by claiming corporations will invest more and hire more workers, thereby raising wages, companies have already indicated that they will mainly use their savings to buy back stock and pay more dividends, benefiting the wealthy owners of corporate stock.

So with most of the gains of the $1.5 trillion in net tax cuts going to the rich, the end result, in my view, is that most Americans will face falling living standards as government spending goes down, borrowing costs go up, and their tax bill rises.

This will lead to less economic growth and a declining middle class. And unlike the virtuous circle the U.S. experienced in the ‘50s and ’60s, Americans can expect a vicious cycle of decline instead.

Author: Steven Pressman, Professor of Economics, Colorado State University

Update on Banking Royal Commission

The royal commission into the banking, superannuation and financial services industry official web site is operational, and you can subscribe for alerts there. The letters patient can also be found there which officially establishes the commission and it’s scope of inquiry. Intermediaries, such as mortgage brokers and financial advisers are included in the broad scope. The interim report is due no later than 30 September 2018.  The final report is due no later than 1 February 2019. The commission will be based in Melbourne.

A notice requiring banks, insurance companies and superannuation funds to detail all cases of misconduct from 2008 onwards has also been issued.

Investor Daily, says:

The Governor-General has issued the letters patent to former High Court judge Kenneth Madison Hayne AC QC formally establishing the royal commission into the banking, superannuation and financial services industry.

The letters patent requires the royal commission to inquire into the conduct of financial services entities, including “banks, insurers, superannuation trustees, holders of Australian financial services licences and intermediaries, such as mortgage brokers”.

In a joint statement, Treasurer Scott Morrison and outgoing Attorney-General George Brandis said commissioner Hayne has been authorised to submit an interim report to the Governor-General “no later than 30 September 2018”.

The final report of the royal commission must be submitted by commissioner Hayne “no later than 1 February 2019”.

“The financial system plays an important role in the lives of all Australians and we encourage all interested parties to engage with the royal commission,” the joint statement said.

US Financial Stability In The Spotlight

The US Financial Stability Oversight Council has published their 2017 Annual Report. Their mandate under the Dodd-Frank Act is to identify risks to the financial stability of the US, promote market discipline and respond to emerging threats. At more than 150 pages, its is a long read, but well worth the effort. Also compare and contrast with the high household debt levels here!

A couple of things caught my attention. First, the rise in the 2-Year Treasury Bonds, as rate are normalized.   Rates are in their way up.
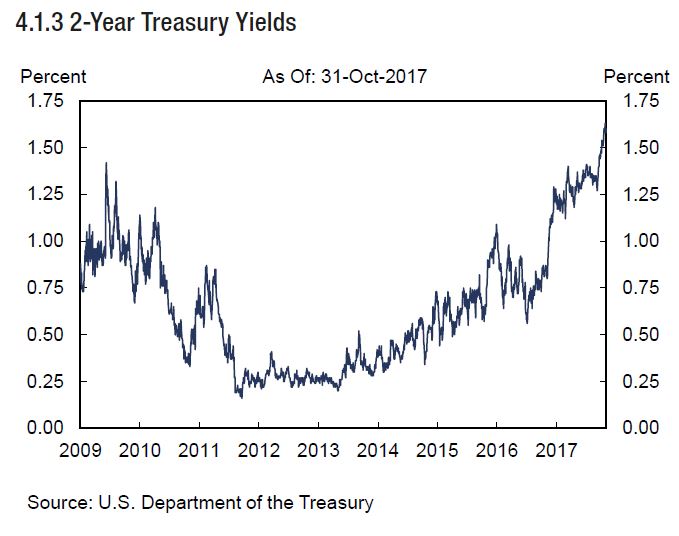
Yields on 2-year Treasury notes fell in the first half of 2016, reaching a low of 0.56 percent in July before reversing course (Chart 4.1.3). The 2-year Treasury yield has since risen 104 basis points to 1.60 percent, as of October 2017. The Federal Open Market Committee (FOMC) raised its target range for the federal funds rate 25 basis points four times since December 2016. Also, in October 2017, the Federal Reserve began normalizing its balance sheet.

Next, household debt to disposable income is around 100%, significantly lower than Australian households, and on a very different trajectory.
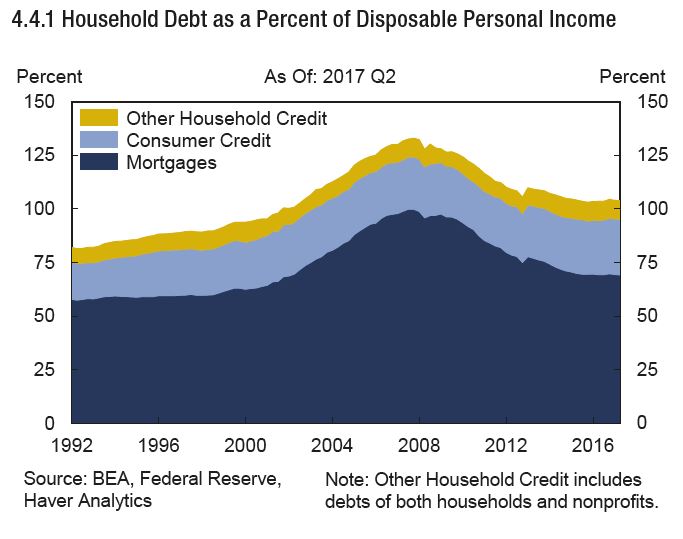
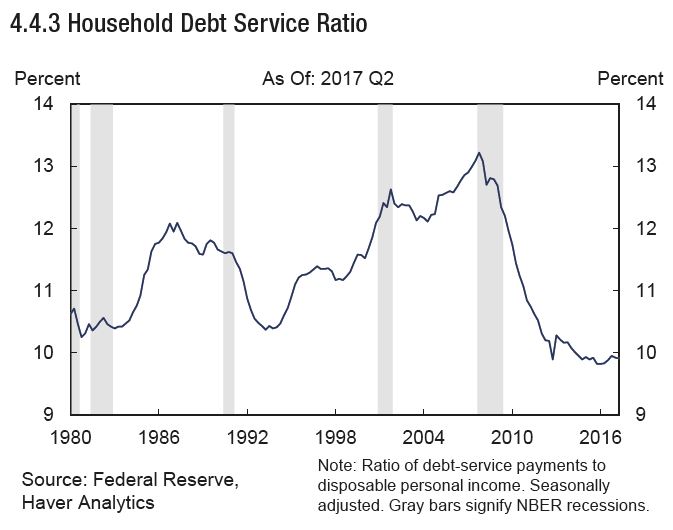
There has been significant growth in auto loans and student loans, compared with mortgage debt.  But the household debt service ratio is lower than here, a low interest rates helped keep the debt service ratio—the ratio of debt service payments to disposable personal income—unchanged in 2016 and the first half of 2017, near a 30-year low (Chart 4.4.3). Although the ratio of debtservice payments to disposable personal income for consumer credit has edged steadily upward since 2012, this trend has been fully offset by a decrease in the service ratio of mortgage debt.
Finally loan delinquency is lower now than back in 2009.
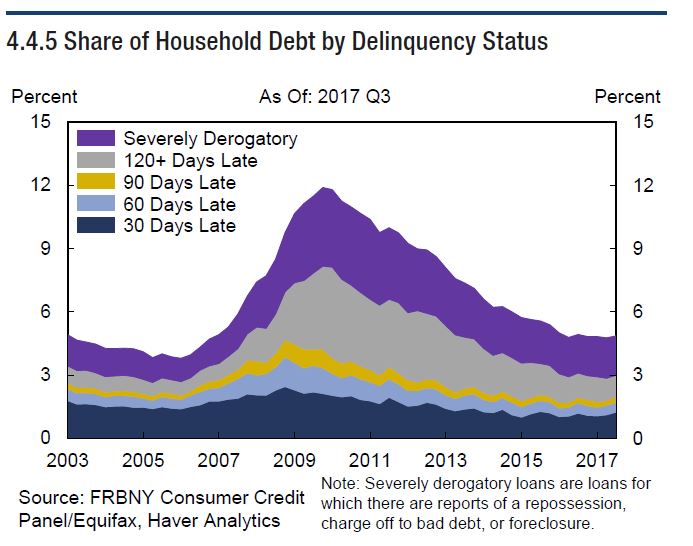
Continued decreases in delinquency rates on home equity lines of credit (HELOCs) and mortgage debt pushed household debt delinquencies to less than 5 percent, the lowest year-end level since 2006 (Chart 4.4.5).  Decreased overall delinquency among subprime borrowers, continued write-downs of mortgage debt accumulated during the pre-crisis housing bubble, and a shift from subprime to prime mortgage balances drove the decline. The delinquency rate on student loans remained unchanged at 11 percent over the past few years after nearly doubling between 2003 and 2013. Despite elevated delinquency rates on student loans, default risk is generally limited for private lenders, since the federal government owns or guarantees most student loan debt outstanding. Signs of stress have emerged in auto lending in recent years, driven by increased subprime borrower delinquency. In the second quarter of 2017, auto loan balances that were delinquent for at least 90 days reached 3.9 percent of total auto loan balances, up from 3.3 percent three years prior. In recent quarters, credit card delinquency rates have increased slightly, and the percent of credit card loans that were delinquent for at least 90 days increased to 4.4 percent, compared to 3.7 percent three years prior. Despite this trend, the balance of credit card debt that was delinquent for at least 90 days has remained relatively stable at 7.4 percent in the second quarter of 2017, compared to 7.8 percent three years prior.

They discussed some highly relevant issues:

Managing Vulnerabilities in an Environment of Low, but Rising, Interest Rates – In previous annual reports, the Council identified vulnerabilities that arise from a prolonged period of low interest rates. In particular, as investors search for higher yields, some may add assets with higher credit or market risks to their portfolios. They may also use more leverage or rely on shorter-term funding. These actions tend to raise the overall level of financial risk in the economy and may put upward pressure on prices in certain markets. If prices in those markets were to fall sharply, owners could face unexpectedly large declines in their overall portfolio value, potentially creating conditions of financial instability. Although both short-term and long-term interest rates have risen since the last annual report, the consequences of past risk-taking may persist for some time. While the rise in short-term rates has benefitted net interest margins (NIMs) and net interest income at depository institutions and broker-dealers, a flatter yield curve and expectations for higher funding costs going forward may increasingly lower the earnings benefits from higher interest rates. In addition, the transition to higher rates may expose vulnerabilities among some market participants through a reduction in the value of their assets or an uncertain rise in costs of funding for depository institutions. These vulnerabilities can be mitigated by supervisors, regulators, and financial
institutions closely monitoring increased risk-taking incentives and risks that might arise from rising rates.

Housing Finance Reform – The government-sponsored enterprises (GSEs) are now into their tenth year of conservatorship. While regulators and supervisors have taken great strides to work within the constraints of conservatorship to promote greater investment of private capital and improve operational efficiency with lower costs, federal and state regulators are approaching the limits of their ability to enact wholesale reforms that are likely to foster a vibrant, resilient housing finance system. Housing finance reform legislation is needed to create a more sustainable system that enhances financial stability.

They called out a number of areas for focus where technology intersects finance:

Cybersecurity – As the financial system relies more heavily on technology, the risk that significant cybersecurity incidents targeting this technology can prevent the financial sector from delivering services and impact U.S. financial stability increases. Through collaboration and partnership, substantial gains have been made by both government and industry in response to cybersecurity risks, in part by refining their shared understanding of potential vulnerabilities within the financial sector. It is important that this work continue and include greater emphasis on understanding and mitigating the risk that significant cybersecurity incidents have business and systemic implications.

Financial Innovation – New financial market participants and new financial products can offer substantial benefits to consumers and businesses by meeting emerging needs or reducing costs. But these new participants and products may also create unanticipated risks and vulnerabilities. Financial regulators should continue to monitor and analyze the effects of new financial products and services on consumers, regulated entities, and financial markets, and evaluate their potential effects on financial stability.

And finally, a range of other material structural issues:

Central Counterparties – Central counterparties (CCPs) have the potential to provide considerable benefits to financial stability by enhancing market functioning, reducing counterparty risk, and increasing transparency. These benefits require that CCPs be highly robust and resilient. Regulators should continue to coordinate in the supervision of all CCPs that are designated as systemically important financial market utilities (FMUs). Member agencies should continue to evaluate whether existing rules and standards for CCPs and their clearing members are sufficiently robust to mitigate potential threats to financial stability. Agencies should also continue working with international standard-setting bodies to identify and address areas of common concern as additional derivatives clearing requirements are implemented in other jurisdictions. Evaluation of the performance of CCPs under stress scenarios can be a very useful tool for assessing the robustness and resilience of such institutions and identifying potential operational areas for improvement. Supervisory agencies should continue to conduct these exercises. Regulators should also continue to monitor and assess interconnections among CCPs, their clearing members, and other financial institutions; consider additional improvements in
public disclosure; and develop resolution plans for systemically important CCPs.

Short-Term Wholesale Funding – While some progress has been made in the reduction of counterparty risk exposures in repurchase agreement (repo) markets in recent years, the potential for fire sales of collateral by creditors of a defaulted broker-dealer remains a vulnerability. The SEC should monitor and assess the effectiveness of the MMF rules implemented last year. Regulators should also monitor the potential migration of activity to other cash management vehicles and the impact of money market developments on other financial markets and institutions.

Reliance on Reference Rates – Over the past few years, regulators, benchmark administrators, and market participants have worked toward improving the resilience of the London Interbank Offered Rate (LIBOR) by subjecting the rate and its administrator to more direct oversight, eliminating little-used currency and tenor pairings, and embargoing the submissions of individual banks to the panel for a three-month period. However, decreases in the volume of unsecured wholesale lending has made it more difficult to firmly ground LIBOR submissions in a sufficient number of observable transactions, creating the risk that publishing the benchmark may not be sustainable. Regulators and market participants have been collaborating to develop alternatives to LIBOR. They are encouraged to complete such work and to take appropriate steps to mitigate disruptions associated with the transition to a new reference rate.

Data Quality, Collection, and Sharing – The financial crisis revealed gaps in the data needed for effective oversight of the financial system and internal firm risk management and reporting capabilities. Although progress has been made in filling these gaps, much work remains. In addition, some market participants continue to use legacy processes that rely on data that are not aligned to definitions from relevant consensus-based standards and do not allow for adequate conformance and validation to structures needed for data sharing. Regulators and market participants should continue to work together to improve the coverage, quality, and accessibility of financial data, as well as data sharing between and among relevant agencies.

Changes in Financial Market Structure and Implications for Financial Stability – Changes in market structure, such as the increased use of automated trading systems, the ability to quote and execute transactions at higher speeds, the increased diversity in the types of liquidity providers in such markets, and the expansion in trading venues all have the potential to increase the efficiency and improve the functioning of financial markets. But such changes and complexities also have the potential to create unanticipated risks that may disrupt financial stability. It is therefore important that market participants and regulators continue to try to identify gaps in our understanding of market structure and fill those gaps through the collection of data and subsequent analysis. In addition, evaluation of the appropriate use or expansion of coordinated tools such as trading halts across interdependent markets, particularly in periods of market stress, will further the goal of enhancing financial stability, as will collaborative work by member agencies to analyze developments in market liquidity.

FCA publishes Feedback Statement on Distributed Ledger Technology

The Financial Conduct Authority (FCA) is the conduct regulator for 56,000 financial services firms and financial markets in the UK and the prudential regulator for over 18,000 of those firms. The FCA recently published feedback on its Discussion Paper on Distributed Ledger Technology (DLT).

In April 2017 The FCA announced that it was seeking stakeholder views on the potential for future development of DLT in the markets the FCA regulates.

The FCA received 47 responses from a wide range of market participants including regulated firms, national and international trade associations, technology providers, law firms and consultancies.

DLT has come to greater public prominence as it underpins digital currencies such as Bitcoin. This paper is not about Bitcoin or other so-called cryptocurrencies. Rather its remit is to consider the range of ways that DLT can impact on financial services and the regulatory implications.

Respondents expressed particular support for the FCA maintaining a ‘technology-neutral’ approach to regulation and welcomed the FCA’s open and proactive approach to new technology, including our Sandbox and RegTech initiatives.

The feedback also suggested that current FCA rules are flexible enough to accommodate the use of DLT by regulated firms and no changes to specific rules were proposed. Many respondents suggested that DLT solutions could deliver regulatory requirements more efficiently than current systems, substantially reducing costs for firms and regulators alike.

However, some respondents doubted the compatibility of permissionless networks (permissionless networks allow general public visibility of transactions online and are open for broad participation whilst permissioned networks typically feature a ‘gatekeeper’ who controls access) with our regulatory regime. Based on the feedback and its own work, overall the FCA is open to all forms of deployment of DLT (including both permissioned and permissionless DLT networks) provided the operational risks are properly identified and mitigated.

The FCA will continue to monitor DLT-related market developments, and keep its rules and guidance under review in the light of those developments. It will work collaboratively with industry, HM Treasury, the Bank of England, the Information Commissioner’s Office and other UK bodies to ensure a co-ordinated approach towards DLT in the UK. At an international level, the FCA will work closely with national and international regulatory bodies to shape regulatory developments and standards.

On the Initial Coin Offering (ICO) market, the FCA will gather further evidence and conduct a deeper examination of the fast-paced developments. Its findings will help to determine whether or not there is need for further regulatory action in this area beyond the consumer warning issued in September. In the meantime, the FCA highlights how an ICO-related business proposition needs to be designed to satisfy the ‘consumer benefit’ condition for access to the FCA’s Innovate facilities.

Christopher Woolard, Executive Director of Strategy and Competition at the FCA, said:

“The original paper opened a discussion about DLT and the volume and breadth of responses we received from the industry demonstrates the significance of this issue. DLT has the potential to transform practices across a number of markets, sharpening competition and improving risk management. At the same time we have to be alive to the risks of certain applications of it. We will continue to work with a range of agencies and firms to ensure a co-ordinated approach to the use of DLT in financial services.”

Payment Fraud Is Moving On Line

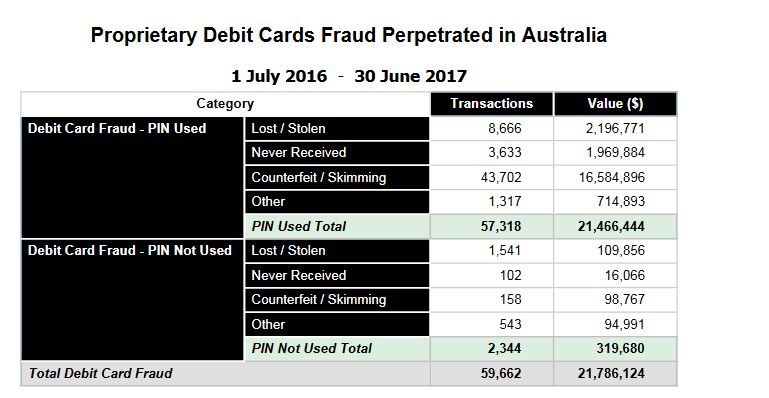
Data released today from the Australia Payment Network,  shows that in the 12 months to 30 June 2017, fraudulent transactions on Australian cards totalled more than $730.1 billion over the 12-month period – up 3.8% and Card fraud increased by 3.1% to $538.2 million.

Within that:

  • counterfeit and skimming fraud dropped 34%
  • card-not-present fraud increased 10%, now accounting for 82% of all fraud on Australian cards

As chip technology continues to provide strong protection against counterfeit card, fraud is migrating to online channels.

With malware and phishing attacks becoming increasingly sophisticated, we also need to be extremely wary of unsolicited emails and text messages from people we don’t know. Don’t click on the link provided and don’t be tricked into divulging confidential data such as your password

The total fraud on the scheme cards was $516 million.


Saving Less, Income Flat, Home Ownership Dream Fading – MLC

The latest MLC Wealth Sentiment Survey contains further evidence of the pressure on households and their finances.

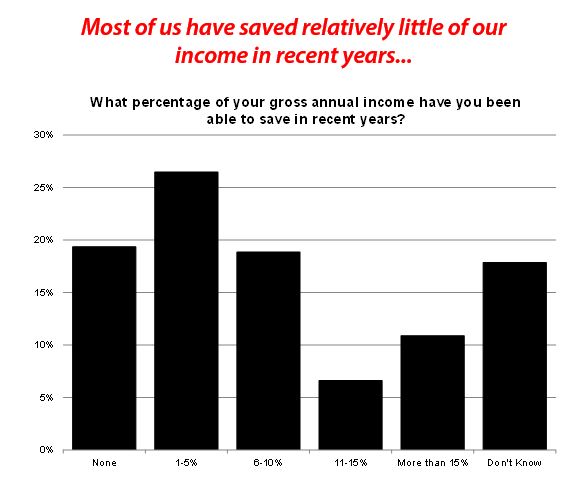
Being able to save has been a challenge for a number of Australians – almost 1 in 5 of us have been unable to save any of our income in recent years, and for more than 1 in 4 of us only 1-5%.

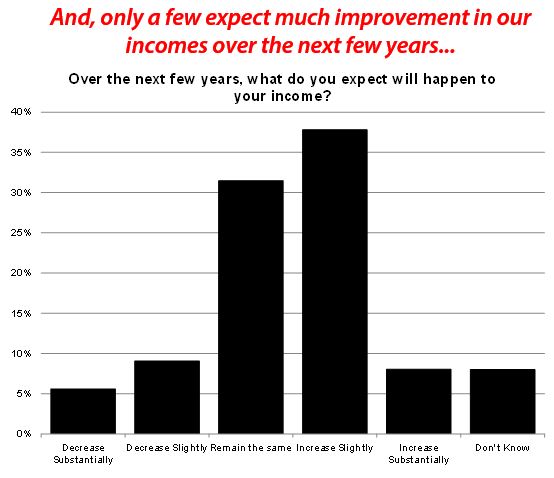
Expectations for future income growth are very conservative – nearly 1 in 3 Australians expect no change in income over the next few years and 15% expect it to fall.

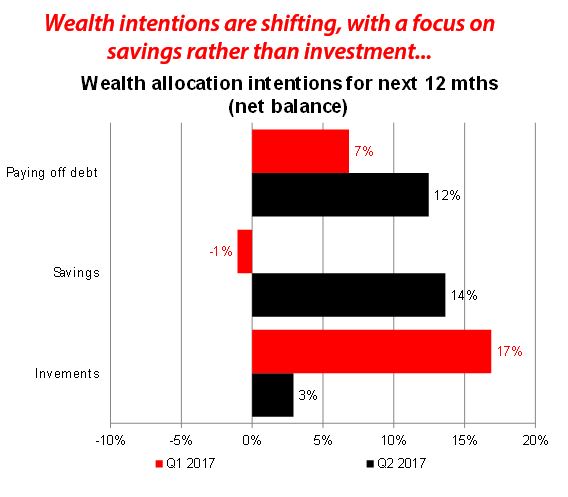
So, not surprisingly, our savings expectations for the future are also very conservative – with more than 1 in 5 Australians believing their savings will fall.

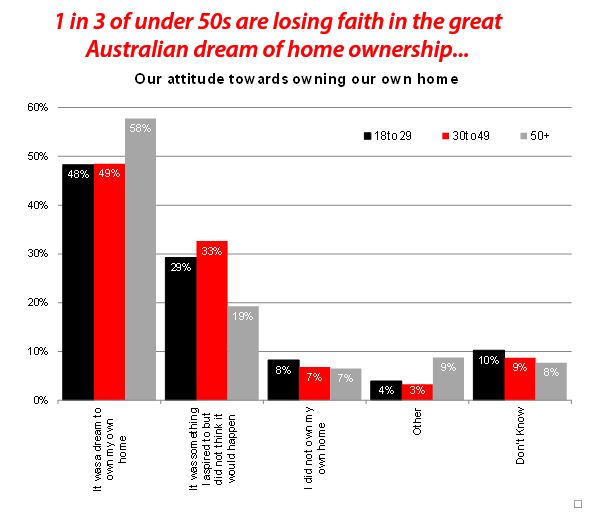
The “great Australian dream” of home ownership is still a reality for many, but for some it’s just a dream – fewer than 1 in 10 Australians said they didn’t want to own their own home, but 1 in 4 said home ownership was something they aspired to but did not think it would happen. Young people still have broadly similar aspirations around home ownership as middle-aged Australians.

Most of us wait and save more before buying our first home and many are prepared to buy some way out of the city – almost 1 in 3 would/did wait longer to have a bigger deposit, and 1 in 4 would live in a suburb some way out of the city to purchase their first home. Around 16% would live in an apartment and 12% further away from work and family or a regional area.

Most Australians don’t plan to or are unwilling to use the family home to fund their retirement – only 18% would be willing to use the family home to fund their retirement either by selling it or using part of their home as equity. The average Australian home owner has around $547,000 of equity in the family home.