They estimate that 15 of the most prominent U.S. digital lenders grew originations at a compound annual growth rate of 129.4% during the five-year period ended Dec. 31, 2016. Going forward, they project slower growth for the industry as lenders focus on building sustainable businesses
with higher quality borrowers.
They predicts that these lenders will originate $62.84 billion in new loans during 2021, up from $29.31 billion in 2016. This represents a CAGR of 16.5% for the five-year period ending Dec. 31, 2021.
Personal-focused lending is projected to grow at a CAGR of 12.4% to $24.31 billion by 2021. The small and medium enterprise and student-focused lending segments are projected to grow faster, with respective CAGRs of 21.5% and 18.4%.
Regulation remains unclear for the industry, but signs of progress have emerged during the past year. Regulators have started to take a closer look at digital lending in an attempt to create a fair and clear regulatory framework.
Venture activity picked back up during the first three quarters of
2017, with $832.5 million raised by the lenders in our analysis.
Student-focused lender Earnest was acquired by student loan
servicer Navient for $155 million in November.
Interest rates and loan sizes have remained relatively unchanged over the past year as lenders focus more on adjusting the rates and loan sizes associated with specific credit grades.
As regulators take a harder look at digital lending, corporate
governance and management teams must ensure that their
companies are beyond reproach. 2017 was the second consecutive year in which a high-profile CEO has been forced to
leave their company.
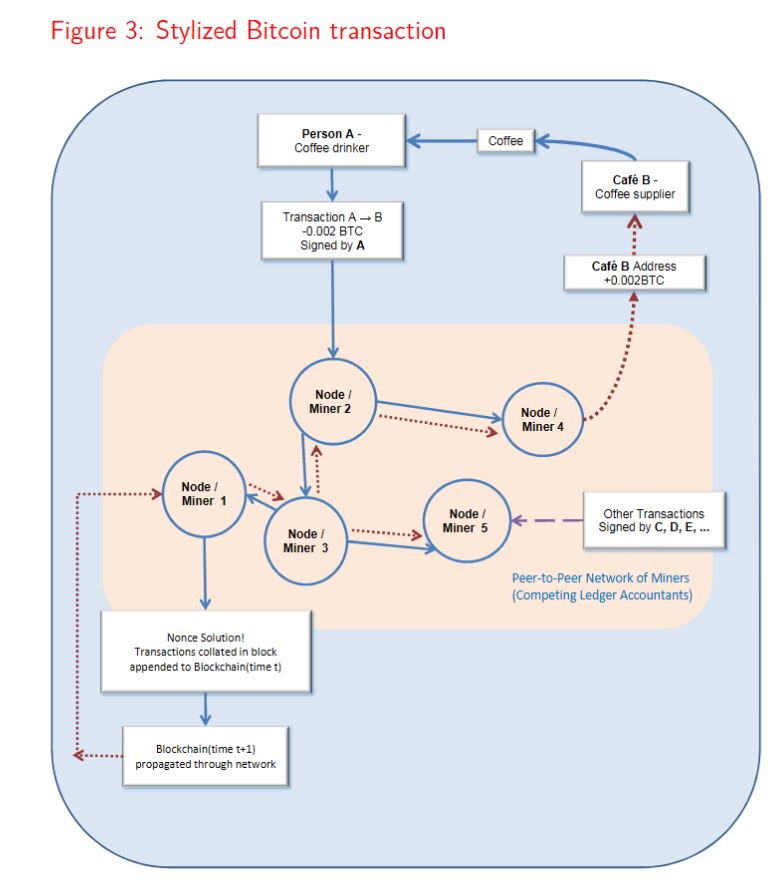
The paper introduces the distributed ledger technology of crypto-currencies. They aim to increase public understanding of these technologies, highlight some of the risks involved in using crypto-currencies, and discuss some of the potential implications of these technologies for consumers, financial systems, monetary policy and financial regulation.
Crypto-currencies have no physical existence, but are best thought of as electronic accounting systems that keep track of people’s transactions and hence remaining purchasing power. Cryptocurrencies are typically decentralised, with no central authority responsible for maintaining the ledger and no central authority responsible for maintaining the code used to implement the ledger system, unlike the ledgers maintained by commercial banks for example. As crypto-currencies are denominated in their own unit of account, they are like foreign currencies relative to traditional fiat currencies, such as dollars and pounds.
They conclude that Crypto-currencies offer some distinct features, such as quicker cross-border transactions, possibly lower transaction fees, pseudo-anonymity, and transaction irreversibility. These features help to explain the growing demand for crypto-currencies, even though they fail to satisfy many of the basic functions of money.
Most crypto-currency accounts lie dormant and many of the active accounts are used only for online gambling or speculative purposes. Perceptions of anonymity have also created a demand for such currencies to facilitate illegal transactions, but the anonymity embodied in crypto-currencies has been over-stated. There have been a significant number of crypto-currency prosecutions in relation to money laundering and other crimes, illustrating that there is no guarantee of anonymity.
While crypto-currencies are growing in popularity, they currently facilitate a very small proportion of transactions. Because crypto-currencies intermediate such a small proportion of transactions, central banks do not presently view crypto-currencies as a material threat.Since crypto-currencies are not well-adapted to the provision of borrowing and lending, we also foresee an enduring role for traditional financial intermediaries.
Crypto-currencies and blockchain technology could well become an important part of global payment systems, but wide-scale adoption will depend on competition from alternative transaction technologies, and on regulation to provide users with security. Crypto-currencies will also need to address technical, scalability issues if they wish to intermediate the volume of transactions undertaken globally.
We conclude that all crypto-currencies are experimental in nature and users face material risks by transacting with them or by holding significant crypto-currency balances. Individual cryptoReserve Bank of New Zealand currencies may be more Betamax than VHS, and more MySpace than Facebook. Even if some of the constructs are enduring, such as distributed ledgers and the use of cryptography, specific crypto-currencies may be supplanted by competing transaction technologies. We close with a Latin expression much-beloved by contract lawyers and economists alike – caveat emptor – buyer beware.
The Analytical Note series encompasses a range of types of background papers prepared by Reserve Bank staff. Unless otherwise stated, views expressed are those of the authors, and do not necessarily represent the views of the Reserve Bank
The chairman of the prudential regulator has called on the finance industry to “devote more effort to the collection of realistic living expense estimates from borrowers” and give “greater thought” to the appropriate use and construct of benchmarks.
Speaking at the Australian Securitisation Forum 2017 on Tuesday (21 November), the chairman of the Australian Prudential Regulation Authority said that the regulator had been “increasingly focused on actual lending practices” and “confirmed there is more to do… to improve serviceability measures, particularly in relation to the assessment of living expenses and the identification of a borrower’s existing debts” to ensure that borrowers can afford their mortgages.
Chairman Wayne Byres told delegates that it was “no secret” that the regulator had been “actively monitoring housing lending by the Australian banking sector over the past few years” in a bid to “reinforc[e] sound lending standards in the face of strong competition that… was producing an erosion in lending quality just at a time when standards should be going in the other direction”.
Noting that mortgages represent more than 60 per cent of total lending within the banking sector, My Byres said that APRA’s goal is to ensure that regulated lenders are “making sound credit decisions which are appropriate, individually and in aggregate, in the context of broader housing market and economic trends”.
The chairman said: “We have consistently called out a number of factors that are contributing to an environment of heightened risk, many of which have been with us for quite some time now. Household indebtedness is high; perhaps more importantly, the trajectory is clearly for it to rise further.”
Mr Byres pointed to figures that show that the housing debt-to-income ratio is near 200 per cent — an all-time high.
“This trend is underpinned by a sustained period of historically low interest rates, subdued income growth and high house prices,” Mr Byres warned. “Combined, they describe an environment in which lenders need to be vigilant to ensure that their policies and practices are both prudent and responsible.
“In short, heightened risk requires heightened vigilance: certainly by APRA, but also — and preferably — by lenders (and borrowers) themselves.”
The APRA chairman said that while APRA’s crackdown on interest-only loans has been helping moderate this type of lending, he warned that there were still metrics that continue to “track higher than [what] intuitively feels comfortable”.
Question of reliability of HEM as a ‘realistic’ benchmark
One such metric was non-performing loans, which Mr Byres said were growing at an overall rate that was “drifting up towards post-crisis highs, without any sign of crisis”.
As such, the regulator is paying “particular attention” to lending to those with a low net income surplus (NIS), those who are “vulnerable to shocks”. According to APRA, NIS lending relies on the lender’s assessment of the surplus income borrowers would likely have left over each month, after taking into account living expenses, debt repayments and adding in some buffers.
“Over recent years, we have been challenging lenders to ensure that their serviceability methodology is robust, and includes adequate conservatism to ensure that borrowers are not unduly exposed if their circumstances were to change,” the chairman said.
Mr Byres went on to state that while the upward trend in low NIS lending “appears to have moderated over the past few quarters”, there is still a “reasonable proportion of new borrowers [who] have limited surplus funds each month to cover unanticipated expenses or put aside as savings”.
He therefore highlighted that as measures of NIS are dependent on the quality of the lenders’ assessment of borrower living expenses, if those expenses are “understated”, then measures of NIS are “overstated”.
Touching on the fact that many banks use the Household Expenditure Measure (HEM) as a benchmark of living expenses, Mr Byres echoed thoughts from the broking industry that this benchmark actually paints a “modest level of weekly household expenditure”.
He called on lenders to do more to ascertain a borrower’s expenses, saying: “It is open to question whether, even if it is higher than a borrower’s own estimate, such a benchmark always provides a realistic assessment of a borrower’s genuine expenditure needs.
“From APRA’s perspective, we would like to see the industry devote more effort to the collection of realistic living expense estimates from borrowers and give greater thought to the appropriate use and construct of benchmarks in instances where those estimates are deemed insufficient.”
Several banks have already introduced tighter policies around expenditure, with AMP announcing that it would not progress loan applications if it did not include a new monthly living expenses form, which covers both basic living and discretionary living expenses.
The APRA chairman also called out the fact that there had only been a “slight moderation” in the proportion of borrowers being granted loans that represent more than six times their income (which would require borrowers to commit more than half of their net income to repayments if interest rates return to their long-term average of just over 7 per cent). He also warned that “high LTI lending is well north of what has been permitted in other jurisdictions grappling with high house prices and low interest rates, such as the UK and Ireland”.
Lastly, Mr Byres highlighted that while lenders utilise a loan-to-income ratio to understand the extent to which a borrower is leveraged, he said that this can be problematic as it does not capture a borrower’s total debt level.
He therefore outlined his belief that the introduction of mandatory comprehensive credit reporting (CCR) from next year will help “strengthen credit assessment and risk management” as it will enable lenders to see a borrower’s full financial commitments, including those from others financial institutions (which has previously been “something of a blind spot” for lenders).
The APRA chairman said: “[T]he government’s recent announcement of mandatory comprehensive credit reporting beginning from next year will facilitate a switch from LTI to debt-to-income (DTI) metrics and strengthen credit assessments and risk management. This will undoubtedly be a positive development for the quality of credit decisions.”
APRA will ‘devote a large portion of supervisory resources to housing’ in 2018
Mr Byres conceded that APRA has “certainly been more interventionist than [it]would normally wish to be”, but added that as risk within the lending environment has increased, he believed the regulator’s actions have “helped to strengthen lending standards to compensate”.
He said: “We will need to continue to devote a large portion of our supervisory resources to housing in 2018. The broader environment of high and rising leverage, encouraged by historically low interest rates, requires ongoing prudence. It is easy to run up debt, but far harder to pay it back down when circumstances change.
“It is in everyone’s long-term interest to maintain sound standards when times are good – that is, after all, when most bad loans are made. Moreover, sound lending standards are an essential foundation on which the health of the Australian financial system is built, regardless of whether the loans are held on balance sheet, or securitised and sold.”
This time, in our occasional series where we feature Australian Fintech’s, we caught up with Co-Founder & Co-CEO of Lodex, Michael Phillipou.
Imagine the possibility of checking if the loan you have at the moment is the best available, in all but real-time, with no impact on your credit score. That’s the promise offered by Fintech Lodex, which launched a few weeks ago.
At first glance Lodex looks like a typical consumer loan auction site where you specify your finance requirement, be it for a home loan, car loan or personal loan. You register and complete some details via their platform, in around 10 minutes; then anonymously, and for free receive later a range of quotations from lenders, based on your profile and need, over the following 4 days. The anonymous submission means your credit score is unaffected.
Below the hood, Lodex provides registered users with their credit score, courtesy of Experian, and by using an Australian first “social score” from their tie-up with Lenddo, which uses non-traditional data based around 12,000 parameters to derive an alternative to a traditional credit score.
When a consumer places a request, lenders or brokers on the platform will receive an alert via email, SMS or on their Lodex dashboard, based on their pre-set requirements. Many of the 90 broker groups on the platform at the moment, plus some smaller lenders, have implemented profiles which enable them to generate automated responses in near real time, while others choose to make a manual assessment as to whether to respond. Once the responses are in, the Lodex user can then choose which, if any of the bids to progress, and choose to share their information with the lender. Lodex, other than getting a referral fee from the broker or lender, drops out.
Since launch Lodex have around 1,800 registered users, and have had around $55 million of loans requested, home loans being the largest share by value, but unsecured personal loans the largest by volume.
But what makes this platform unique is the possibility that current borrowers can benchmark their existing loans using the platform, to test whether they have the best possible deal. This is a game changer. Because there is no charge to register, the only downside is the short amount of time required to build your profile. But the potential is there to find the best loan available, and then choose whether to switch, or stick. Think of it as a market based loan health check.
Co-Founders & Co-CEO of Lodex, Michael Phillipou (Left) and Bill Kalpouzanis
Lodex currently have around 8 people in the team, and co-founders and banking executives Michael Phillipou and Bill Kalpouzanis have plans to take Lodex to other geographies, particularly South East Asia and Europe, which have similar distribution and regulatory frameworks, assisted by Lenddo’s coverage in more than 20 countries, and are also to add into the platform consumer credit cards and unsecured short term loans, as well as savings accounts and term deposits.
They have a strong Advisory Board includes chairman Andrew McEvoy, a former executive at Fairfax Media and managing director of Tourism Australia; marketing and advertising adviser Sean Cummins, the global CEO of Cummins and Partners; strategy adviser Kimberly Gire, a former CFO of retail & business bank at Westpac; and strategy adviser Francesco Placanica, the former CTO of Commonwealth Bank.
So, do not be deceived, this is genuinely an important evolution of lending and puts consumers back in the driving seat. It does break the lending mould.
RBA Governor Philip Lowe spoke at the Australian Business Economists Annual Dinner. Essentially, the conundrum of low inflation and wage growth, despite better employment means the cash rate will stay lower for longer, though the next move is likely up. High household debt is less about risks to the banking system and more about medium term financial stability, especially as rates rise. Household spending will remain muted. GDP is forecast to be higher because the fall in mining investment has ended, even if other business investment is still low.
This is a better read than the bland RBA minutes which also came out today!
Here is the speech:
There are three sets of questions that have occupied much of our time over the past year.
The first is how the final stages of the transition to lower levels of mining investment would play out.
The second is the degree to which an improving labour market would translate into a pick-up in wage growth and inflation.
And the third is the nature of risks stemming from high and rising levels of household debt and how to deal with those risks.
I will talk about each of these three issues and then conclude with how they have influenced the Reserve Bank Board’s decisions on monetary policy over the past year or so.
The End of the Transition
For a number of years we have been describing the economy as being in transition: a transition from very high levels of mining investment to something more normal.
It is now time, though, to move to a new narrative. The wind-down of mining investment is now all but complete, with work soon to be finished on some of the large liquefied natural gas projects. Mining investment, as a share of GDP, is now back to something more normal (Graph 1). This means that, as I talked about in a recent speech, it’s time to open a new chapter in Australia’s economic history.
Graph 1
Over recent times, our judgement has been that this transition to lower levels of mining investment was masking an underlying improvement in the Australian economy. The decline in mining investment generated substantial negative spillovers to the rest of the economy. These spillovers were most evident in Queensland and Western Australia, where, for a while, growth in employment, investment and income were all quite weak.
The good news is that these negative spillovers from lower levels of mining investment are now fading. This was first evident in Queensland, where the labour market began to improve in 2015 (Graph 2). It is now evident too in Western Australia, where conditions in the labour market have improved noticeably since late last year. Elsewhere, there has been steady growth in employment for a number of years.
Graph 2
The fading of the negative spillovers is one reason why growth in the Australian economy is expected to strengthen over the period ahead. Another is the higher volume of resource exports as a result of all the mining investment. We expect GDP growth to pick up to average a bit above 3 per cent over 2018 and 2019 (Graph 3). If these forecasts are realised, it would represent a better outcome than has been achieved for some years now.
Graph 3
This more positive outlook is being supported by an improving world economy, low interest rates, strong population growth and increased public spending on infrastructure. All these things are helping.
Encouragingly, the outlook for business investment has brightened. For a number of years, we were repeatedly disappointed that non-mining business investment was not picking up. Part of the explanation was the negative spillover effects that I just spoke about, although, as my colleague Guy Debelle spoke about last week, there were other factors at work as well. Now, though, a gentle upswing in business investment does seem to be taking place and the forward indicators suggest that this will continue. It’s too early to say that animal spirits have returned with gusto. But more firms are reporting that economic conditions have improved and more are now prepared to take a risk and invest in new assets. This is good news for the economy.
The improvement in the business environment is also reflected in strong employment growth. Over the past year, the number of people with jobs has increased by around 3 per cent, the fastest rate of increase for some time (Graph 4). This pick-up in jobs is evident across the country and has been strongest in the household services and construction industries. It is also leading to a pick-up in labour force participation, especially for women.
Graph 4
Business is feeling better than it has for some time and it is lifting capital spending and creating more jobs.
At the same time, though, growth in consumer spending remains fairly soft. Indeed, for a number of years consumption growth has been weaker than we had originally forecast. This is evident in this chart, which shows our forecasts for consumption growth at various points in time as well as the actual outcomes (black line) (Graph 5). The picture is pretty clear. For some years, consumption growth has been weaker than forecast and it has not exceeded 3 per cent for quite a few years.
Graph 5
The most likely explanation for the ongoing subdued consumption outcomes is the combination of weak growth in real household income and the high level of household debt. Given the persistence of these factors, our latest forecasts have incorporated a flatter profile for consumption growth than has been the case in previous forecasts.
An important issue shaping the future is how these cross-cutting themes are resolved: businesses feel better than they have for some time, but consumers feel weighed down by weak income growth and high debt levels.
Our central scenario is that the increased willingness of business to invest and employ people will lead to a gradual increase in growth of consumer spending. As employment increases, so too will household income. Some increase in wage growth will also support household income. Given these factors, the central forecast is for consumption growth to pick up to around the 3 per cent mark. This would be above the average growth of consumption for the current decade, but below the average for the period prior to the financial crisis.
Labour Market, Wages and Inflation
I would like to turn to the second question that has occupied us over much of the past year: the degree to which an improving labour market will translate into a pick-up in wage growth and inflation.
A distinguishing feature of Australia’s recent economic performance has been the slow growth in wages. The Wage Price Index has increased by just 2 per cent over the past year. Whereas in earlier years, Australians had got used to average wage increases of around the 3½–4 per cent mark, 2–2½ per cent is now the norm (Graph 6). Growth in average hourly earnings has been weaker still: in trend terms it is running at the lowest rate since at least the 1960s. Not only are wage increases low, but some people had been moving out of high-paying jobs associated with the mining sector into lower-paying jobs. We have heard from our liaison program that there has been downward pressure on non-wage payments, including allowances, and an increase in the proportion of new employees hired on lower salaries than their predecessors.
Graph 6
As I noted earlier, subdued growth in wages is also occurring in a number of other countries. Understanding this is a major priority. Low growth in wages means low inflation, which means low interest rates, which means high asset valuations. So a lot depends on understanding the reasons for slow growth in nominal and real wages. The answer is likely to be found in a combination of cyclical and structural factors.
In Australia, we are still some way short of our estimates of full employment of around 5 per cent, so it is not surprising that wage growth is below average.
But structural factors are likely to be at work as well. Foremost among these are perceptions of increased competition.
Many workers feel there is more competition out there, sometimes from workers overseas and sometimes because of advances in technology. In the past, the pressure of competition from globalisation and from technology was felt most acutely in the manufacturing industry. Now, these same forces of competition are being felt in an increasingly wide range of service industries. This shift, together with changes in the nature of work and bargaining arrangements, mean that many workers feel like they have less bargaining power than they once did.
But this is not the full story. It is likely that there is also something happening on the firms’ side as well. In other advanced economies where unemployment rates are below conventional estimates of full employment, the normal tendency for firms to pay higher wages in tight labour markets appears to be muted. Businesses are not bidding up wages in the way they might once have. This is partly because business, too, feels the pressure of increased competition.
One response to this competitive pressure is to have a laser-like focus on containing costs. Over recent times there has been a mindset in many businesses, including some here in Australia, that the key to higher profits is to reduce costs. Paying higher wages can sit at odds with that mindset.
Given these various effects, it is plausible that, at least for a while, the economy is less inflation prone than it once was. Both workers and firms feel more competition, and it is plausible that the wage- and price-setting processes are adjusting in response.
This, of course, does not mean that the normal forces of supply and demand have been abandoned. Tighter labour markets should still push up wages and prices, even if it takes a little longer than we are used to. We are starting to see some hints of this in the Australian labour market. Business surveys report that firms are having more difficulty finding suitable labour than they have for some time (Graph 7). In the past, when firms found it difficult to find suitable labour, higher growth in wages resulted. Consistent with this, we are hearing reports through our liaison program that in some pockets the stronger demand for workers is starting to push wages up a bit. We expect that as employment growth continues, these reports will become more common.
Graph 7
Another factor that has a significant bearing on the outlook for inflation is the increased competition in the retail industry. I spoke a few moments ago about how, globally, increased competition is affecting pricing dynamics. Australian retailing provides a very good example of this. Competition from new entrants is putting pressure on margins and is forcing existing retailers to find ways to lower their cost structures. Technology is helping them to do this, including by automating processes and streamlining logistics. The result is lower prices.
For some years now, the rate of increase in food prices has been unusually low. A large part of the story here is increased competition. The same story is playing out in other parts of retailing. Over recent times, the prices of many consumer goods – including clothing, furniture and household appliances – have been falling (Graph 8). Increased competition and changes in technology are driving down the prices of many of the things we buy. This is making for a tough environment for many in the retail industry, but for consumers, lower prices are good news.
Graph 8
A question we are grappling with here is how much further this process has to run. It is difficult to know the answer, but our sense is that the impact of greater competition on consumer prices still has some way to go as both retailers and wholesalers adjust their business models. So this is likely to be a constraining factor on inflation for a while yet.
Putting all this together, we expect inflation to pick up, but to do so only gradually (Graph 9). By the end of our two-year forecast period, inflation is expected to reach about 2 per cent in underlying terms, and a little higher in headline terms because of planned increases in tobacco excise. Underpinning this expected lift in inflation is a gradual increase in wage growth in response to the tighter labour market.
Graph 9
High and Rising Household Debt
The third question we have focused on over recent times is the implications of the high and rising level of household debt.
The growth in household debt has been outpacing the very low growth in household incomes for a few years now. As a result, the household debt-to-income ratio has risen, although if account is taken of the increased balances held in offset accounts the rise is less pronounced (Graph 10). The low level of interest rates means that even though debt levels are higher, the share of household income devoted to paying mortgage interest is lower than it has been for some time. Perhaps reflecting this, as well as the recent decline in the unemployment rate, aggregate indicators of household financial stress remain quite low.
The central issue here is how the high levels of debt affect the stability of the economy over the medium term. Our concern has not been the stability of the banking system; the banks are strong and they are well capitalised. Rather, the concern has been that as the household sector takes on ever-more debt relative to its income, the risk of medium-term problems increases. This is especially so when this debt is taken on in an unusually low-interest rate environment.
Graph 10
It is difficult to be precise about exactly how much this risk has increased, but our judgement has been that, should earlier trends have continued, the risk of future problems would have continued to increase. A scenario we have focused on is the possibility of a future shock that causes households to abruptly reassess their past borrowing decisions. In this scenario, consumption might be wound back sharply to put balance sheets on a sounder footing. If this occurred, it could turn an otherwise manageable shock into something more serious.
One way of guarding against this risk is for lenders to maintain strong lending standards. The various steps taken by the Australian Prudential Regulation Authority (APRA) – with the strong support of the Council of Financial Regulators – have worked in this direction. Growth in lending to investors has slowed, fewer loans are being made with very high loan-to-valuation ratios, debt-servicing tests have been tightened and fewer interest-only loans are being made. The latest data suggest that the banks have more than succeeded in reducing interest-only lending to below the 30 per cent benchmark (Graph 11). These are all positive developments but it is an area we, together with the Council of Financial Regulators, continue to watch closely.
Graph 11
Recently, we have also seen some cooling in the Sydney property market. This reflects a combination of factors, including increased supply of new dwellings, some tightening of credit conditions, higher interest rates on loans to investors and some reduction in offshore demand. The increasing unaffordability of prices for many people has also probably played a role. In Melbourne, where the population is growing very strongly, housing prices are still increasing faster than incomes, although the rate of increase has slowed. Elsewhere, housing prices have been little changed over recent months. Conditions are subdued in Brisbane, where the supply of apartments has increased significantly, and remain weak in Perth, owing to slowing population growth following the unwinding of the mining investment boom.
It is important to be clear that the RBA does not have a target for housing prices. But a return to more sustainable growth in housing prices does reduce the medium-term risks. These risks have not gone away, but the fact that they are not building at the rate they have been is a positive development.
Monetary Policy
I would like to conclude with what all this has meant for monetary policy over the past year or so.
As you are aware, the Reserve Bank Board has kept the cash rate unchanged at 1.5 per cent since August last year.
In the early part of that period, a central issue was balancing the need to support the economy in the final days of the transition to lower levels of mining investment against the risks stemming from rising household debt. Lower interest rates might have provided a bit more support, but would have done so partly by encouraging people to borrow yet more money, thus adding to the risks. The Board’s judgement was this would not have been consistent with its broad mandate for economic stability. Accordingly, with the economy expected to pick up and the unemployment rate to come down gradually as the mining investment transition came to an end, the Board judged it appropriate to hold the cash rate at 1.5 per cent. We were prepared to be patient in the interests of medium-term economic stability.
As the year progressed, we became somewhat more confident that the expected pick-up in growth would materialise. The strengthening in the global economy has helped here. So too has the lift in employment and the better outlook for investment. This improvement meant that the case for lower interest rates weakened over the year.
Also, as the year progressed, one issue the Board paid increasing attention to was the persistently weak growth in wages and household incomes and the implications for consumption. A related issue is the effect of increased competition on the wage and price dynamics in the economy. As I said earlier, we are still trying to understand this. It does, though, look increasingly likely that these factors will mean that inflation remains subdued for some time yet. We still expect headline inflation to move above 2 per cent on a sustained basis, but it is taking a bit longer to get there than we had earlier expected.
So, in summary, over the past year or so there has been progress in moving the economy closer to full employment and in having inflation return to the 2 to 3 per cent range. Both of these are positive developments and suggest a more familiar normal is still in sight. Progress on these fronts has been made while also containing the build-up of risks in household balance sheets.
We still, though, remain short of full employment, and inflation is expected to pick up only gradually and remain below average for some time yet. This means that a continuation of accommodative monetary policy is appropriate. If the economy continues to improve as expected, it is more likely that the next move in interest rates will be up, rather than down. But the continuing spare capacity in the economy and the subdued outlook for inflation mean that there is not a strong case for a near-term adjustment in monetary policy. We will, of course, continue to keep that judgement under review.
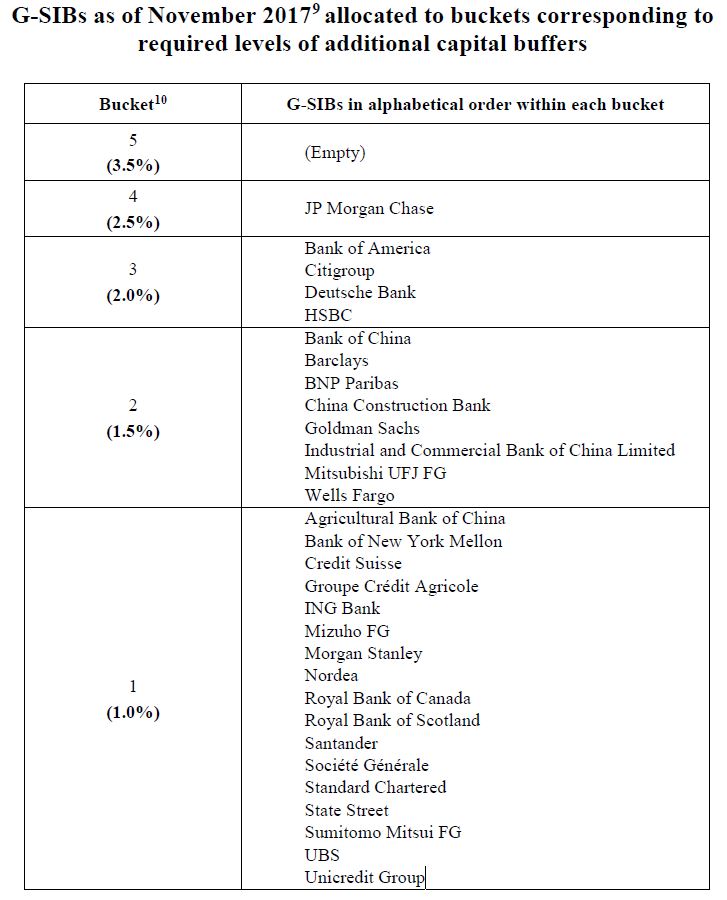
The Financial Stability Board (FSB), in consultation with Basel Committee on Banking Supervision (BCBS) and national authorities, has identified the 2017 list of global systemically important banks (G-SIBs), using end-2016 data and the updated assessment methodology published by the BCBS in July 2013. One bank has been added to and one bank has been removed from the list of G-SIBs that were identified in 2016, and therefore the overall number of G-SIBs remains 30.
FSB member authorities apply the following requirements to G-SIBs:
Higher capital buffer: Since the November 2012 update, the G-SIBs have been allocated to buckets corresponding to higher capital buffers that they are required to hold by national authorities in accordance with international standards. Higher capital buffer requirements began to be phased in from 1 January 2016 for G-SIBs (based on the November 2014 assessment) with full implementation by 1 January 2019. The capital buffer requirements for the G-SIBs identified in the annual update each November will apply to them as from January fourteen months later. The assignment of G-SIBs to the buckets, in the list published today, determines the higher capital buffer requirements that will apply to each G-SIB from 1 January 2019.
Total Loss-Absorbing Capacity (TLAC): G-SIBs are required to meet the TLAC standard, alongside the regulatory capital requirements set out in the Basel III framework. The TLAC standard will be phased-in from 1 January 2019 for G-SIBs identified in the 2015 list (provided that they continue to be designated as G-SIBs thereafter).
Resolvability: These include group-wide resolution planning and regular resolvability assessments. The resolvability of each G-SIB is also reviewed in a high-level FSB Resolvability Assessment Process (RAP) by senior regulators within the firms’ Crisis Management Groups.
Higher supervisory expectations: These include supervisory expectations for risk management functions, risk data aggregation capabilities, risk governance and internal controls.
9 Compared with the list of G-SIBs published in 2016, the number of banks identified as G-SIBs remains the same. One bank (Royal Bank of Canada) has been added to and one bank (Groupe BPCE) has been removed from the list. Two banks moved to a higher bucket: both Bank of China and China Construction Bank moved from bucket 1 to 2. Three banks moved to a lower bucket: Citigroup moved from bucket 4 to 3, BNP Paribas moved from bucket 3 to 2, and Credit Suisse moved from bucket 2 to 1.
10 The bucket approach is defined in Table 2 of the Basel Committee document Global systemically important banks: updated assessment methodology and the higher loss absorbency requirement, July 2013. The numbers in parentheses are the required level of additional common equity loss absorbency as a percentage of risk-weighted assets that each G-SIB will be required to hold in 2019.
A new list of G-SIBs will next be published in November 2018
The recent accidents with regards to MP’s citizenship seems to have opened the door wider on a potential inquiry into banking. That may happen, but in my view it misses the point.
The clear and present danger which we are now facing relates to housing. We have been tracking the building risks in the sector for many years, and finally even the regulators have gotten the message, see ASIC, APRA and RBA. Our regulators have failed us and the proposal from Murray’s FSI for an audit of their effectiveness fell on deaf ears. The Council of Financial Regulators suffers from group think.
The myopic approach from Government (Federal and State) means we have no long term planning, no joined up thinking and ad hoc “fixes” as for example in the QLD election campaign and a deliberate failure to address the fundamentals.
Worse, our banks are super-sized building societies, with some lenders holding up to 70% of their loan book exposed to the property sector. This means they are less willing to lend to productive businesses who can create real growth. Banks underestimate their portfolio risks. Defaults are rising even now at current low rates and the trajectory is higher. Yet more than half of dividends in Australia come from the banks.
There are so many stakeholders with vested interests, it is no surprise we just muddle through. Weird when you think that based on the size of our island continent, per capital we have more land than almost anyone. Lending will continue to grow at three times income/cpi.
It seems to me we have two potential circuit breakers.
The first is we wait for the inevitable home price crash – by at least 20% leading to misery for households and banks. Remember 10 years after the GFC, Ireland is still wrestling with the property falls there. Almost certainly there would be an inquiry post the apocalypse which will happen 2-3 years after rates start to rise if the GFC is an analogue.
The second option is a proper root and branch review now. Bite the bullet to look at the whole housing box and dice, to include regulation, taxation, planning, lending and the rest. Put aside political infighting, and get the strategy right. That way we might just escape the inevitable crunch, or at least mitigate the impact.
If you want an inquiry, best pick the right horse. Or we just keep doing the same, just do not expect a different outcome.
Interesting consultation from the Treasury of the impact of digital migration of consumer bills, and the emerging trend to charge for a paper version, which may adversely be impacting those unable or unwilling to go digital. They suggest 1.2 million households are digitally excluded.
NBN Co forecasts that 94 per cent of households will have internet access by 2020, and 100 per cent by 2030. However, there is still a sizeable minority – 1.3 million households as of 2015 – who do not have access to the internet. These consumers currently have no practical way to transition to digital billing.
Individuals surveyed provided a variety of reasons for not accessing the internet. Many of the reasons provided do not suggest that the individuals fall into disadvantaged groups. However many cite a lack confidence or knowledge to access the internet or cost as the main reason for not accessing the internet. Based on the number of households who indicated cost or knowledge as their reason for not accessing the internet, Treasury estimates there are approximately 1.2 million Australians who do not have internet access at home because they either cannot afford it or because they believe they do not have sufficient technical skills. Given the relatively low cost and large benefits associated with having internet access, Treasury assumes a majority of the consumers who indicated cost as coming from one of the disadvantaged groups described. Additionally, in digital inclusion suggest many consumers who indicated lack of knowledge as a reason not to access the internet also likely come from one of the disadvantaged groups identified above.
In addition to those with no internet access there are also many Australians who lack the technical skills or appropriate technology to enable them to pay bills online. Digital inclusion is a measure of groups and individuals ability to access and use information and provides some insight into the makeup of this group.
Digital inclusion tends to decline with age and is lower among Australians with a disability and Indigenous Australians. Additionally, one in five Australians only has access to the internet through a mobile device. Modern mobile devices allow users to complete a majority of tasks that previously required a laptop or desktop, however some users may have difficulty reviewing their bills on a three to five inch screen. Mobile only internet access has been linked with socioeconomic factors including low income and low education levels.
Consumers who elect to receive paper bills and pay fees due to fear of online scams are an important subset of this group, although paper bills may also lead to identity fraud through mailbox theft. Unfamiliarity with the internet has been raised by many stakeholders as key reason why consumers do not want to transition to digital billing and justification for opposing paper billing fees.
Some consumers with lower levels of digital inclusion will still chose to receive digital bills. However a subset of this group will face significant barriers that may prevent them from accessing bills online and will instead pay paper billing fees. This suggests that there are likely disadvantaged consumers who have access to the internet, but still have no choice but to pay paper billing fees.
The provision of bills in a digital format, when compared to paper billing is often seen as a simpler, lower-cost and more environmentally friendly option for businesses and a more convenient option for consumers. Digital bills can also be integrated with other digital services and information such as electronic reminders or notifications, access to previous billing information, and online changes to personal details. For these reasons, it is viewed by some as being in the interest of business and the broader community to transition customers to digital bills. Paper billing fees – a charge for customers who elect to receive a paper bill – are a common mechanism used to encourage consumers to make the change to digital bills.
While many consumers may have the option to transition to digital bills, but choose to pay paper billing fees due to personal preference, there is a concern that this is not the case for all consumers. These consumers may pay paper billing fees out of necessity, because they do not have the ability to access digital bills.
There may be scope for the Government to take action to protect these consumers.
The policy options analysed in this RIS are:
Option 1 — the status quo, with an industry led consumer education campaign;
Option 2 — prohibition (ban) on paper billing fees;
Option 3 — prohibiting essential service providers from charging consumers to receive paper bills;
Option 4 — limiting paper billing fees to a cost recovery basis;
Option 5 – promoting exemptions through behavioural approaches.
Further evidence on the likely impact of all options is required to conduct an informed evaluation of the options and to determine which approach should be pursued. The views of stakeholders will inform a final, Decision Making Council of Australian Governments (COAG) RIS.
Wayne Byers, APRA Chairman spoke at the Australian Securitisation Forum 2017. Household debt is high, and continues to rise. There are a three interesting observations within his speech about the risks in the mortgage system, despite their recent interventions.
First, the trend in non-performing housing loans is upward, despite a relatively benign environment for lenders. The overall rate of non performing housing loans is drifting up towards post-crisis highs, without any sign of crisis.
Second, while the upward trend in low Net Income Surplus (NIS) lending appears to have moderated over the past few quarters, a reasonable proportion of new borrowers have limited surplus funds each month to cover unanticipated expenses, or put aside as savings.
Third, there is only a slight moderation in the proportion of borrowers being granted loans that represent more than six times their income. As a rule of thumb, an LTI of six times will require a borrower to commit 50 per cent of their net income to repayments if interest rates returned to their long term average of a little more than 7 per cent. High LTI lending in Australia is well north of what has been permitted in other jurisdictions grappling with high house prices and low interest rates, such as the UK and Ireland.
So, APRA is finally looking at LTI and they acknowledge there are risks in the system. Better late than never…! LVR is not enough. He also discussed the non-bank sector.
Here is the speech:
It is no secret we have been actively monitoring housing lending by the Australian banking sector over the past few years. Throughout this period, our efforts have been directed at reinforcing sound lending standards in the face of strong competition that, in our view, was producing an erosion in lending quality just at a time when standards should be going in the other direction.
Housing loans represent over 60 per cent of total lending within the banking sector. Our goal has been to ensure APRA-regulated lenders are making sound credit decisions which are appropriate, individually and in aggregate, in the context of broader housing market and economic trends. We have consistently called out a number of factors that are contributing to an environment of heightened risk, many of which have been with us for quite some time now. Household indebtedness is high: perhaps more importantly, the trajectory is clearly for it to rise further (Chart 1).
This trend is underpinned by a sustained period of historically low interest rates, subdued income growth, and high house prices. Combined, they describe an environment in which lenders need to be vigilant to ensure their policies and practices are both prudent and responsible. In short, heightened risk requires heightened vigilance: certainly by APRA, but also – and preferably – by lenders (and borrowers) themselves.
Our activities in relation to housing broadly fit into three categories:
Industry-wide portfolio benchmarks: perhaps the most-publicised of our actions have occurred at the industry level through the temporary benchmarks in place in respect of both investor lending growth and new interest-only lending. These benchmarks have served to constrain higher risk lending, and discouraged lenders from competing aggressively for these types of loans. Standards and pricing have increased as a result, tempering the growth of new credit in these areas. I’ll come back to these impacts shortly.
Lending standards: we increased our activities in this area as far back as 2011, when we wrote to the boards of the larger authorised deposit-taking institutions (ADIs) to seek assurance they were actively monitoring their housing portfolios and standards. In more recent years, we have also used measures such as hypothetical borrower exercises to test lending policies.2 This led to new, and in a few cases more prescriptive, regulatory guidance on appropriate lending standards and risk management in residential mortgage lending: this was first issued in 2014 and refined last year.
Lending practices: as we have dived deeper into housing lending, we have increasingly focussed on actual lending practices – in other words, are lending policies reflected in the everyday conversations that lenders are having with borrowers? Sound policies only provide comfort if they are actually followed. Aided by file reviews conducted by external auditors, we have confirmed there is more to do in this area to improve serviceability measures, particularly in relation to the assessment of living expenses and the identification of a borrower’s existing debts.
Impact on lending activity
In thinking about the impact of our interventions on housing credit, it’s important to note that APRA can only influence the terms and price at which credit is supplied. We cannot influence the underlying demand. Actual lending outcomes will be a product of both, so I do not want to be seen to suggest that all of the trends that I am about to discuss are solely attributable to APRA – there are many forces at play. That said, there’s no doubt many of trends are ones we hoped to see.
Aggregate housing credit is now growing a little over 6 per cent: not that different from its growth rate before we introduced our industry-wide investor growth benchmark in 2014 (Chart 2).
But it is clear that the strong growth in lending to investors has been curtailed. The emerging imbalance called out by the Reserve Bank in its September 2014 Financial Stability Review has been halted (although not reversed), and overall growth in credit to investors is now more in line with that to owner-occupiers. We have also had the added benefit that lenders have been forced to improve their management information systems, which in the absence of any regulatory requirements had grown lax in identifying the purpose for which money was being borrowed.
More recently, we introduced an additional benchmark with respect to new interest-only lending. The proportion of interest-only lending had been gradually building in Australia (Chart 3).
In an environment of seemingly ever-rising house prices and low interest rates, an increasing number of borrowers had become comfortable maintaining high debt levels. To exacerbate this, lenders’ practices made it easy to refinance or extend interest-only terms, making it relatively simple for a borrower to avoid paying down their principal debt over an extended period of time.
Our announcement in March this year that APRA-regulated lenders should limit their new interest-only lending to no more than 30 per cent of new lending funded during a given quarter has had an immediate and notable impact (Chart 4).
Over the past couple of years, the share of interest-only lending has moderated in response to the more modest rate of growth in lending to investors (who typically make greater use of interest-only products). Nevertheless, having run at between 40-50 per cent of new lending for some time, interest-only lending accounted for about 23 per cent of total new lending for the quarter ended September. Forecasts for the December quarter suggest something similar again.
While our focus was on new interest-only lending, the emergence of stronger price signals through differential pricing also motivated many existing interest-only borrowers to switch to principal and interest (P&I) repayments. This has resulted in a reduction in ADIs’ interest-only loans outstanding by around $36 billion, or close to 7 per cent, over the last six months. We see this switching as positive for the risk profile of loan portfolios, as it has increased the proportion of borrowers that are paying down principal on their loan and therefore working to reduce overall indebtedness.
In March, we also asked ADIs to increase their scrutiny of interest-only lending with high loan-to-value ratios (LVRs). As a result, many APRA-regulated lenders reduced their maximum LVRs for interest-only loans. Over the subsequent months, we have seen a continuation in the decline of high LVR lending, both in terms of interest-only and, to a lesser extent, P&I loans (Charts 5a and 5b).
Within this broadly positive picture, however, there are a few other metrics that are continuing to track higher than intuitively feels comfortable.
First, the trend in non-performing housing loans is upward, despite a relatively benign environment for lenders (Chart 6).
With historically low interest rates and an unemployment rate that for the past few years has drifted lower, an a priori expectation might have been for non performing housing loans to return to lower levels. Certainly, the current trend is influenced by geographic factors – in particular, the softening of activity and house prices Western Australia is a significant part of the increase. But nonetheless the overall rate of non performing housing loans is drifting up towards post-crisis highs, without any sign of crisis. Given metrics of non-performing loans are a product of historical lending practices, they do not tell us anything much about lending quality today. But it does support the proposition that the need to reinforce lending standards was warranted.
With this in mind, we are paying particular attention to lending with a low net income surplus (NIS). This measure represents the lender’s assessment of the surplus income borrowers would likely have left over each month, after taking into account living expenses, debt repayments and adding in some buffers. Low NIS borrowers are obviously vulnerable to shocks. Over recent years we have been challenging lenders to ensure that their serviceability methodology is robust, and includes adequate conservatism to ensure that borrowers are not unduly exposed if their circumstances were to change. While the upward trend in low NIS lending appears to have moderated over the past few quarters (Chart 7), this chart still shows a reasonable proportion of new borrowers have limited surplus funds each month to cover unanticipated expenses, or put aside as savings.
To add to this picture, we have also observed only a slight moderation in the proportion of borrowers being granted loans that represent more than six times their income (Chart 8).
As a rule of thumb, an LTI of six times will require a borrower to commit 50 per cent of their net income to repayments if interest rates returned to their long term average of a little more than 7 per cent. High LTI lending in Australia is well north of what has been permitted in other jurisdictions grappling with high house prices and low interest rates, such as the UK and Ireland.5
Current areas of focus
These last two charts are a useful segue into two key areas on which we are currently focussing.
The first is estimates of living expenses. Measures of NIS are dependent, amongst other things, on the quality of the lender’s assessments of borrower living expenses. Put simply, if living expenses are underestimated then measures of NIS are overstated. Lenders know that borrowers have difficulty estimating their expenses (and have an incentive to understate them), and so as a safeguard will typically use the higher of the borrower’s estimate and their own benchmarks of what a minimum level of living expenses is likely to be. These benchmarks are often based on the Household Expenditure Measure (HEM), with a degree of scaling for different income levels. Indeed, our recent review of lending files at some of the largest lenders provided interesting insights into the high proportion of loans that are being assessed for serviceability based on the lenders’ living expense benchmarks (Chart 9).
The use of benchmarks as the primary means of measuring living expenses operates to protect against instances of borrowers underestimating their expenditure. However, the prominent use of any type of benchmark within credit assessments only emphasises the importance of that benchmark being realistic. The HEM, for example, is a measure that reflects a modest level of weekly household expenditure for various types of families. It is open to question whether – even if it is higher than a borrower’s own estimate – such a benchmark always provides a realistic assessment of a borrower’s genuine expenditure needs. From APRA’s perspective, we would like to see the industry devote more effort to the collection of realistic living expense estimates from borrowers and give greater thought to the appropriate use and construct of benchmarks in instances where those estimates are deemed insufficient.
The second key area is lenders’ knowledge of a borrower’s financial commitments and total indebtedness. Loan-to-income ratios (LTI) provides a measure of the extent to which borrowers are leveraged, but are obviously limited because they do not capture the borrower’s total debt level. Many other countries have used credit scores and positive credit reporting for some time as a means of sharing information and conducting comprehensive credit assessments. In Australia, other financial commitments remain something of a blind spot for lenders. However, the Government’s recent announcement of mandatory comprehensive credit reporting beginning from next year will facilitate a switch from LTI to debt-to-income (DTI) metrics, and strengthen credit assessments and risk management. This will undoubtedly be a positive development for the quality of credit decisions.
New non-ADI lender rules
We are working within a system in which well north of 90 per cent of housing finance is currently provided by APRA-regulated lenders. So the measures that we have taken impact the vast majority of mortgage lending in Australia. But when the flow of credit encounters regulation, it’s like flowing water encountering a barrier: one tries to find a way around the other. We therefore haven’t been blind to the fact that the more we lift the quality and/or reduce the quantity of lending in the regulated sector, the more that it provides opportunity for non-APRA regulated lenders to fill any unsated demand. We need to be mindful that, while from a financial safety (microprudential) perspective credit portfolios of individual regulated lenders will be improving, from a financial stability (macroprudential) perspective the risk may just be moving elsewhere. Moreover, it could be concentrating risk in the parts of the system that are less transparent or receive less regulatory scrutiny – often short-handed as the ‘shadow banking’ sector.
There have been two main responses to this risk in recent times:
First, we have been looking at whether bank funding of housing loans via warehousing facilities is facilitating risks that would be materially higher than banks would naturally want to write for themselves. In other words, we want to make sure lenders have not been pushing risk out the front door, only to bring it in again via the back. Warehouse exposures are relatively small, but we have observed that there is quite a high tolerance for investor and interest-only loans within warehouses – in some cases, documented eligibility criteria allow for as high as 60 per cent of the pool in each of these categories. Across the industry, non-ADI lenders utilising ADI warehouses would seem to have, on average, slightly higher risk profiles in their portfolios, but there are clearly some individual non ADIs lenders with lending portfolios that are dominated by the sorts of lending that we have been disincentivising ADIs from taking on.
Secondly, the Government has introduced legislation into Parliament that would provide us with a new power to use should we think the aggregate impact of non-ADI lenders is materially contributing to risks of instability in the Australian financial system.
I would like to say a few words about this power, since I know it has generated quite a bit of interest amongst many in this room. The first point I would make is to stress that we see it very much as a reserve power. There is a clear threshold to be met before any rules could be applied to non-ADI lenders: that (i) APRA considers that the lending by non-ADI lenders contributes to risks of instability in the Australian financial system and, (ii) APRA considers that it is necessary, in order to address those risks, to make rules covering the lending of non-ADI lenders.
That means that, most of the time, the power to impose rules will lie dormant: non-ADI lenders will go about their business as they have always done, unconstrained by any APRA rules. Importantly, non-ADI lenders will not be subject to any day-to-day prudential oversight by APRA. For those of you uncomfortable at the thought of APRA supervising non-ADIs, let me assure you the feeling is mutual. We are not seeking to expand our supervisory remit and, beyond collecting information that allows us to track aggregate trends in lending activity, we will not be undertaking any supervision of individual lenders. Indeed, we are keen to distance ourselves from any perception we are responsible for the activities of any individual non-ADI lender, or for protecting their investors. To be absolutely clear, we have no intention of taking on that role. For investors in non-ADI lenders, market discipline and caveat emptor remain the primary regulating influences. Our focus is very much on the aggregate.
The ASF’s submission on the proposed legislation noted that any judgement on the extent of material risks to financial stability is fraught with difficulty. I wholeheartedly agree. There is no single measure of financial stability: it is necessarily a matter of judgement, taking into account a wide range of factors. But we will undoubtedly be better placed to make good judgements if we have good data. So the new legislation does impose a new set of ongoing requirements for those businesses that exceed the size threshold to be registered under the Financial Sector (Collection of Data) Act 2001 (FSCODA), and hence provide data to APRA to help us track overall lending trends. We are giving thought to what that data might entail, and will consult with the industry before any new requirements are introduced. But as per the ASF’s submission, we will mainly be seeking to observe the volume and nature of lending that is occurring, and not the traditional prudential metrics that we collect from ADIs.
The ASF’s submission also noted that the new legislation might create some uncertainty in the minds of investors as to the regulatory framework applying to non-ADI lenders. I cannot dispute that might be the case, although clarifying that non-ADIs will not be prudentially supervised and that APRA’s rule-making is a reserve power should alleviate some of those concerns. But equally, given international perceptions of Australia’s housing market, reinforcing the understanding of international investors that the Australian authorities have a wide range of tools at their disposal to support financial stability, should the need arise, certainly offers benefits as well.
As to what would happen if we got to a point where we thought the introduction of non-ADI rules might be needed, it is important to note that, as with data collections, we would need to undertake a consultation process, engaging with affected lenders on what we proposed to do in response to the risks we perceived to exist.
Let me finish on this issue by noting that, as things stand today, we do not foresee the need for any new non-ADI lender rules to be introduced the moment the legislation is passed. Our immediate priority will be to consider how to identify the right entities to collect data from, and the data we want to collect. We look forward to a constructive engagement with the industry on those matters
The Consumer Financial Protection Bureau (CFPB), Board of Governors of the Federal Reserve System, and Office of the Comptroller of the Currency (OCC) today announced that the threshold for exempting loans from special appraisal requirements for higher-priced mortgage loans during 2018 will increase from $25,500 to $26,000.
The threshold amount will be effective January 1, 2018, and is based on the annual percentage increase in the Consumer Price Index for Urban Wage Earners and Clerical Workers (CPI-W) as of June 1, 2017.
The Dodd-Frank Wall Street Reform and Consumer Protection Act of 2010 amended the Truth in Lending Act to add special appraisal requirements for higher-priced mortgage loans, including a requirement that creditors obtain a written appraisal based on a physical visit to the home’s interior before making a higher-priced mortgage loan.
The rules implementing these requirements contain an exemption for loans of $25,000 or less and also provide that the exemption threshold will be adjusted annually to reflect increases in the CPI-W. If there is no annual percentage increase in the CPI-W, the agencies will not adjust this exemption threshold from the prior year. However, in years following a year in which the exemption threshold was not adjusted, the threshold is calculated by applying the annual percentage change in CPI-W to the dollar amount that would have resulted, after rounding, if the decreases and any subsequent increases in the CPI-W had been taken into account.