Australian finance brokers settled 55.7% of all residential mortgages during the September 2017 quarter, up from 53.6% in the same quarter last year, the latest industry data reveals.
Mortgage and Finance Association of Australia (MFAA) CEO Mike Felton said this represented a record $51.77 billion worth of residential home loans settled by mortgage brokers nationally in the September 2017 quarter, up from $48.57 billion in the September 2016 quarter.
“The broker share of the residential market is now at an all-time record which is reflective of the excellent value and service the broker model delivers,” Mr Felton said.
“The dollar values represent a pleasing 6.6% increase from the September 2016 to the September 2017 quarter,” he said.
The $51.77 billion settled by brokers represented a market share of 55.7% of all residential home loans as a percentage of ABS housing commitments. Comparing the market share on a year-by-year basis, this was an increase of 2.1% from the September 2016 quarter and 3.1% higher than the September 2015 quarter, comparator’s quarterly survey reveals.
“What a great result this was in these market conditions. The results suggest a rising trajectory for the broker-originated lending share and are further evidence of the trust and confidence consumers have in their broker,” Mr Felton said.
“Of course these figures need to be viewed in the context of the growth in broker numbers for the same period which is a statistic that will only be made available in the first quarter of next year but the latest surge in broker market share in both percentage and value terms in extremely positive,” he said.
Research group comparator (a Corelogic business) compiles quarterly broker statistics by calculating the value of loans settled by 19 of the leading brokers and aggregators as a percentage of the ABS Housing Finance commitments. The MFAA releases these statistics each quarter.
Data from the latest Janus Henderson Global Dividend Index reveals that Australia’s banks pay $6 out of every $11 of the country’s dividends each year but dividends are growing slowly given already high payout ratios.
Leading is Commonwealth Bank which raised its per share payout 3.7 per cent on the back of steady profit growth, but National Australia, Westpac and ANZ all held their dividends flat.
CBA and Westpac were identified in the report as the world’s fourth and sixth biggest dividend payers respectively, with Chinese and Taiwanese technology and manufacturing companies taking the top three place.
Overall, Australian dividends typically peaked in the third quarter and this year was no different. Payouts jumped to a record $22.8 billion, up 17.0 per cent on a headline basis, boosted by a stronger Australian dollar. But resources apart, dividend growth in Australia was sluggish.
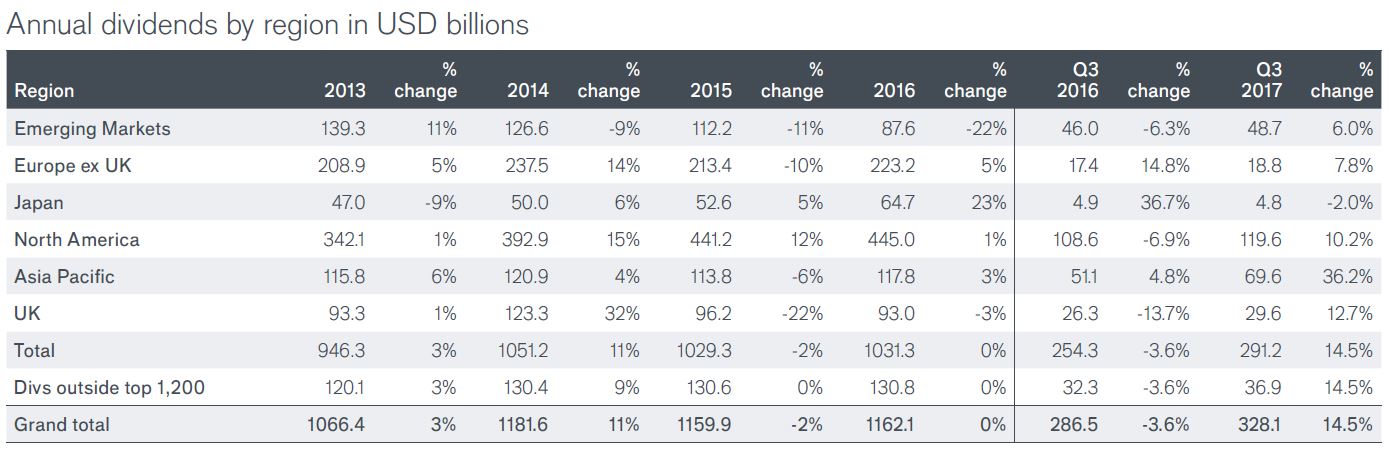
More broadly, the headline growth of global dividends in Q3 2017 jumped by 14.5 per cent to US$328.1 billion and underlying growth was 8.4%, the fastest in nearly 2 years. Data is to 30th Sept 2017.
The Asia-Pacific region led with dividends up 36.2% to $69.6illion, equivalent to an underlying increase of 121%. China Mobile accounted for almost half of the region’s headline increase and three-quarters of Hong Kong’s with a huge $8.4 billion special, the largest single payment in the world in Q3, helping Hong Kong’s total dividends reach a record $25.2 billion.
While every region saw global dividends increase, payment records were broken in Australia, Hong Kong and Taiwan.
They say that after record second and third quarters, the world’s listed companies are comfortably on course to deliver the highest ever annual total this year. They expect 2017 dividends of $1.249 trillion, an increase of 7.4%, which is $91 billion higher than their previous estimate.
The IMF has issued a concluding statement following their official visit to Australia. They warn that growth will be modest, more effort is required to contain housing risks – including macroprudential, and a structural reform agenda is required to lift productivity and growth.
Over the past year, Australia’s recovery under the transition from the mining boom has continued despite setbacks. Domestic demand growth has strengthened, and employment growth has picked up markedly since the beginning of the year, most of it in full-time jobs. But labor market slack remains present, and wage growth has remained weak. Beyond wages, stronger retail competition and continued declines in import prices have contributed to inflation outcomes below the mid-point of the Reserve Bank of Australia’s target range of 2 to 3 percent. With stronger terms of trade, the current account deficit has narrowed substantially and the trade balance has moved into surplus, primarily because of higher global prices for coal and iron ore.
Looking forward, conditions are in place for a pick-up in economic growth to above-trend rates. The improved picture reflects a stronger global outlook, recent stronger employment growth, and a stronger contribution from infrastructure investment with positive spillovers to private investment and the rest of the economy, more than offsetting the declining contribution from dwelling investment. Non-mining private business investment should rebound further, while the drag from mining investment should be ending.
The pickup in growth is likely to be modest, while inflation and wages will be slow to rise. Household consumption is expected to be held back by low real wage growth, given labor market slack and structural change in some sectors. Economic slack is projected to decline gradually. Upward pressure on prices and wages should emerge once the economy has been at full employment, including lower underemployment, for some time.
With stronger momentum in domestic demand and inflation close to the midpoint of the target range not yet secured, continued macroeconomic policy support will remain essential . With a welcome pickup in public investment, the overall fiscal stance is expected to be broadly neutral in 2017 and 2018. With the cash rate at 1.5 percent, monetary policy remains appropriately accommodative. With Australia’s recovery lagging that of other major advanced economies, monetary policy should remain firmly focused on ensuring stronger sustained momentum in domestic demand and inflation.
The Commonwealth government’s budget repair strategy is appropriately anchored by medium-term budget balance targets . The strategy is predicated on a rapid rebound of nominal growth to trend, leading to structural revenue and expenditure improvements. The risk is that with a gradual recovery, the rebound to trend might not be as quick as expected. Australia has the fiscal space to absorb this risk and protect or, if needed, increase the spending envelopes for infrastructure investment, structural reforms supporting trend growth and productivity.
Near-term risks to growth have become more balanced, but large external shocks, including their interaction with the domestic housing market, are an important downside risk. On the positive side, the improved global outlook could lead to a stronger-than-expected recovery, underpinned by a larger pickup in non-mining business investment. On the downside, there is the risk of unexpectedly tighter global financial conditions flowing through to domestic financial conditions in Australia while the economy is still recovering. Australia is also particularly exposed to downside risk from China through its trade links in commodities and services. Domestically, growth in consumer spending could weaken if improvements in household incomes turn out to be more gradual than expected, or if a cooling housing market and high debt to income ratios discourage further declines in household saving rates.
Managing Housing Imbalances and Financial Sector Risks
The housing market is expected to cool, but imbalances—lower housing affordability and household debt vulnerabilities—are unlikely to be corrected soon. In the absence of a major shock to the economy, the cooling is expected to be driven mainly by the building completion rate catching up with demand in the major eastern capital regions. But given continued strong population growth and foreign buyer interest, demand growth for housing is expected to remain robust, and, in the absence of a large inventory of vacant properties, prices should stabilize, rather than fall significantly. Declines in household debt-to-income ratios would thus need to be driven by strong nominal income growth and amortization.
The Commonwealth and States have appropriately used a multi-pronged approach to address increasing housing market imbalances and related systemic risks to banks.
Prudential policies by the Australian Prudential Regulation Authority (APRA) have lowered the risks to the banking sector from their large exposure to the housing market in a low-interest rate environment, primarily through a sequential tightening of required underwriting standards. The latest round involved tighter standards on the origination of interest-only loans, and reinforced a cap on lending growth to investors. On the demand side, some States have helped qualified first-time homebuyers to enter the market, including through grants and exemption from stamp duty. In addition, the Commonwealth is assisting those buyers to build savings more quickly for a home deposit via the superannuation system.
Supply-side policies will be most effective in achieving housing affordability in the longer term. The housing supply response is being strengthened through a variety of measures at the State and Commonwealth levels, increasing the supply of developable land and the efficiency of its use. including higher housing densification. These include ramping up infrastructure spending and reforms to planning and zoning. These steps have appropriately been complemented by measures to provide for increases in the supply of affordable housing targeted to lower- and middle-income households.
Supply-side policies could also help in raising productivity and trend growth. Ensuring longer-term affordability in housing, and location cost more broadly, could lower risks that businesses and people are not able to move to the urban areas where they would be most productive because of agglomeration and other network externalities. This, in turn, would also help lower risks to longer-term growth.
These policy efforts should be complemented by tax reform . Housing-related tax settings can also play a role in strengthening supply and efficient use of land and, in the longer term, should limit potential distortions they might introduce in the demand for property. The State stamp duty tax regimes are inefficient—they have narrow tax bases, and discourage mobility and transactions in existing properties that could have more productive alternative uses. It should be replaced with a systematic land tax regime applying to all residential and commercial properties. As demonstrated by the recent reform in the Australian Capital Territory, the transition can be gradual, which helps to avoid a disruptive impact on State revenues. Cash flow problems for low-income homeowners can be addressed through deferment options.
Prudential reform efforts on lifting banks’ mortgage asset quality are appropriately complemented by reforms refining the capital adequacy framework. In combination with higher capital adequacy and liquidity requirements, tighter mortgage underwriting standards have strengthened banks’ resilience to housing market shocks. APRA is in the process of further refining the capital adequacy framework. In July 2017, it clarified the capital requirements for Australian banks’ to “be unquestionably strong,” as suggested by the 2014 Financial Sector Inquiry. It is also preparing regulations to address the systemic risk from banks’ concentrated exposure to residential mortgages through capital requirements.
Fostering Long-Term Growth Opportunities
Reforms could lift productivity growth . The decline in trend output growth in Australia over the past decade or so was driven mainly by lower labor force growth and lower rates of capital accumulation, both developments reflecting corrections after the mining investment boom which are likely to have run their course. Average productivity growth has picked up recently, primarily because of the transition to higher capital stock utilization in the mining sector. Nevertheless, productivity growth could be lifted by reforms.
There is scope to expand infrastructure spending beyond the recent increase in the fiscal envelope. According to some international metrics, Australia has a notable infrastructure gap compared with many other advanced economies. While the recent boost has helped to narrow the gap, it might not be enough to close it. Further increases in investment have the potential to improve physical and digital interconnectivity, both internally and with Australia’s trading partners, thereby contributing to higher growth.
Fostering innovation, research and workforce skills upgrades, would complement the productivity effects from more infrastructure.
Australia’s research and development (R&D) share of GDP lags other OECD members. But the relatively small scale National Innovation and Science Agenda (NISA) is only funded through FY2018/19. A clear implementation of the upcoming 2030 Strategic Plan for the Australian Innovation, Science and Research System by defining the scope and funding of policy instruments would help strengthen the reach and magnitude from its possible positive productivity externalities.
Flexible labor markets have contributed to relatively smooth adjustment after the end of the mining boom. But with continued structural change and higher under- or unemployment in some age and skill cohorts, defining a longer-term envelope for active labor market policies for workforce re-education and skill upgrades can help raise human capital and labor force participation, such as the levy proposed to maintain the new Skilling Australians Fund.
Productivity and inclusion could also be supported with a broad tax reform package . The Commonwealth government has implemented a reform by lowering the corporate income tax rate for SMEs, with the goal of broadening it to all firms at an even lower rate. A more comprehensive tax reform has the potential to increase efficiency of the tax system, increase investment and labor demand, and reduce inequality. This would entail lowering taxes on income from mobile factors of production (capital and labor) and increasing reliance on taxes on immobile factors of production (land) and indirect taxes on consumption, undertaken in a revenue neutral way. Such a reform would complement the switch to a broad-based tax on land instead of stamp duties already discussed.
Reconsidering broad tax reforms. Concerns about the regressive nature of higher taxes on consumption at a time of low wage growth could be addressed by broadening the base, reducing generous tax concessions (some of which are not means-tested or are limited), and revising the design of the income tax reform. Two developments could encourage reconsideration of tax reform. First, significant corporate income tax reductions in other large advanced economies, which would have capital flow implications of potential concern for Australia. Second, the ongoing Horizontal Fiscal Equalisation Review by the Productivity Commission is reopening consideration of the distribution of GST revenues, which could allow for a broader package for agreement between the Commonwealth and the States.
The proposed areas of reform suggested above could draw further measures from the recent work by the Productivity Commission. In its inaugural 5-Year Productivity Review, the Commission has proposed structural reforms in health, education, urban development, and regulatory aspects of market efficiency. These proposals could define new policy parameters, which could also increase certainty about policy directions for business investment decisions. These would also build upon the recently enacted legislative agenda of the Competition Policy Review (the Harper report) at the Commonwealth level. At the State level, there are still further agreements needed to fulfill the Harper report’s implementation.
A Concluding Statement describes the preliminary findings of IMF staff at the end of an official staff visit (or ‘mission’), in most cases to a member country. Missions are undertaken as part of regular (usually annual) consultations under Article IV of the IMF’s Articles of Agreement, in the context of a request to use IMF resources (borrow from the IMF), as part of discussions of staff monitored programs, or as part of other staff monitoring of economic developments.
The authorities have consented to the publication of this statement. The views expressed in this statement are those of the IMF staff and do not necessarily represent the views of the IMF’s Executive Board. Based on the preliminary findings of this mission, staff will prepare a report that, subject to management approval, will be presented to the IMF Executive Board for discussion and decision.
ASIC says Australia and New Zealand Banking Group (ANZ) and National Australia Bank (NAB) have today entered into enforceable undertakings (EUs) with ASIC in relation to each bank’s bank bill trading business and their participation in the setting of the Bank Bill Swap Rate (BBSW), a key Australian benchmark and reference interest rate.
On 10 November 2017, the Federal Court made declarations that each of ANZ and NAB had attempted to engage in unconscionable conduct in connection with the supply of financial services in attempting to seek to change where BBSW set on certain dates (in respect of ANZ, on 10 occasions in the period 9 March 2010 to 25 May 2012, and in respect of NAB, on 12 occasions in the period 8 June 2010 to 24 December 2012). The Court also declared that each bank failed to do all things necessary to ensure that they provided financial services honestly and fairly.
The Federal Court imposed pecuniary penalties of $10 million each on ANZ and NAB for the attempts to engage in unconscionable conduct in respect of the setting of BBSW. The Court also noted that each of ANZ and NAB will give EUs to ASIC which provides for them to take certain steps and to pay $20 million to be applied to the benefit of the community, and that each will pay $20 million towards ASIC’s investigation and other costs.
Background
ASIC commenced legal proceedings in the Federal Court against ANZ on 4 March 2016 (refer: 16-060MR) and against NAB on 7 June 2016 (refer: 16-183MR). The EUs form part of an agreed resolution to those proceedings.
On 16 November 2017 Jagot J of the Federal Court published her decision in both the ANZ and NAB proceedings ([2017] FCA 1338).
On 5 April 2016, ASIC commenced legal proceedings in the Federal Court against the Westpac Banking Corporation (Westpac) (refer: 16-110MR). These proceedings are ongoing.
ASIC has previously accepted enforceable undertakings relating to BBSW from UBS-AG, BNP Paribas and the Royal Bank of Scotland (refer: 13-366MR, 14-014MR, 14-169MR). The institutions also made voluntary contributions totaling $3.6 million to fund independent financial literacy projects in Australia.
In July 2015, ASIC published Report 440, which addresses the potential manipulation of financial benchmarks and related conduct issues.
The Government has recently introduced legislation to implement financial benchmark regulatory reform and ASIC has consulted on proposed financial benchmark rules.
Two insights. First the LVR distribution (skewed because of the securitisation rules). But her claim “on average, securitised loans appear to be no riskier than the broader population of mortgages, at least on these metrics” is unproven. Second there is an interesting distribution of mortgage rates, between interest-only and principal and interest loans, the latter being significantly higher. There is now a greater proportion of principal-and-interest loans with an interest rate below 4 per cent, due to the lower rates applied to owner-occupier loans, and there has reportedly been increased competition for these types of loans.
Absolutely no discussion on the critical Loan to Income ratios, which should be available in the data!
The dataset includes two types of residential mortgage-backed securities (RMBS): ‘marketed securities’, which have been sold to external investors, and ‘self-securitised’ deals. Self-securitisations are retained by the bank that created them and are used solely to access central bank liquidity. The Reserve Bank accepts self-securitised assets for this purpose for a number of reasons, most notably a shortage of securities considered to have sufficient credit quality and liquidity. However, the Reserve Bank accepts as eligible collateral only the highest credit quality asset-backed securities, that is those with a AAA, or equivalent, rating.
The insights I will talk about today come from the loan-level data underlying these securities. Loans underlying securitisations are not necessarily representative of the entire mortgage market across all its dimensions. In particular, the choice of mortgages in the collateral pool may be influenced by the way credit ratings agencies assign ratings, investors’ preferences and also by the Reserve Bank’s repo-eligibility framework. However, self-securitisations, which represent the bulk of the dataset, cover a significant share of all mortgages in Australia. For this reason, we could expect the mortgages underlying self-securitisations to be more representative of banks’ balance sheets than those of marketed RMBS.
Data are currently received each month (with a one-month lag) on 1.6 million individual mortgages, with a total value of around $400 billion. This accounts for about one-quarter of the total value of housing loans outstanding in Australia. Around 100 data fields are collected for each mortgage, covering a broad range of variables including loan characteristics, borrower characteristics and details on the collateral underpinning the mortgage.
The Securitisation Dataset allows us, along with other investors in asset-backed securities, to undertake a rich analysis of the securities they hold and more accurately assess their risk and pricing than would be possible without this information. In our case, it allows us to undertake our own risk assessment and not be dependent on rating agencies. But the loan-level data also enable us to gain valuable insights into mortgages that are not readily available from other sources. Today I want to share with you some of these insights.
Mortgage Characteristics
So, what do the data tell us about the loans underlying securitisations and so about the risks faced by investors in these securities?
Let’s look at the current size of outstanding mortgages. The average loan size in the dataset is $300,000 (ignoring any funds held in offset balances). Mortgages underlying securitisations appear to be, on average, smaller than the population of all mortgages. This graph shows the distribution of loan sizes (using a histogram) (Graph 1). Each loan is weighted by its balance, such that larger loans are given a larger weight. Weighting the distribution provides a more accurate reflection of potential exposures from a risk perspective. As you can see, there is a wide range in the size of mortgages; by value, 7 per cent of loans have a balance greater than $1,000,000.
Graph 1
Let’s look at owner-occupier and investor loans separately (Graph 2). The distribution of loan size is similar for the two groups but there is a greater proportion of large investor loans. This could reflect the tax incentives for investors to take on and sustain more leverage than owner-occupiers, maximising the amount of funds borrowed and limiting repayments. But it also reflects that investors appear to have a higher ability to pay off larger loans. For each mortgage in the Securitisation Dataset we also have information on the borrower, including their income. We find that borrowers with investor loans typically have higher incomes than those with owner-occupier loans and so have a greater borrowing capacity.
Graph 2
The loan-to-valuation ratio (LVR) is an important indicator of the riskiness of a loan. Here we show the distribution for LVRs based on the current loan balance and the most recent available property valuation for mortgages issued over the past two years (Graph 3). You can see a concentration of loans with LVRs between 70 to 80 per cent – around one-third of loans are in that group – but only a small share of loans have LVRs higher than that. This reflects a few factors. Banks limit loans with LVRs (at origination) above 80 per cent, and these high-LVR borrowers are typically required to pay for lenders’ mortgage insurance. Also, credit rating agencies apply large penalty factors in their credit risk assessments of high-LVR loans in a collateral pool. So it’s not surprising that there are relatively fewer high-LVR loans in the Securitisation Dataset compared with the broader population of loans.
Graph 3
Let’s turn to investor and interest-only loans; these have received some attention from regulators in recent years. This has included measures by the Australian Prudential Regulation Authority (APRA) to tighten lending standards on these types of loans. The next graph shows the share of investor and interest-only loans in the Securitisation Dataset and a measure from APRA that covers the broader housing loan market (Graph 4). The first thing to note is that marketed securities have a lower share of investor and interest-only loans than the general population captured by the APRA data. For self-securitisations, these shares are more closely aligned to the composition of the banks’ total mortgage portfolio. The second point of interest is the very recent large decline in interest-only loan shares in self-securitisations, which is consistent with changes in the broader stock of outstanding mortgages; these declines have occurred alongside measures by APRA to limit new interest-only lending.
Graph 4
To summarise so far, we have looked at a number of characteristics of securitised mortgages that can be associated with the riskiness of these loans, in particular LVRs and whether they are investor or interest-only loans. Two things stand out: there is a wide distribution of these characteristics across different loans and, on average, securitised loans appear to be no riskier than the broader population of mortgages, at least on these metrics.
Mortgage Interest Rates
Variation in interest rates across loans is an important way for lenders to account for the different risks of mortgages. More creditworthy borrowers or lower-risk mortgages are typically offered lower interest rates, while borrowers with higher-risk mortgages would expect to pay higher interest rates. Interest rates on mortgages may also be influenced by other factors such as competition between lenders, bank funding costs, the regulatory environment and policy settings.
There are different types of measures readily available when assessing mortgage interest rates, such as standard variable rates or package rates. However, these measures do not necessarily reflect interest rates actually paid, since banks typically apply unadvertised discounts. Some of the variation in rates actually paid reflects variation in creditworthiness across borrowers. The Securitisation Dataset includes the actual interest rate paid on each mortgage and so can provide both timely and granular insights into housing interest rates that are not available from many other sources.
The next graph shows the distribution of interest rates paid on variable-rate mortgages across different lenders (Graph 5). The major banks offer a wide range of interest rates but the distribution is comparable to smaller banks. There is an even wider range of interest rates offered by non-bank lenders. This wider range to a large extent reflects that this category covers a variety of lenders targeting different types of borrowers and mortgages. There are some non-bank lenders that offer products with a similar level of interest rates to the banks. Other non-bank lenders specialise in providing riskier mortgages, such as to borrowers that require ‘alternative’ or low-documentation loans or have impaired credit histories.
Graph 5
The most common mortgages in the Australian housing market are owner-occupier loans with principal-and-interest repayments. So, let’s look at the distribution of interest rates paid for this type of loan in more detail, focusing on loans of the major banks (Graph 6). On the graph are marked three other interest rate measures. The line on the right is the relevant standard variable rate (SVR). Very few borrowers actually pay the SVR (or a higher interest rate); rather, borrowers are generally offered a discount relative to this reference rate. The discounts offered vary by borrower and lender, and also vary over time.
Graph 6
The second type of interest rate indicated, the middle vertical line in the graph, is the average ‘package’ rate. A typical package mortgage product has additional features beyond the ‘basic’ mortgage (such as an offset account) and may be bundled with other products (such as a credit card). Packages often include advertised discounts. A large share of loans has an interest rate consistent with the average package rate; however, the majority of loans have an interest rate below the average package rate.
The line furthest to the left shows the advertised ‘specials’ rate. Only a small share of loans in the dataset has an interest rate consistent with this lowest advertised rate. This may be because not many borrowers either qualify or seek loans at the advertised specials rate. Another reason is that advertised specials are interest rates on new loans, and new loans have attracted in recent years larger discounts compared with existing loans, as I will discuss later.
For the major banks, the interest rates on most loans are within the range set by the advertised specials rate and the package rate. Preliminary econometric analysis suggests that LVRs and loan size are important determinants of the discount offered to borrowers. Large loans typically have lower interest rates. One factor is that the loan size a borrower qualifies for is correlated with the borrower’s net income, which, in turn, is correlated with a better ability to repay. Also, borrowers seeking larger loans may have more bargaining power to negotiate greater discounts given the fixed costs associated with issuing loans.
The data shown in the distributions can be aggregated to provide a measure for the average outstanding interest rate on existing loans (Graph 7). (You may have seen similar graphs in some of our recent publications; the data underlying these graphs are from the Securitisation Dataset.) The outstanding interest rates on the four main types of mortgages – owner-occupier or investor, and principal-and-interest or interest-only – have changed over the past years partly in response to regulatory measures. These changes are also evident in the variable interest rate loans in the Securitisation Dataset. In the latter part of 2015, investor loans became more expensive compared with owner-occupier loans. This was in response to regulatory measures designed to limit the pace of growth of investor credit. Over the past year, regulatory measures have focused on limiting new interest-only lending. In response, lenders have increased rates on interest-only loans several times while lowering rates on principal-and-interest loans.
Graph 7
The response of the banks to the regulatory changes can also be measured by examining how the distribution of interest rates has changed. Here you can see a stacked histogram (Graph 8). For each interest rate band on the horizontal axes, it shows the share of loans that have either principal-and-interest (blue bars) or interest-only (orange bars) repayments. You can see the large overlap between the two distributions for interest-only and principal-and-interest loans before the introduction of limits on new interest-only lending. There has since been a marked repricing of loans within those two groups in response to the regulatory measures. You can now see a clear separation between the distributions (Graph 9). Interest rates on interest-only loans have increased and the distribution has shifted towards the right, following the large rate increases for both owner-occupier and investor loans in that category. Mortgages with an interest rate below 4 per cent are now almost exclusively principal-and-interest loans.
Graph 8
Graph 9
The distribution of principal-and-interest loans has also changed following the regulatory measures. There is now a greater proportion of principal-and-interest loans with an interest rate below 4 per cent, due to the lower rates applied to owner-occupier loans, and there has reportedly been increased competition for these types of loans.
So far, we have looked at interest rates on all outstanding loans. As indicated earlier, another important measure is the interest rate for newer loans. While changes to SVRs, or reference rates, are directly transmitted to all borrowers with variable-rate loans, interest rates offered to new borrowers may move independently of reference rates depending on lenders’ discounting decisions. In this graph I show estimates obtained from the Securitisation Dataset for the interest rate on recently issued mortgages (Graph 10). As you can see, the average interest rate on new loans has been consistently lower than the interest rate on outstanding mortgages over the past few years. Over the past 12 months, the degree of discounting has in fact increased. This has been the case for both owner-occupier and investor loans. The increase in interest rate discounts offered to new borrowers over the past year suggests that competition for customers is stronger for new borrowers than for existing borrowers. The Reserve Bank has noted the apparent difference in competition for new and existing borrowers in its recent submission to the Productivity Commission’s Inquiry into ‘Competition in the Financial System’.
Graph 10
In this second part of my talk, I have highlighted three insights that we have gained from the dataset on mortgage interest rates actually paid by different borrowers and how they vary over time. First, as is the case with the size and LVRs of mortgages, there is a wide distribution of interest rates paid across different types of mortgages and borrowers. Second, in response to recent regulatory measures, these distributions have changed. And third, we have found that advertised and unadvertised discounts to reference rates are commonplace. These discounts have increased in recent years, such that new borrowers often pay lower interest rates than existing borrowers for similar types of mortgages.
The Government view is high home prices is ultimately driven by lack of supply, relative to demand, including from migration. So the solution is to build more (flick pass to the States!). It has nothing to do with excessive debt, nor does the fact the average number of people per home is falling signify anything. And tax policy is not the problem.
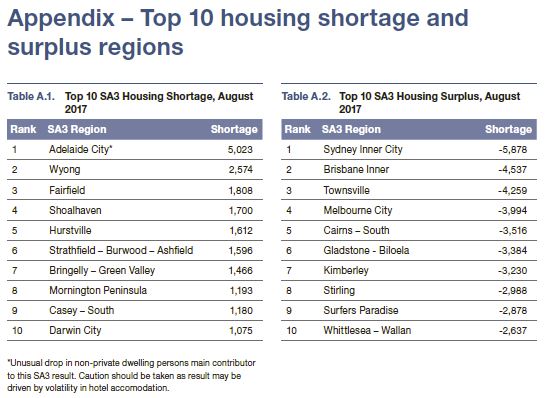
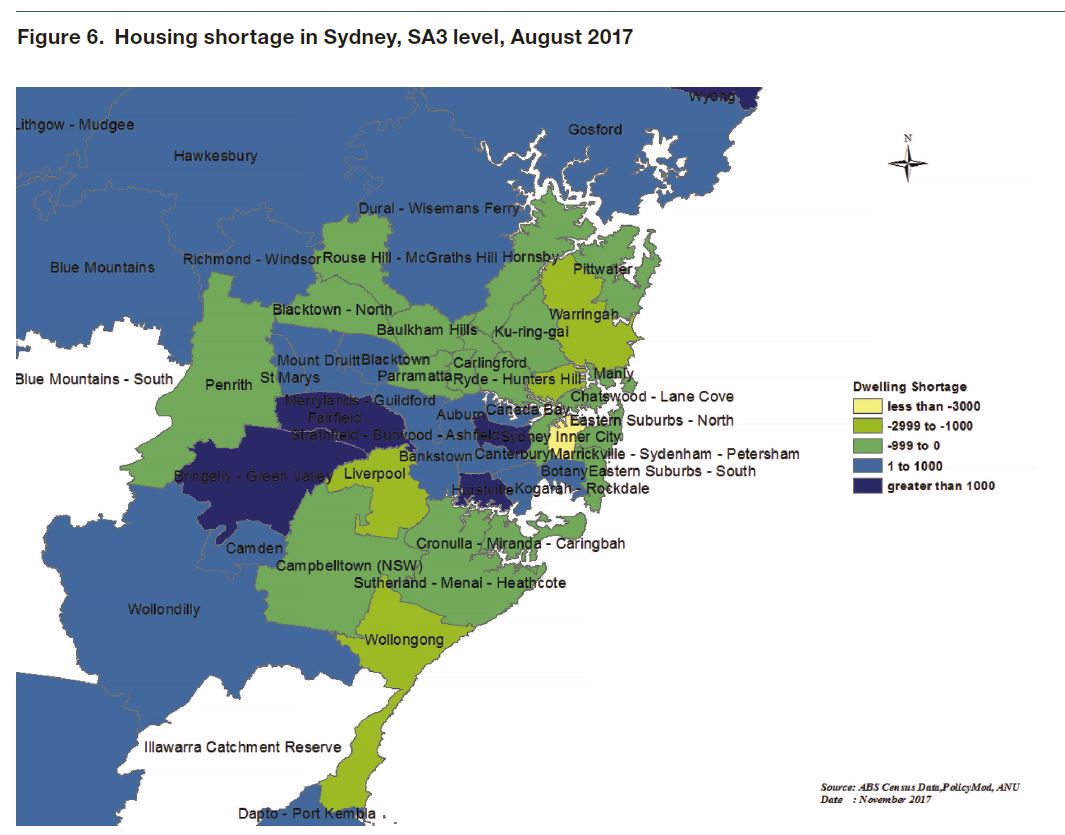
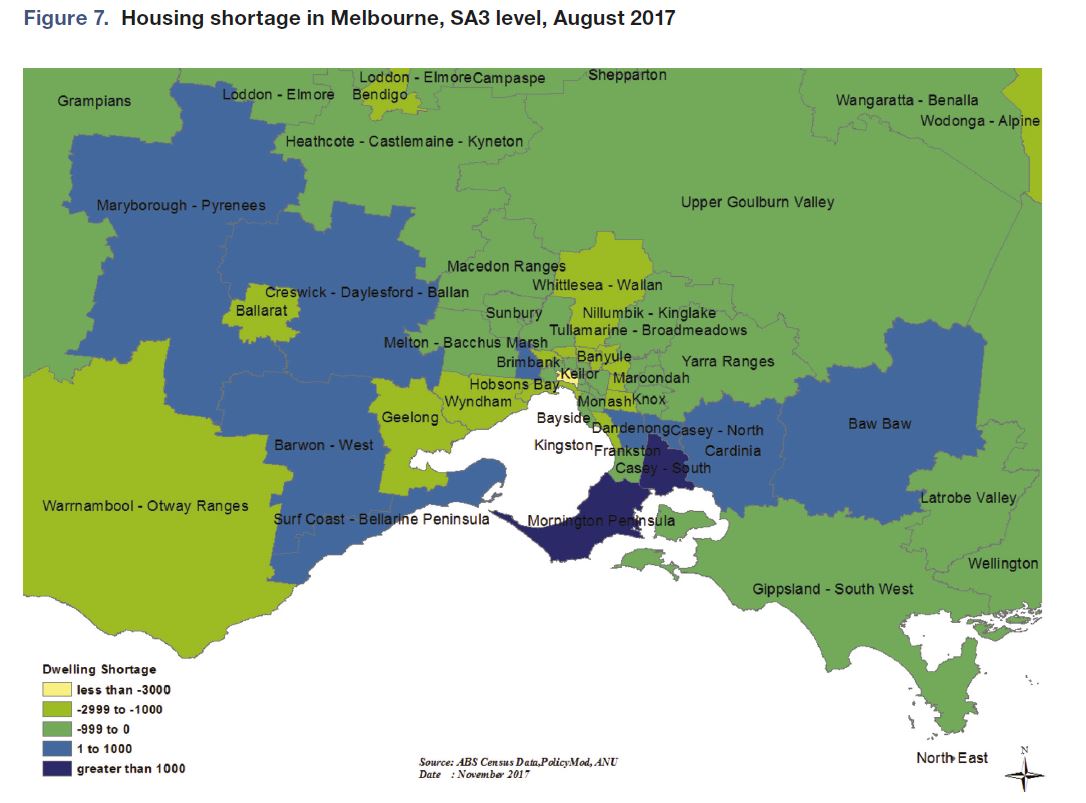
However, a new working paper “Regional housing supply and demand in Australia” from the ANU Center for Social Research and Methods blows a mighty hole in that mantra. They suggest that demand factors (availability of loans, tax concessions etc.) have a significant impact, while demand and supply equilibrium varies significantly across different regions, with some hot spots, and some where vacant property exists (yet prices remain high, because of these demand factors). Significantly, much of the surplus is in areas where high-rise development has been strong. We think this may signal further downward pressure on prices in these areas.
Over the year to June 2017 Australia built nearly 220,000 dwellings. Construction rates of units and other attached housing have more than doubled this decade, with around 103,000 units, townhouses and terrace houses completed in the latest financial year. Most of these completions are high-rise units in Australia’s capital cities (which is why the average home size is falling). Detached house completions have also trended up in recent years, but the growth has been more modest. This paper accounts for differential in the type of stock being built, with detached housing supporting a greater number of persons per dwelling than units and townhouses.
The paper measures the gap between housing supply and demand at
a regional level in Australia. They have taken into account a range of complicating factors such as changing demographics, building types and the increase in unoccupied dwellings at the regional level.
Previous research efforts in Australia focus on national estimates of the housing ‘gap’ or shortage but here we recognise that housing markets tend to be regional and that house price movements and affordability are likely to be as influenced by local demand and supply conditions as by broad national conditions.
Between the years 2001 and 2017, we estimate the Australian housing market experienced an oversupply of 164,000 dwellings. However, there are significant regional differences with some regions experiencing significant undersupply while others have significant housing surpluses.
Nationally, we do find periods of significant undersuppy, particularly between 2007 and 2014 but for other periods beyond 2001 we find oversupply more than compensated.
The majority of Australia’s housing surplus is situated in the inner-city areas of its major capitals, with Inner Brisbane, Melbourne and Sydney all oversupplied due to recent strong growth in unit developments. Many regional centres, particularly those in mining-sensitive areas such as North
Queensland and Western Australia, also retain housing surpluses.
Many regions in the middle and outer rings of our major capital cities, particularly Sydney, face modest housing shortages.
The modelling suggests that there is some evidence, albeit relatively weak, that a housing shortage is associated with higher house price growth.
The analysis exclusively concerns the concept of underlying demand, recognising that this may not be representative of the demand for housing in a traditional economics sense. The paper also acknowledges the limitations of the analysis in terms of both its conceptual basis and the data it relies on.
This paper does not conclude that people’s housing needs are being met or that what is being supplied is at an affordable price point for all families.
The lack of a housing shortage may have significant implications for housing policy in Australia and the economy more broadly. If Australia’s current record home-building levels are not balanced by a large housing shortage, then there is the risk that these current levels will reduce in the near future. Policy makers will also need to place greater emphasis on other potential drivers of house price growth and housing affordability, such as a range of demand influences.
Further confirmation today that Sydney is leading the property market lower, based on the preliminary auction results from CoreLogic.
The combined capital cities returned a preliminary auction clearance rate of 65.4 per cent this week across 3,335 auctions making it the third busiest week for auctions so far this year, increasing from 62.8 per cent across 2,907 auctions last week. This time last year, 2,987 homes were taken to auction and a clearance rate of 74.4 per cent was recorded.
The final clearance rate has remained below 65 per cent for the last 4 weeks and it’s likely that this will be the case again on Thursday when the final results are released. One of the biggest contributors to the softer auction market conditions is Sydney, where the final clearance rate has remained below 60 per cent since the last week of October, while Melbourne has slipped below 70 per cent for the second week in a row.
RBA Head of Financial Stability Jonathan Kearns, spoke at Aus-China Property Developers, Investors & Financiers today. He said the Bank has responsibility to promote the stability of the financial system as a whole so carefully monitors property markets because poor commercial property lending and the large stock of residential property debt means risks to financial stability and household resilience.
The high valuation of commercial property increases the potential for a sharp correction and so the risks from commercial property lending. The high level of household mortgage borrowing also brings risks, both for lenders and households.
He also discussed the impact of purchases and financing by foreigner investors and banks. Nationally, purchases by foreign buyers are equivalent to around 10-15 per cent of new construction, or about 5 per cent of total housing sales. But he said, these purchases by foreign buyers do not, on the whole, reduce the supply of dwellings available to local residents and in fact may actually contribute to expansion of the housing stock. However, these purchases by foreign buyers, particularly for investment purposes, are a more recent phenomenon and so their impact on the housing cycle is less clear.
Property and Financial Stability
The property market is important for financial stability for a number of reasons. In the past, banks have experienced substantial losses on their commercial property lending because of its large cycles. Residential property is also important for financial stability because residential mortgages account for a very large share of banks’ lending in Australia. Because of the high value of households’ mortgage debt and housing assets, the property market also has implications for the resilience of households’ balance sheets. Today, I will outline the connection of financial stability with commercial property, and then with residential property.
Internationally, banks experienced substantial losses on their commercial property lending in the financial crisis. In Australia the performance of commercial property lending also deteriorated, but losses were relatively moderate.
Graph 1
However, Australia does have its own history in the early 1990s of large losses on commercial property lending, resulting in individual lenders needing to be rescued and threatening the stability of the financial system. In five years, Australian banks experienced losses of around 10 per cent of their loans, concentrated in their commercial property lending.
This was a classic boom-bust or ‘hog cycle’ story. The second half of the 1980s saw buoyant economic conditions, strong growth in commercial property prices and a large increase in commercial property construction.
A ready supply of credit fuelled the boom. Following bank deregulation and the entry of foreign banks into the domestic market in the mid 1980s, the domestic banks competed to hold on to their market share. Lending standards were lowered and business credit grew by around 25 per cent each year in the second half of the 1980s. With the economy overheating, monetary policy was tightened. Increased interest payments and the economy falling into recession resulted in rising losses on business lending. Office prices halved from their peak as construction initiated in the late 1980s added to supply in an already falling market. Losses mounted at banks with two having to be rescued, and one major bank needing to raise capital.
As notable as this episode seems, it follows a script that had played out before domestically and has since internationally. There are several aspects to commercial property lending that make it inherently risky, and typically more risky than residential mortgage lending. A large share of banks’ commercial property lending is for construction and development, including for large apartment buildings. Construction and development loans tend to be riskier because the property isn’t yet earning rent, things can go wrong in the often complex construction phase, and market conditions can change in the several years or more it takes to complete large projects. Losses can also be greater on lending for commercial property than for residential property because borrowers with a limited liability company structure have less incentive to repay than individual residential mortgage borrowers who face full recourse.
Adding to the risk is that the availability of finance for commercial property has tended to be pro-cyclical. A booming property market has often led to an easing of both lending standards and borrowers’ collateral constraints just as demand for funding is rising. Relative to residential property, the greater ability for funding to come from outside established lenders adds to this cyclicality. Commercial property lending can be syndicated and large individual projects make it easier for new banks to enter the market at a relatively low cost. This cyclicality of lending can accentuate the cycles in commercial property construction and prices.
Foreign investors may add to the cyclicality of the commercial property market if they tend to enter the market when prices have been rising and there are more properties for sale. Alternatively, if foreign investors’ decisions are largely influenced by conditions in their home country rather than the domestic market they may actually moderate the domestic property cycle. Foreign banks direct links to domestic banks tend to be small, so their impact on the domestic financial system is likely to be indirect through an amplification of the credit cycle and property market.
Historically, residential property lending has been less risky for banks than commercial property lending. Indeed, the stress test conducted by APRA indicated that Australian banks have sufficient capital to survive a deep recession and a collapse in the housing market. However, the sheer size of mortgage lending on Australian banks’ books means that residential loan performance is critical to banks’ health and so the stability of the broader financial system. Housing debt is also important for the resilience of the household sector in Australia. The ratio of household debt to income is high in Australia relative to other advanced economies, and has edged higher since the financial crisis.
In Australia, unlike many other countries, individual households also borrow to directly purchase investment properties, which may add to risk. More than one-in-ten tax payers owns an investment property. Most of these are geared, so much so that the majority do not earn positive income for their owners. While these borrowers generally start with smaller loans, and most of the debt is held by high-income households, they have less incentive to pay down their mortgage ahead of schedule because of the tax benefits of debt and so tend to retain higher mortgage balances over the lifetime of the loan.
Despite the high level of mortgage borrowing, various factors mitigate the risks to the financial system. Housing debt is mostly well secured. Limits on the maximum loan-to-valuation for mortgage lending and house price appreciation over time mean that existing borrowers generally have a large amount of equity in their homes. In addition, the ability of Australian borrowers to make excess payments on their mortgage, and that this is a tax effective way for owner occupiers to save, means that borrowers tend to accumulate large pre-payments (‘mortgage buffers’). Close to two-thirds of loans have such pre-payments, which collectively amount to two and half years of scheduled mortgage repayments at current interest rates.
As with commercial property, foreign buyers of residential property could amplify cycles or transmit foreign shocks. Non-residents purchasing Australian real estate as an investment may choose between different countries based on expected returns, which can increase the correlation of the Australian market with other countries. Changes in economic and regulatory conditions in foreign buyers’ home countries can also be transmitted to their demand for Australian property. But if purchases of residential property by foreign buyers mainly depend on conditions in their home country, their participation could actually have a moderating impact on the Australian housing cycle.
Having explained why we take a significant interest in the property market from a financial stability perspective, I would now like to provide an update on recent developments in the commercial and residential property markets and the role that international investors, finance and developers have played.
Commercial Property
One part of the commercial property sector that the Reserve Bank has been watching closely is loans for the development of residential property. The surge in apartments recently completed and under construction in the major cities raises the risk of price falls. The construction of new apartments has been largest relative to the existing stock in Brisbane and inner-city Melbourne, though it is largest in absolute numbers in Sydney.
Prices for other types of commercial property have risen sharply with a strong increase in demand from international investors seeking the relatively high yields available on Australian commercial property. Exceptionally low long-term interest rates globally have pushed up valuations for property and other assets, all the more so because relatively strong and stable global economic growth in the past few years has reduced investors’ perception of the current risks. While there has not been a surge in construction, the run up in commercial property prices raises the risk of a sharp correction, for example if there is a change in sentiment or a pick-up in long term interest rates.
Graph 2
Commercial office markets have been strongest in Sydney and Melbourne with low vacancy rates and rising prices. In contrast, conditions have been weaker in Perth where vacancy rates increased sharply with the downturn in the state economy from the decline in mining investment.
Conditions in retail property markets have also been relatively subdued across Australia. In part, this reflects strong competition in the retail sector from new entrants and online retailers. However, banks have continued to grow their lending for new retail developments and refurbishments with an increased focus on entertainment, hospitality, services and mixed residential.
Overall, Australian banks have tightened their lending conditions for commercial property in recent years. Restrained lending by Australian banks has provided an opportunity for new entrants into the market. Asian banks have grown their commercial property lending sharply, more than doubling their market share in just two years, although it remains relatively small. This strong growth in commercial property lending by Asian banks is reminiscent of European banks’ growth in the lead up to the financial crisis. However, whereas Australian banks eased their lending standards in that pre-crisis period in order to compete, this time Australian banks do not appear to have eased lending standards.
Graph 3
Residential Property
The Australian residential property market has been strong in the post-financial crisis period as interest rates have been kept low to support economic activity and to boost low inflation. Since 2009, national housing prices have risen by around two thirds and growth of housing credit has outpaced that of incomes. By 2014, concerns grew about the risks from an increase in riskier types of lending, including interest-only loans and investor lending at high loan-to-valuation ratios as well as rising household indebtedness. In response to these concerns, the Australian Securities and Investments Commission (ASIC) increased its scrutiny of lending practices and APRA implemented several macro prudential measures in late 2014 and then again in early 2017, on both occasions after consultation with the Council of Financial Regulators, which the Governor of the Reserve Bank chairs. There are several aspects to these regulatory measures. For each authorised deposit-taking institution (ADI), the growth of investor housing lending has been capped at 10 per cent. Interest-only loans can be no more than 30 per cent of new mortgage lending. In addition, APRA has been monitoring high loan-to-valuation mortgage lending and instructed lenders to pay closer attention to loan serviceability criteria, such as the interest rate buffer applied to the current low mortgage rates and borrowers’ expenses.
These measures have played a role in reducing the build up in risks from household borrowing. Lenders responded to the restrictions by increasing their interest rates for interest-only loans and investor lending. In response, the share of new loans that are interest-only has been falling, and overall investor credit growth has remained below the 10 per cent threshold. Many existing borrowers have also switched their interest-only loans to principal-and-interest loans and there has been a decline in the share of new loans at high loan-to-valuation ratios.
While riskier types of lending have moderated, and investor credit growth has slowed, the pace of overall housing credit growth has been fairly stable this year as borrowing by owner-occupiers has picked up. Conditions in the housing market have eased, particularly in Sydney where prices had experienced strong growth and are particularly high, possibly giving lending restrictions greater impact in Sydney. In Melbourne, conditions remain stronger than in other capital cities. On the other side of the country, and at the other end of the spectrum in terms of housing market conditions, the Perth housing market remains weak. Prices have fallen gradually over the past two to three years, with rents also falling as the rental vacancy rate has increased to its highest level since 1990.
The strong demand driving housing price growth reflected not only low interest rates but also strong population growth. With rising demand and prices, dwelling investment increased strongly. A notable feature of the recent dwelling construction cycle has been the marked increase in the share of higher density construction, a helpful response to the shortage of well-located land in Australia’s large cities. Approvals for new higher density dwellings went from being less than half those of detached dwellings less than a decade ago to being almost on par in recent years. But the longer time to build higher-density dwellings than detached houses increases the risk that a large number of new dwellings could be completed just as the housing market turns down, so amplifying the housing cycle.
Graph 4
This surge in apartment construction has been largest in Sydney, but has also been notable in Melbourne. While the number of apartments being built in Brisbane has been smaller compared to its population, it has been greater relative to the existing stock of apartments. Peak apartment completion in Brisbane is expected to occur this year, capping a three-year period in which the number of apartments has increased by over one-third from the stock in 2015. Perth has also seen strong growth in a relatively small stock of apartments.
This change in the composition of the housing stock is resulting in a rebalancing of relative prices, with prices for detached dwellings growing faster than those for apartments in the major cities over the past five years. In the weaker housing markets of Brisbane and Perth, this has seen apartments experience small price falls in recent years. To date, despite valuations for some apartments at settlement being lower than the purchase price off the plan there have not been widespread reports of higher rates of settlement failure or any notable increase in arrears or losses for banks.
Purchases by foreign buyers have received considerable focus in recent years. Non-residents are able to purchase newly constructed dwellings in Australia, while temporary residents, such as those in Australia for work or study, are able to purchase an existing dwelling for their primary residence. It has been hard to get a firm estimate of how large these purchases are, but drawing on a range of sources, it seems that, nationally, purchases by foreign buyers are equivalent to around 10-15 per cent of new construction, or about 5 per cent of total housing sales. The share of new construction purchases is highest in Melbourne and Sydney. It is also higher for apartments, but it is still only perhaps around one-quarter of newly built apartments. Many foreign buyers come from China, seemingly around three-quarters. Purchases of new properties by foreign buyers have eased over the past year, reportedly because of stricter enforcement of Chinese capital controls and tighter access to finance for foreign buyers.
Purchases by foreign buyers do not, on the whole, reduce the supply of dwellings available to local residents and in fact may actually contribute to expansion of the housing stock. Foreign buyers in Australia for work or study would have been renting if they did not purchase. Other foreign buyers rent the property as an investment and so contribute to the rental stock. Also, there are some new developments that only proceed because they get high pre-sales from foreign buyers.
The strength of the Australian property market, and the participation by foreign buyers, has also enticed some foreign developers to Australia for specific projects, but overall they remain a small part of the market. Foreign banks also have a very small role in residential property lending in Australia.
Given their significance for financial stability, the Reserve Bank carefully monitors property markets. History has taught us that commercial property lending can result in substantial losses for banks. And the large stock of residential property debt means that it too is important for financial stability and household resilience.
The high valuation of commercial property, which is common to many other assets, increases the potential for a sharp correction and so the risks from commercial property lending. The high level of household mortgage borrowing also brings risks, both for lenders and households.
Purchases and financing by foreigner investors and banks have been prominent in the current commercial property cycle. We have seen this before and are well aware of the impact this can have on the cycle. The increased purchases of dwellings by foreign buyers, particularly for investment purposes, are a more recent phenomenon and so their impact on the housing cycle is less clear.
APRA has investigated commercial property lending standards to ensure these are not eroded, while measures by APRA and ASIC aim to reduce the riskiness of new residential lending. And the Reserve Bank, with its mandate for overall financial stability, will continue to closely monitor risks from property markets and lending.
The RBA published the Payments System Board Update: November 2017 Meeting on Friday. Of special note are comments about least-cost routing for transactions using dual-network debit cards, as eftpos routing is on average lower than the Debit MasterCard and Visa Debit systems. They fired a shot across the bow of the industry, saying if the banks won’t implement default lowest-cost routing, the RBA could regulate. The industry will continue to drag its feet.
In fact if you have a card with multiple payment functions (like credit card and eftpos) on a single card, many pay wave terminals will default to the credit card option, unless you insert the card and choose eftpos or your change your defaults. This generates higher merchant fees, and revenues to the card providers and banks. This should also be addressed.
Recent trends in payment card fraud and various industry initiatives aimed at tackling it. Members observed that there had been a significant increase in card-not-present fraud over recent years. Fraud is costly to merchants and other participants in the payments system and can undermine trust in electronic payments. The Board agreed that addressing this rise in fraud should be a priority for the industry. Members welcomed the various initiatives already underway and encouraged industry participants to work together to expedite an effective solution.
The cost of payments to merchants. The Board observed that there was a modest decrease in average merchant service fees in the September quarter, with the new interchange standards having taken effect on 1 July. The Board was briefed on data showing the distribution of payment costs for merchants. These data indicate that payment costs are typically higher for smaller merchants, and confirm that debit cards are generally less costly for merchants than credit cards, with eftpos being a lower-cost system on average than the Debit MasterCard and Visa Debit systems. The Board strongly supported calls from a range of stakeholders for acquirers to provide merchants with least-cost routing functionality for contactless transactions using dual-network debit cards. It requested the Bank staff to continue to engage with the payments industry on this issue, recognising that a prompt industry solution was preferable to regulation.
Recent developments in the ATM industry including the decisions by a number of banks to remove the fees charged to non-customers on ATM transactions. Members noted that ATM coverage is relatively high by international standards, and that the number of ATMs in Australia had reached a record high while the number of transactions at ATMs was declining. In this context, they agreed there may be scope for consolidation or fleet rationalisation that results in a more efficient and sustainable ATM industry while still maintaining broad access to ATMs.
The staff’s assessment of LCH Ltd’s SwapClear Service, a UK-based clearing and settlement facility licensed to operate in Australia. The Bank will provide the assessment report to the Assistant Treasurer and the Australian Securities and Investments Commission, as well as making its findings available to overseas counterparts with a supervisory interest in LCH Ltd, after which the assessment report will be published on the Bank’s website.
The Board also approved a minor technical variation to the interchange standards which will be published next week. Bank staff have consulted informally with acquirers and schemes who have indicated that this change may result in a reduction in compliance costs.
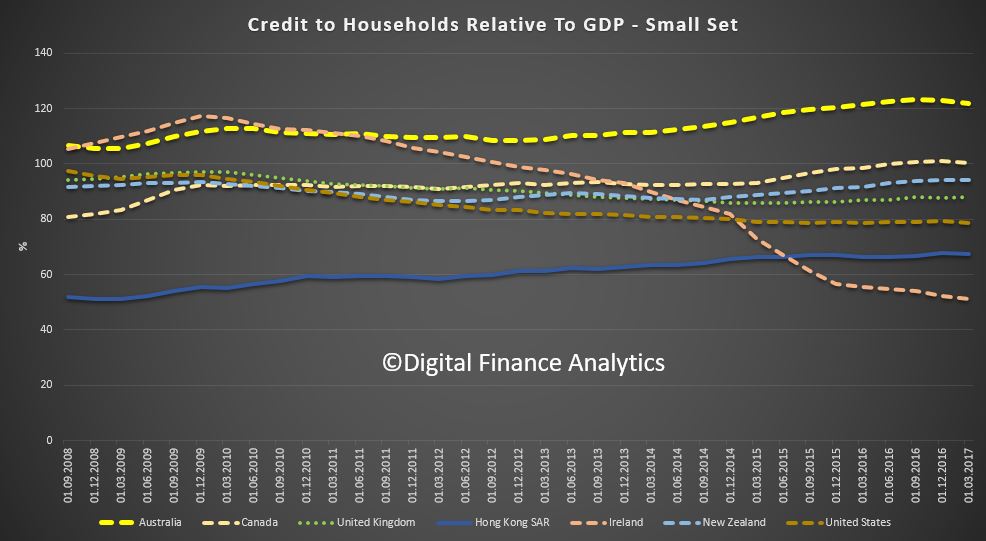
The long comparative data series from the Bank for International Settlements provides a useful and well documented relative comparisons across countries and over time. They are careful to compare like with like!
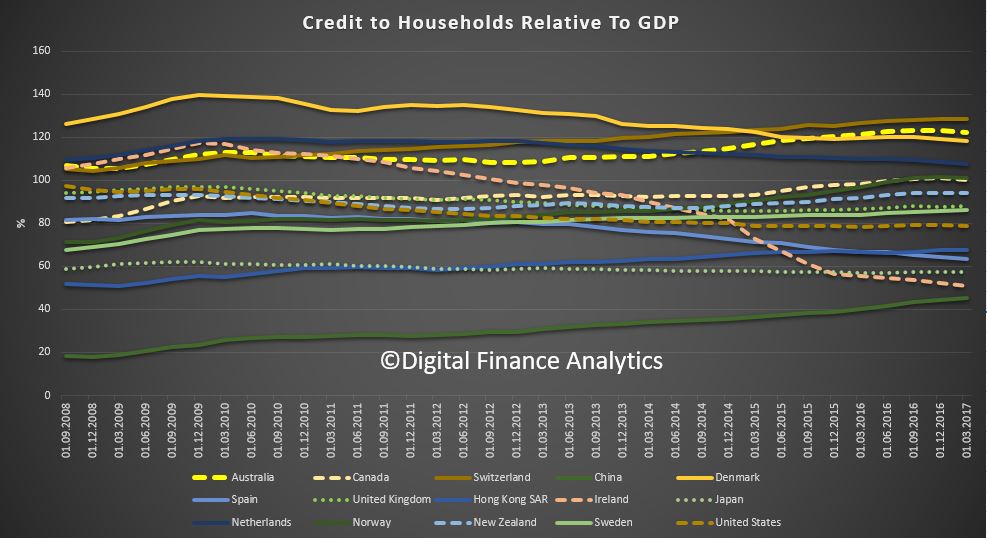
If we then add in the range of other economies (which I accept makes the chart more complex), we find that only Switzerland has a higher ratio. Even those Scandinavian countries with high ratios and high home prices are below Australia. Interesting then that household wealth, according to the recent survey, was highest in Switzerland, then Australia, thanks to high home values (but of course supported by very high debt).