The ACT Is Another Country

The ABS has released their analysis of individual state accounts to Jun 2017.

This includes an estimate of average gross household disposable income per capita. The variations across states are significant and interesting. Of note is the astronomical value, and trajectory of individuals in the ACT, relative to everywhere else.  In addition, we see a decline in gross incomes in WA (one reason why mortgage defaults are rising there).

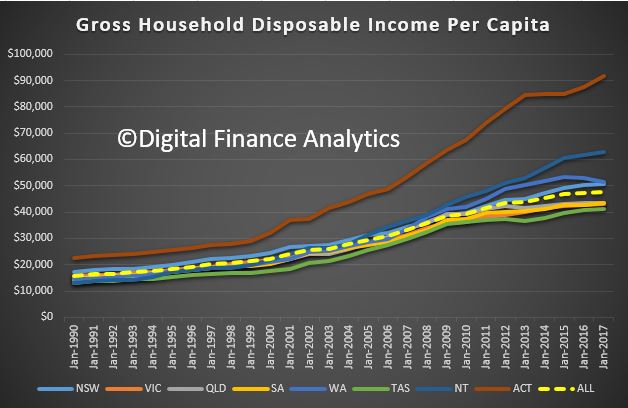
Households in TAS and SA are, on average on the lower rungs. The slowdown in income growth is also visible.

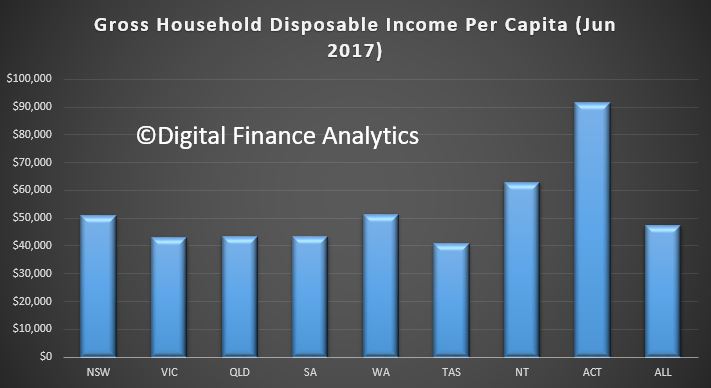
This goes a long way to explaining the high current levels of mortgage stress we observe, because home prices, mortgages and credit growth are all rising faster than income. NSW and VIC, then QLD are worse hit.


RMBS Mortgage Arrears Lower Again, But…

S&P Global Ratings said RMBS Mortgage arrears fell to 1.08% in September across Australian down from 1.10% in August 2017.

They say mortgage arrears rose in both the Northern Territory and the ACT during September but fell elsewhere. While the ACT tops the list with a rise mortgage arrears it is only at a low 0.64%, compared with Western Australia who has the highest arrears of 2.21%.

However, while outstanding loan repayments on 30-to-60-day arrears also declined in most states between January and September, 90-day+ arrears  rose in Western Australia and Queensland. This is the same as we saw recently in the bank reporting season.

S&P said the growth in full-time jobs is positive for mortgage arrears. In addition, the rises rates on in more risky investor loans have minimal impact on RMBS.

This is a myopic view of mortgage portfolios as securitised loans are selected, and seasoned to manage risks. To that extent, it is not necessarily a good indicator of the wider market – including investor loans.

S&P expects arrears to rise over the coming months, as they “traditionally start to increase in November and continue through to March.”

This from Macquarie shows the trends.


Assessing China’s Residential Real Estate Market

The IMF just published a working paper examining real estate in China.

After a temporary slowdown in 2014-2015 China’s real estate market rebounded sharply in 2016. As signs of overheating emerged, the government turned to tighten real estate markets through a range of macroprudential and administrative measures. Many empirical studies point out that the house price surge is driven by fundamentals, while others consider the pickup of real estate activity is unsustainable. This paper uses city-level real estate data to estimate the range of overvaluation of real estate markets across city-tiers, and assesses the main risks of a real estate slowdown and its impact on economic growth and financial stability.

Real estate has been a key engine of China’s rapid growth in the past decades. Real estate investment grew rapidly from about 4 percent of GDP in 1997 to the peak of 15 percent of GDP in 2014, with residential investment accounting for over two thirds of the total real estate investment.

Bank lending to the sector makes up 25 percent of total bank loans, about half of all new loans in 2016, and banks’ increasing exposures to real estate, including through property developers and household mortgages, may pose financial stability concerns. Real estate also has strong linkages to upstream and downstream industries (about a quarter of GDP is real-estate related).2 In addition, land sales are a key source of local public finance, accounting for about 30 percent of local government revenue in 2016, while general government net spending financed by land sales is about 9 percent of the headline revenue in 2016. There has been a rapid expansion of government subsidies on social housing, consisting of nearly 6 million apartment units in 2015-2017.

Real estate markets vary significantly in China because of its large economic size, economic and social diversity, and fragmented local government policies. The real estate cycles tend to be more pronounced in top-tier cities in terms of price volatility, but they account for a small fraction of real estate inventory and investment.  Smaller cities constitute over half of residential real estate investment, but the price increase on average was much lower during 2013-16.

Distortions render China’s property market susceptible to both price misalignment and overbuilding. On the supply side, the market is distorted by local governments’ control over land supply and their reliance on land sales to finance spending. On the demand side, the market is prone to overvaluation—housing is attractive as an investment instrument given a history of robust capital gains, high savings, low real deposit interest rates, a lack of alternative financial assets, as well as capital account restrictions.

The government has closely monitored real estate activity given its importance in the economy. Policies are highly decentralized, with local governments (often with local branches of the financial regulators) deciding land sale and infrastructure development, granting construction and sales permits to developers, and setting purchases restrictions. The central government and financial regulators can also affect the housing market through financing conditions and macro-prudential tools for mortgage lending.

If house prices rise further beyond “fundamental” levels and the bubble expands to smaller cities, it would increase the likelihood and costs of a sharp correction, which would weaken growth, undermine financial stability, reduce local government spending room, and spur capital outflows. Empirical analysis suggests that the increasing intensity of macroprudential policies tailored to local conditions is appropriate. The government should expand its toolkit to include additional macroprudential measures and push forward reforms to address the fundamental imbalances in the residential housing market.

Note: IMF Working Papers describe research in progress by the author(s) and are published to elicit comments and to encourage debate. The views expressed in IMF Working Papers are those of the author(s) and do not necessarily represent the views of the IMF, its Executive Board, or IMF management.

Where Do Consumers Fit in the Fintech Stack?

An excellent speech from Federal Reserve Governor Lael Brainard on the opportunities for innovation in customer facing services enabled by the digital revolution and the risks arising – specifically looking at “financial autopilots”.

As we have been highlighting, the evolutionary path is changing fast, see, our “Quiet Revolution” report, published just this week.  We track this path using our innovation life cycle mapping, updated below.

Here is the Governor’s speech:

The new generation of fintech tools offers the potential to help consumers manage their increasingly complicated financial lives, but also poses risks that will need to be managed as the marketplace matures.

In many ways, the new generation of fintech tools can be seen as the financial equivalent of an autopilot. The powerful new fintech tools represent the convergence of numerous advances in research and technology–ranging from new insights into consumer decisionmaking to a revolution in available data, cloud computing, and artificial intelligence (AI). They operate by guiding consumers through complex decisions by offering new ways of looking at a consumer’s overall financial picture or simplifying choices, for example with behavioral nudges.

As consumers start to rely on financial autopilots, however, it is important that they remain in the driver’s seat and have a good handle on what is happening under the hood. Consumers need to know and decide who they are contracting with, what data of theirs is being used by whom and for what purpose, how to revoke data access and delete stored data, and how to seek relief if things go wrong. In short, consumers should remain in control of the data they provide. In addition, consumers should receive clear disclosure of the factors that are reflected in the recommendations they receive. If these issues can be appropriately addressed, the new fintech capabilities have enormous potential to deliver analytically grounded financial services and simplified choices, tailored to the consumers’ needs and preferences, and accessible via their smartphones.

Consumers Face Complex Financial Choices
When the first major “credit card,” the Diner’s Club Card, was introduced in 1949, consumers could only use the cardboard card at restaurants and, importantly, only if they paid the entire amount due each month. Today, the average cardholder has about four credit cards, and the Federal Reserve Bank of New York estimates that American consumers collectively carry $785 billion in credit card debt.

When signing up for a credit card, consumers face a bewildering array of choices. Half of consumers report that they select new cards based on reward programs, weighing “cash back” offers against “points” with their credit card provider that may convert into airline or hotel “miles,” which may have varying values depending on how they are redeemed. In some cases, rewards may apply to specific spending categories that rotate by quarter and require that consumers re-register each term, and the rewards may expire or be forfeited under complicated terms.

In some cases, the choices may be confusing. Let’s take the example of zero percent interest credit card promotions. A consumer may choose a zero percent interest credit card promotion and expect to pay no interest on balances during a promotional period, after which any balances are assessed at a higher rate of interest going forward. But if a consumer instead chooses a zero percent interest private-label credit card with deferred interest and has a positive balance when the promotional period expires, interest could be retroactively assessed for the full time they held a balance during the promotional period. Even sophisticated consumers could be excused for confusing these products.

As it turns out, it is often the most vulnerable consumers who have to navigate the most complicated products. For instance, one recent study of the credit card market found that the average length of agreements for products offered to subprime consumers was 70 percent longer than agreements for other products.

The complexity multiplies when we go beyond credit cards and consider other dimensions of consumers’ financial lives. The Federal Deposit Insurance Corporation has found that nearly a quarter of the Americans that don’t maintain bank accounts are concerned that bank fees are too unpredictable. Even though mortgage debt is over two-thirds of household debt, nearly half of consumers don’t comparison shop before taking out a mortgage. Student loans now make up 11 percent of total household debt, more than twice its share in 2008. Over 11 percent of student debt is more than 90 days delinquent or in default–and researchers at the Federal Reserve Bank of New York estimate that this figure may understate the problem by as much as half.

Today, consumers navigate numerous weighty financial responsibilities for themselves and their dependents.  It seems fair to assume they could use some help managing this complexity. In the Federal Reserve Board’s annual Survey of Household Economics and Decisionmaking (SHED), more than half of respondents reported that their spending exceeded their income in the prior year.  Indeed, 44 percent of SHED respondents reported that they could not cover an emergency expense costing $400 without selling something or borrowing money.

New Tools to Help Consumers Manage Their Finances
Given the complexity and importance of these decisions, it is encouraging to see the fast-growing development of advanced, technology-enabled tools to help consumers navigate the complex issues in their financial lives. These tools build on important advances in our understanding of consumer financial behavior and the applications, or “app,” ecosystem.

Researchers have invested decades of work exploring how consumers actually make decisions. We all tend to use shortcuts to simplify financial decisions, and it turns out many of these can prove faulty, particularly when dealing with complex problems.  For example, empirical evidence consistently shows that consumers overvalue the present and undervalue the future.  Researchers have documented that consumers make better savings decisions when they are presented with fewer options.  They have shown the importance of “anchoring” bias–the tendency to place disproportionate weight on the first piece of information presented. This bias can lead consumers either to make poor financial choices or instead to tip the scales in favor of beneficial choices, as with automatic savings defaults.  Similarly, “nudges” can help consumers in the right circumstances or instead backfire in surprising ways.

These behavioral insights are especially powerful when paired with the remarkable advances we have seen in the technological tools available to the average consumer, especially through their smartphones. Smartphones are ubiquitous. The 2016 Federal Reserve Survey of Consumer and Mobile Financial Services (SCMF) found that 87 percent of the U.S. adult population had a mobile phone, the vast majority of which were smartphones. Smartphone use is prevalent even among the unbanked and underbanked populations. Survey evidence suggests we are three times more likely to reach for our phone than our significant other when we first wake up in the morning.

Some evidence suggests that smartphones are already helping consumers make better financial decisions. The 2016 SCMF found that 62 percent of mobile banking users checked their account balances on their phones before making a large purchase, and half of those that did so decided not to purchase an item as a result.  In addition, 41 percent of smartphone owners checked product reviews or searched product information online while shopping in a retail store, and 79 percent of those respondents reported changing their purchase decision based on the information they accessed on their smartphone.

And those use cases just scratch the surface of what is possible. First of all, the smartphone platform has become a launch pad for a whole ecosystem of apps created by outside developers for a wide variety of services, including helping consumers manage their financial lives.

Second, the smartphone ecosystem puts the enormous computing power of the cloud at the fingertips of consumers. Interfacing with smartphone platforms and other apps, outside developers can tap the computing power of the leading cloud computing providers in building their apps. Importantly, cloud computing offers not only the power to process and store data, but also powerful algorithms to make sense of it. Due to early commitment to open-source principles, app developers have open access to many of the same machine-learning and artificial intelligence tools that power the world’s largest internet companies.  Further, the major cloud computing providers have now taken these free building blocks and created different machine-learning and artificial intelligence stacks on their cloud platforms. A developer that wants to incorporate artificial intelligence into their financial management app can access off-the-shelf models of cloud computing providers, potentially getting to market faster than by taking the traditional route of finding training data and building out models in-house from scratch.

Third, fintech developers can also draw from enormous pools of data that were previously unavailable outside of banking institutions. Consumer financial data are increasingly available to developers via a new breed of business-to-business suppliers, called data aggregators. These companies enable outside developers to access consumer account and transactional information typically stored by banks. But aggregators do more than just provide access to raw data. They facilitate its use by developers, by cleaning the data, standardizing it across institutions, and offering their own application programming interfaces for easy integration. Further, similar to cloud computing providers, data aggregators are also beginning to provide off-the-shelf product stacks on their own platforms. This means that developers can quickly and easily incorporate product features, such as predicting creditworthiness, determining how much a consumer can save each month, or creating alerts for potential overdraft charges.

Researchers have documented the benefits of tailored one-on-one financial coaching. Until recently, though, it has been hard to deliver that kind of service affordably and at scale, due to differences in consumers’ circumstances. Let’s again consider the example of deferred interest credit cards. It turns out only a small minority of consumers miss the deadlines for repaying promotional balances and are charged retroactive interest payments, and they typically have deep subprime scores.  Similarly, for consumers that opt into overdraft products on their checking accounts, 8 percent of consumers pay 75 percent of the fees.  Up until now, it has been hard for consumers to understand those odds and objectively assess whether they are likely to be in the group of customers that will face challenges with a particular financial product. The convergence of smartphone ubiquity, cloud computing, data aggregation, and off-the-shelf AI products offer the potential to make tailored financial advice scalable. For instance, a fintech developer could pair historical data about how different types of consumers fare with a specific product, on the one hand, with a consumer’s particular financial profile, on the other hand, to make a prediction about how that consumer is likely to fare with the product.

The Evolution of Financial Autopilots
Since the early days of internet commerce, developers have tried to move beyond simple price comparison tools to offer tailored “agents” for consumers that can recommend products based on analyses of individual behavior and preferences.  Today, a new generation of personal financial management tools seems poised to make that leap. When a consumer wishes to select a new financial product, he or she can now solicit options from a number of websites and mobile apps. These new comparison sites can walk the consumer through a wide array of financial products, offering to compare features like rewards, fees, and rates, or tailoring to a consumer’s stated goals. Some fintech advisors ask consumers to provide access to their bank accounts, retirement accounts, college savings accounts, and other investment platforms in order to enable a fintech advisor to offer a consumer a single, near complete picture of his balances and cash flows across different institutions.

In reviewing the advertising, terms and conditions, and apps of an array of fintech advisors, it appears that many of these tools offer advanced data analysis, machine learning, and even artificial intelligence to help consumers cut down on unnecessary spending, set aside money for savings, and use healthy nudges to improve their financial decisions. For instance, a fintech advisor may help a consumer automate savings “rules,” like rounding up charges and putting the difference into savings, enabling these small balances to accumulate over time or setting a small amount of money aside every time a consumer spends money on little splurges.

The early stages of innovation inevitably feature a lot of learning from trial and error. Fortunately, as the fintech ecosystem advances, there are useful experiences and good practices to draw upon from the evolution of the commercial internet. To begin with, one internet adage is that if a product is free, “you are the product.”  In this vein, fintech advisors frequently offer free services to consumers and earn their revenue from the credit cards and other financial products that they recommend through lead generation.

Of course, many fintech advisors are not lead generators. Some companies offer fee-for-service models, with consumers paying a monthly fee for the product. Other companies are paid by employers, who then provide the products free of charge to their employees as an employee benefit. In these cases, they likely have quite different business models.

But for those services that do act as lead generators, there are important considerations about whether and how best to communicate information to the consumer about the nature of the recommendations being made. For instance, according to some reports, fintech advisors can make between $100 and $700 in lead generation fees for every customer that signs up for a credit card they recommend.

In many cases, a fintech advisor may describe their service as providing tailored advice or making recommendations as they would to friends and family. In such cases, a consumer might not know whether the order in which products are presented by a fintech assistant is based on the product’s alignment with his or her needs or different considerations. Different fintech advisors may order the lists they show consumers using different criteria. A product may be at the top of the advisor’s recommendations because the sponsoring company has paid the advisor to list it at the top, or the sponsoring company may pay the fintech assistant a high fee, contingent upon the consumer signing up for the product. Alternatively, a fintech advisor may change the order of the loan offers or credit cards based on the likelihood that the consumer will be approved. Moreover, in some cases, the absence of lead generation fees for a particular product may impact whether that product is on the list shown to consumers at all.

There appears to be a wide variety of practices regarding the prominence and placement of advertising and other disclosures relative to the advice and recommendations such firms provide. Overall, fintech assistants have increasingly improved the disclosures that explain to consumers how they get paid, but this is still a work in progress.

The good news is that these challenges are not new. The experience with internet search engines outside of financial products, such as Google, Bing, and Yahoo!, as well as with other product comparison sites, such as Travelocity and Yelp, may provide useful guidance. As consumers and businesses have adapted to the internet, we have, collectively, adopted norms and standards for how we can expect search and recommendation engines to operate. In particular, we generally expect that search results will be included and ranked based on what’s organically most responsive to the search–unless it is clearly labeled otherwise.  Accordingly, when we search for a product, we now know to look for visual cues that identify paid search results, usually in the form of a text label like “Sponsored” or “Ad”, different formatting, and visually separating advertising from natural search results.  Even when an endorsement is made in a brief Twitter update, we now expect disclosures to be clear and conspicuous.

As fintech advisors evolve to engage consumers in new ways, disclosure methodologies will no doubt be expected to adapt as well. For instance, some personal financial management tools now interact with consumers via text message. If consumers move to a world in which most of their interactions with their advisors occur via text-messaging “chatbots”–or voice communication–I am hopeful that industry, regulators, consumers, and other stakeholders will work together to adapt the norms to distinguish between advice and sponsored recommendations.

The Data Relationship
While the lead generation revenue model presents some familiar issues that are readily apparent, under the hood, fintech relationships raise even more complex issues for consumers in knowing who they are providing their data to, how their data will be used, for how long, and what to expect in the case of a breach or fraud. Let me briefly touch on each issue in turn.

Often, when a consumer signs up with a fintech advisor or other fintech app, they are asked to log into their bank account in order to link the fintech app with their bank account data. In reviewing apps’ enrollment processes, it appears that consumers are often shown log-in screens featuring bank logos and branding, prompting consumers to enter their online banking logins and passwords. In many cases, the apps note that they do not store the consumers’ banking credentials.

When the consumer logs on, he or she is often not interfacing with a banks’ computer systems, but rather, providing the bank account login and password to a data aggregator that provides services to the fintech app. In many cases, the data aggregator may store the password and login and then use those credentials to periodically log into the consumer’s bank account and copy available data, ranging from transaction data, to account numbers, to personally identifiable information. In other cases, things work differently under the hood. Some banks and data aggregators have agreed to work together to facilitate the ability to share data with outside developers in authorized ways. These agreements may delineate what types of data will be shared, and authorization credentials may be tokenized so that passwords are never stored by the aggregator.

It is often hard for the consumer to know what is actually happening under the hood of the financial app they are accessing. In most cases, the log in process does not do much to educate the consumer on the precise nature of the data relationship. Screen scraping usually invokes the bank’s logo and branding but infrequently shows the logo or name of the data aggregator. In reviewing many apps, it appears that the name of the data aggregator is frequently not disclosed in the fintech app’s terms and conditions, and a consumer generally would not easily see what data is held by a data aggregator or how it is used. The apps, websites, and terms and conditions of fintech advisors and data aggregators often do not explain how frequently data aggregators will access a consumer’s data or how long they will store that data.

Recognizing this is a relatively young field, but one that is growing fast, there are a myriad of questions about the consumer’s ability to opt out and control over data that will need to be addressed appropriately. In examining the terms and conditions for a number of fintech apps, it appears that consumers are rarely provided information explaining how they can terminate the collection and storage of their data. For instance, when a consumer deletes a fintech app from his or her phone, it is not clear this would guarantee that a data aggregator would delete the consumer’s bank login and password, nor discontinue accessing transaction information. If a consumer severs the data access, for instance by changing banks or bank account passwords, it is also not clear how he or she can instruct the data aggregator to delete the information that has already been collected. Given that data aggregators often don’t have consumer interfaces, consumers may be left to find an email address for the data aggregator, send in a deletion request, and hope for the best.

If things go wrong, consumers may have limited remedies. In reviewing terms, it appears that many fintech advisors include contractual waivers that purport to limit consumers’ ability to seek redress from the advisor or an underlying data aggregator. In some cases, the terms and conditions assert that the fintech developer and its third-party service providers will not be liable to consumers for the performance of or inability to use the services. It is not uncommon to see terms and conditions that limit the fintech adviser’s liability to the consumer to $100.

Traditionally, under the Electronic Funds Transfer Act and its implementing Regulation E, consumers have had protections to mitigate their losses in the event of erroneous or fraudulent transactions that would otherwise impact their credit and debit cards, such as data breaches. Those protections are not absolute, however.  In particular, if a consumer gives another person an “access device” to their account and grants them authority to make transfers, then the consumer is “fully liable” for transfers made by that person, even if that person exceeds his or her authority, until the consumer notifies the bank.  As the industry matures, the various stakeholders will need to develop a shared understanding of who bears responsibility in the event of a breach.

Shared Responsibility and Shared Benefit Moving Forward
So what can be done to make sure consumers have the requisite information and control to remain squarely in the driver’s seat? Establishing and implementing new norms is in the shared interest of all of the participants in the fintech stack. For instance, in the case of credit cards, mortgages, and many other products, it is often banks or parties closely affiliated with banks that pay fees to fintech advisors to generate leads for their products, pursuant to a contract. Through these contractual relationships with fintech advisors, banks have considerable influence in the lead generation relationship, including through provisions describing how a sponsored product should be described or displayed. Banks have a stake in ensuring that their vendors and third-party service providers act appropriately, that consumers are protected and treated fairly, and that the banks’ reputations aren’t exposed to unnecessary risk.  Likewise, some of the leading speech-only financial products are currently credit card and bank products. Accordingly, banks have incentives to invest in innovating the way they disclose information to consumers, as they also invest in new ways of interacting with them.

As for consumers’ relationships with data aggregators, there’s an increasing recognition that consumers need better information about the terms of their relationships with aggregators, more control over what is shared, and the ability to terminate the relationship.  We have spoken to data aggregators who recognize the importance of finding solutions to many of the complex issues involved with the important work of unlocking the potential of the banking stack to developers. And while there are some difficult issues in this space, other issues seem relatively straightforward. It shouldn’t be hard for a consumer to be informed who they are providing their credentials to. Consumers should have relatively simple means of being able to consent to what data are being shared and at what frequency. And consumers should be able to stop data sharing and request the deletion of data that have been stored.

Responsibility for establishing appropriate norms in the data aggregation space should be shared, with banks, data aggregators, fintech developers, consumers, and regulators all having a role.  Banks and data aggregators are negotiating new relationships to determine how they can work together to provide consumers access to their data, while also ensuring that the process is secure and leaves consumers in the driver’s seat.  In many cases, banks themselves were often the original customers of data aggregators, and many continue to use these services. According to public filings, more than half of the 20 largest banks are customers of data aggregators.  The banks have an opportunity as customers of data aggregation services to ensure that the terms of data provision protect consumers’ data and handle it appropriately.

Regulators also recognize that there may be opportunities to provide more clarity about how the expectations about third-party risk management would work in this sector, as well as other areas experiencing significant technological change. Through external outreach and internal analysis, we are working to determine how best to encourage socially beneficial innovation in the marketplace, while ensuring that consumers’ interests are protected. We recognize the importance of working together and the potential to draw upon existing policies, norms, and principles from other spaces. Consumers may not fully understand the differences in regulations across financial products or types of financial institutions, or whether the rules change when they move from familiar search and e-commerce platforms to the fintech stack. Consumers, as well as the market as a whole, will benefit if regulators coordinate to provide more unified messages and support the development of standards that serve as a natural extension of the common-sense norms that consumers have come to expect in other areas of the commercial internet.

Conclusion
The combination of technologies that put vast computing power, rich data sets, and artificial intelligence onto simple smartphone apps together with important research into consumer financial behaviors has great potential to help consumers navigate their complex financial lives more effectively, but there are also important risks. I am hopeful that fintech developers, data aggregators, bank partners, consumers, and regulators will work together to keep consumers in the driver’s seat as we move forward with these new technologies. If we work together effectively toward this goal, the fintech stack may be able to offer enormous benefits to the consumers they aim to serve, while appropriately identifying and managing the risks.


How ‘liar loans’ undermine sound lending practices

From The Conversation.

How truthful are we when it comes to negotiating loans in Australia?

With increasing pressure on the housing market, some of us might be tempted to stretch the truth to secure a mortgage on our dream property – but research shows that this practice can have serious repercussions.

Recent news reports have alerted borrowers to the dangers of “liar loans”, based on the findings of a new UBS research study. A liar loan is a no-documentation loan that is approved on the basis of unverified and possibly false information about income, assets or capacity to repay.

In the United States, where many loan applications have been approved without any information on the borrower’s income and assets – these liar loans have been implicated as one of the reasons for the global financial crisis.

Should we be worried in Australia?

The UBS study found that a third of Australian mortgage borrowers reported being “not factual or accurate” in their mortgage applications. Being “not accurate” is not the same thing as being a “liar”. However, we need to be aware and pro-active to avoid poor standards and practices.

They further estimate that there is roughly US$500 billion (A$657.95 billion) worth of factually inaccurate mortgages on banks’ books in Australia. This is worrying, because it could mean that borrowers are taking on bigger debts than they can actually afford, falling into financial stress or even losing their homes.

The Australian situation

In Australia, when borrowers apply for a mortgage they need to provide documentation that verifies their employment history, creditworthiness, and overall financial situation. Borrowers are required to provide a payslip or most recent tax returns, and show that they have been employed in the same job for at least 12 months.

Other documentation may include: credit card and bank statements; sales contract; confirmation of rental income if purchasing an investment property; and more. The mortgage originator may perform credit checks and bankruptcy or default searches.

Some mortgage borrowers may not be required to provide much documentation if they are existing clients of the bank and already have a strong credit history.

In my research I found that 88.8% of mortgage applicants were existing customers of the bank where they apply for a mortgage, and had been so for 9.3 years on average. But low documentation loans exist for self-employed borrowers.

Where accuracy of mortgage applications becomes difficult to determine is when estimating the expenses of the household. Mortgage applicants are asked about their monthly expenses to assess whether they can service the debt without major stress. Here, applicants may be “mostly factual and accurate” or even “partially accurate” when trying to calculate their monthly expenses. After all, how many people actually keep accurate and up-to-date spreadsheets of all their expenses?

Debts outstanding with other financial institutions or family and friends may also be misreported. In addition, mortgage lenders who receive commissions linked to loan size have incentives to overestimate borrower’s incomes and underestimate expenses.

Australian version of liar loans?

These arguments do not suggest that there is no “lying” or “truth hiding” in mortgage applications in Australia, but that it may not be comparable to the trend of “liar loans” seen in the US.

More importantly, banks do not rely only on their clients’ word. Banks estimate monthly expenses and uncommitted income for their clients based on borrower characteristics and solid financial records.

Data from previous research reveals that banks estimate on average A$1,637 more on monthly expenses than applicants report. Based on the bank’s calculations, housing investors underestimate their monthly expenses by A$1,932 on average, while owner-occupiers underestimate by A$1,560 on average.

Similarly, mortgage applicants report their monthly uncommitted income to be on average A$702.5 more than what the bank estimates it to be. Housing investors only overestimate their monthly uncommitted income by A$174 on average, while owner-occupiers overestimate by A$840 on average.

Due diligence required from both banks and borrowers

Research finds that mortgage features (for example fixed or adjustable rates, maturity, loan-to-value ratio, and so on) help borrowers select mortgage products that are affordable and safer for them, with the guidance of mortgage lenders and brokers.

The research further finds that lenders should make sure that borrowers have the financial capacity to repay their loans out of income or by selling assets under plausible conditions, and not by relying on the value of the collateral.

Mortgage delinquency and default may rise due to excessive risk taking in mortgage lending combined with deteriorating economic conditions; or due to falling income and rising unemployment during a housing downturn. This later case is more likely the potential threat in the Australian current environment.

The Australian Prudential Regulatory Authority (APRA) and the Reserve Bank of Australia (RBA) perform stress tests to check the financial system’s resilience. Along with APRA’s macro- and micro-prudential regulations, some lenders are introducing higher requirements and credit restrictions on potential borrowers.

These include obtaining more information on the clients, which helps assess credit and default risks and helps design and target financial products to specific type of borrowers. There is however risk of mortgage discrimination.

More careful monitoring needed

Mortgage risks often relate to mismatches between the products used by households and their financial capabilities and ability to bear risks. For that reason, mortgage product characteristics should be monitored carefully both by banks and borrowers.

The Organisation for Economic Co-operation and Development (OECD) suggests that financial authorities should make sure lending standards are sound, both in the banking and non-banking sectors. It is important that banks do not face incentives encouraging excessive risk taking.

Requiring more transparency, reinforcing consumer protection and financial education encourages sound lending and borrowing practices.

Author: Maria Yanotti, Lecturer of Economics and Finance Tasmanian School of Business & Economics, University of Tasmania

NAB Will Remediate 2,300 Home Loans

NAB has said it has commenced a remediation program for some of its customers, after a review identified their home loan may not have been established in accordance with NAB’s policies.

It follows the completion of an extensive review by NAB which identified around 2,300 home loans since 2013 that may have been submitted without accurate customer information and/or documentation, or correct information in relation to NAB’s Introducer Program.

NAB first became aware of the matter in October 2015, and advised ASIC in December 2015 after an initial high-level review. Since then, NAB has provided regular updates to ASIC on the progress of its investigation.

“What occurred was unacceptable. We have investigated this matter thoroughly, and, as we have always said, whenever we find issues we will investigate them, fix them, and hold people to account – and we did,” NAB Chief Customer Officer, Consumer Banking and Wealth, Andrew Hagger, said.

As a result of NAB’s review, 20 bankers in New South Wales and Victoria had their employments terminated, or are no longer employed by NAB, and an additional 32 bankers had consequences applied including the reduction of remuneration.

NAB has commenced writing to the around 2,300 customers – many of whom live overseas – asking them to participate in a detailed review of their loan, which may include verification of documents submitted at the time of their home loan application. Affected customers may be offered compensation as appropriate.

NAB has engaged with ASIC to ensure the remediation program provides fair outcomes for customers. The remediation program has been designed with reference to the methodology applied by the Financial Ombudsman Service, and with NAB’s standard approach to compensating customers. NAB will engage an independent expert to undertake regular audits of the remediation program, and will update ASIC every two months on its progress.

“I want to assure all of our customers that we have improved our systems, processes and programs as a result of what occurred here,” Mr Hagger said.

This includes changes to NAB’s Introducer Program, including enhanced governance and eligibility criteria.

Customers who receive letters to participate in the remediation program are encouraged to contact NAB on the phone number provided to them. Any NAB customer who is not part of the remediation program, but who has a query about it or their home loan, can contact NAB


Trend unemployment rate remains at 5.5 per cent

The monthly trend unemployment rate remained at 5.5 per cent in October 2017, according to figures released by the Australian Bureau of Statistics (ABS) today. This reflects the continued strength in employment growth in the Australian labour market.

Monthly trend full-time employment increased for the 13th straight month in October 2017. Full-time employment grew by a further 16,000 persons in October, while part-time employment increased by 4,000 persons.

“Full-time employment has now increased by around 289,000 persons since October 2016, and makes up the majority of the 347,000 person net increase in employment over the period,” Chief Economist for the ABS, Bruce Hockman, said.

“Over the past year, trend employment increased by 2.9 per cent, which is above the average year-on-year growth over the past 20 years (1.9 per cent).”

The labour force participation rate remained at 65.2 per cent for a second month, the highest it has been since April 2012.

The trend monthly hours worked increased by 3.5 million hours (0.2 per cent), with the annual figure also showing strong growth (3.1 per cent). This is consistent with the continued growth in full-time employment.

Mr Hockman added: “Over the past year, the states and territories with the strongest annual growth in employment were Queensland (4.6 per cent), ACT (3.1 per cent), Tasmania (3.0 per cent) and Victoria (2.8 per cent).”

Trend series smooth the more volatile seasonally adjusted estimates and provide the best measure of the underlying behaviour of the labour market.

The seasonally adjusted number of persons employed increased by 4,000 in October 2017. The seasonally adjusted unemployment rate decreased by 0.1 percentage points to 5.4 per cent and the labour force participation rate decreased to 65.1 per cent.

Increasing wages would make the Australian economy safer

From The Conversation.

Australian wages have again failed to meet expectations – rising by just 2% on an annual basis. This is bad not just for workers, but for the economy in general. Wages need to rise, especially for those on low to middle incomes.

Research shows that even a small increase in interest rates disproportionately harms borrowers who are on lower incomes, and especially those at the start of the debt repayment process.

The Bank of England recently raised interest rates for the first time in a decade. The US Federal Reserve and European Central Bank will eventually follow suit. And as interest rates rise across the developed world, Australia will also be forced to follow.

Around 29% of Australian households are “over-indebted”. As interest rates rise, many of these households will be unable to meet their mortgage repayments. An increase in mortgage defaults will hit banks’ balance sheets, and will spread through the financial system.

Increasing wages would not only ease some of this financial stress, but would also jolt inflation as these newly enriched workers buy themselves things. Rising inflation will erode some of the debt repayment the household sector faces over the coming years.

Warning signs

A study in Ireland (which has similar household debt levels to Australia) found that a 1-2% increase in interest rates leads to a 2-4% reduction in a typical borrower’s disposable income after debt repayments.

Households are considered “vulnerable” if their debt service ratio (the share of debt repayments to income) is over 30%. If you earn A$1,500 after taxes every week, but are barely making a A$850 mortgage repayment, you’re going to be in trouble if repayments rise to $A900.

Part of the reason for the increased household debt is that the “labour share” of the Australian economy has been declining.

In 1960, Australian workers took home 62% of the value of what they produced. Australian owners of capital got 38%. This split was similar in the rest of the developed world.

In 2018, workers will most likely take home less than 50% of the value of what they produce. The average drop in the labour share as a percentage of GDP since 1960 is 12% across the OECD.

Wages have been growing at less than 2% a year since 2014. This is despite the fact that unemployment is 5.5% and falling, which is around the level where we would expect to see wages rise because workers can command a premium in the market.

But the Australian labour market is also changing. Underemployment (workers who would like to work more hours) is a key problem in many households. Underemployment is relatively high among 15-24-year-olds and is projected to rise.

According to the Oxford Internet Institute’s online labour index, Australia is number three in the world for “gig economy” jobs, behind Britain and the United States. These jobs provide cash flow but no security. They also build up other vulnerabilities – many Uber drivers will be short on Super, for example.

As you can see from the previous chart, Australian corporations aren’t doing too badly even as the labour share declines. The chart shows the gross profits, compared to the last month of 2008 – pretty much the peak of the crisis. This comparison allows us to see the changes in profits before and after the crisis more clearly.

The raw data show the same pattern.

You can see clearly a drop after the global financial crisis hits, and then a very sharp recovery in 2015 and 2016. Gross operating surplus, our rough measure of the profits of the private sector, are more than 24% higher than they were in 2008. One important reason for the increase in profits is the lack of wage growth for households.

What should be done?

In the longer term the ratio of debt to income and assets will have to fall. This could happen via write-offs, sell-ons and bankruptcies, or via increases in incomes. But we don’t live in the longer term.

Right now, middle-income workers need more cash in their pockets. There are a couple of options available.

The first is to reduce the burden of debt repayment on those new entrants to the mortgage market. One solution is to provide tax relief on the interest that a household pays in the first few years of a mortgage (as Ireland and the United Kingdom do). This will keep the property market working well and support younger borrowers, if only temporarily. But it could also bid up house prices if not properly targeted.

The second is the simplest approach – reduce taxes, combined with tax reform. But the federal government is already running a budget deficit of around 2% of GDP, so this doesn’t work in the short term.

The third option is to reduce the cost of living by making public transport easier to access, improving early education, and reducing energy prices. But research shows that the “worst” infrastructure projects are the ones that generally get built, so this isn’t advisable either.

The solution, then, is to increase wages, especially at the middle of the income distribution. Minimum wages have already gone up by more than 3% this year, but this is unlikely to help those on middle incomes, who have access to enough credit to afford current house prices and so have become stretched.

There are models Australia can learn from internationally. In Germany, the Variable Payment System links pay increases to profit sharing and bonuses. When the company or the sector does well, the worker does well. The reverse is also true.

A survey of 23 different wage-increasing mechanisms found almost all countries bar the US, Hungary and Poland have some collective bargaining and minimum wages. These range from hard wage indexation enforced by law, to intra-associational coordination (roughly what we have here in Australia). The right model for the 21st century and the changing nature of work may be very different, however.

As we’ve seen, private sector is doing very well and can afford a wage hike. And productivity increases in the Australian workforce has long outpaced wage increases. A wage increase is not only feasible and justified, it is in the national interest.

Where will the Growth Really Come From?

Luci Ellis RBA Assistant Governor (Economic) delivered the Stan Kelly Lecture on “Where is the Growth Going to Come From?“. An excellent question given the fading mining boom, and geared up households!

Over time, some industries grow faster than others. For a while, the mining industry was growing faster than the rest. Other industries take the lead at other times. But it doesn’t really get at the underlying drivers of growth. We need to ask: where will the growth really come from, over the longer term?

In answering this question, it is hard to go past the ‘three Ps’ popularised by our colleagues at Treasury: population, participation and productivity. I’ll go through each in turn.

Population

As the Governor noted in a speech a few years ago, Australia’s population is growing faster than in almost any other OECD economy (Lowe 2014). That has remained true over the past couple of years. The rate of natural increase is higher than many other countries, but most of the difference is the large contribution from immigration.

Of course, just adding more people and growing the economy to keep pace wouldn’t boost our living standards.[5] But there are two reasons why we should not assume that this is all that happens. Firstly, recent migrants have a different profile to the incumbent Australian population. They are generally younger, and the youngest age group are significantly more likely to have non-school qualifications (Graph 5). This is possibly because so many recent migrants initially arrive on student visas and then stay. In line with that, service exports in the form of education have grown rapidly over the past few decades.

Older migrants are on average less likely to have such a qualification than existing residents in the same age groups, but they are a small fraction of all migrants. The average education level of newly arrived Australians is actually higher than that of existing residents, precisely because they are younger. So Australia’s migration program is structured in a way that, in principle at least, it can grow the economy while raising average living standards.

Graph 5: Recent Migrants and Australian Residents

Secondly, increasing economic scale is not neutral. There is more to it than just getting bigger. This is the lesson of what is sometimes called New Economic Geography: scale economies arise from product differentiation (Fujita, Krugman and Venables 1999). Bigger, denser cities are more productive. Perhaps more importantly, larger population centres allow more variety in the goods and services produced. Fujita and Thisse (2002) quote Adam Smith making the same point (Smith 1776, p 17).

There are some sorts of industry, even of the lowest kinds, which can be carried on no where but in a great town. A porter, for example, can find employment and subsistence in no other place. A village is by much too narrow a sphere for him; even an ordinary market town is scarce large enough to afford him constant occupation.So it is also with management consultants, medical specialists and a myriad of other occupations that can only be sustained in a large market.

Participation

The second of the three Ps, participation, can and has been increasing average incomes and living standards. It is usually presumed that ageing of the population will reduce participation. In Australia at least, other forces have offset that tendency in recent years.

In our Statement on Monetary Policy, released last week, we noted that the participation rate has been rising recently. The increase has been concentrated amongst women and older workers. That is true of the pick-up over recent months. It is also true over a somewhat longer period, as shown in this graph (Graph 6). Older workers have increased their participation in the workforce as the trend to earlier retirement has abated. Mixed in with this is a cohort effect related to the increasing participation of women more generally. Each generation of women participates in the labour force at a greater rate than the previous generation of women did at the same age.

Graph 6: Participation Rate

There is a connection here with the increase in health and education employment I mentioned earlier. Better healthcare outcomes means that fewer people retire early because of ill-health, so participation rises. More extensive childcare options make it easier for both parents to be in paid work. Given the usual presumptions in our society about who has primary responsibility for caring for children, this shift affects participation of women more than that of men. So it’s no surprise that the participation rates of women aged 35–44 have also been rising strongly. And more flexible work arrangements tend to encourage participation by both female and older workers.

In the end, though, lifting participation is a once-off adjustment. Once someone enters the workforce, they can’t enter it a second time without leaving first. Greater participation raises the level of living standards but it isn’t an engine of ongoing growth. We must also remember that the objective is not that everyone must be in paid employment. Many people are outside the labour force for good reasons, for example because they are in full-time education, caring for children or other relatives, or doing volunteer work by choice.

Productivity and Innovation

That leaves us with productivity, arguably the most important of three Ps, but unfortunately also the hardest to measure. It is also an area where distributions and firm-specific decisions really matter. Some recent international evidence shows that the firms at the global productivity frontier can be several times more productive than the average firm in their industry (Andrews, Criscuolo and Gal 2015).[6] This research also finds that firms tend to adopt a new technology only after the leading firms in their own country have adopted it. That is, the national productivity frontier first has to catch up to the global frontier, by adapting the new technology to local conditions. So the average productivity of firms in an economy depends on three things.

  1. How quickly the leading firms in that country adopt the technology and match the productivity levels of the globally leading firms in that industry.
  2. How large the leading firms are in the national economy.
  3. How quickly the laggard firms can catch up, once the national leading firms have adopted a particular technology.

The findings of this research suggest that this last factor – the rate of technology adoption – has slowed down since the turn of the century.

The policy implications of these findings are subtle, and depend on whether you want to affect firms near the frontier, or the firms that are lagging far behind. For example, a more flexible labour market might make it easier for the leading firms to grow faster. Average productivity would rise because those leading firms account for a greater share of output. But then you would have an economy dominated by ‘superstar firms’ (Autor et al 2017). The implications of that are not necessarily benign. For a start, inequality could be greater. Median living standards might not rise.

The drivers of innovation, like the drivers of creativity more generally, are hard to pin down. But the literature does provide some pointers to them. First and perhaps most important is simply to grow: growth is more conducive to innovation than recession is. Recessions do not engender ‘creative destruction’; they produce liquidations, which are destructive destruction (Caballero and Hammour 2017). Indeed, when labour is plentiful, there is not much incentive to invest in productivity-boosting technology. And when everyone’s sales are weak, there is not much incentive to invest to try to increase them. There is nothing quite like a tight labour market to make firms think about how to do things more efficiently.

The pressures of strong sales or competition might spur innovation, but many other factors enable it. Infrastructure is a key enabler not only of productivity growth of existing firms, but whole new business opportunities. Often we think of communications infrastructure and the internet in this context. Transport infrastructure is at least as important, I would argue, which makes the current pipeline of public investment even more relevant to future growth outcomes. That’s because online commerce still needs good physical logistics. Unless it’s a purely digital product, something still needs to be delivered. Australia is a highly urbanised country, but it is also a highly suburbanised country. Improving urban transport infrastructure, as well as inter-urban transport infrastructure, could help boost productivity across a range of both traditional and new industries.

Also important is the political and regulatory environment. It would not surprise Stan and Bert Kelly that much of the literature finds that product market regulation and other devices protecting laggard firms tend to retard innovation. More generally, barriers to entry make it harder for new, potentially more innovative firms to break in.

It isn’t all about the start-ups, though. A lot depends on the propensity of existing firms to adopt new technologies and business practices. We think that this is one of the reasons for the slow rate of growth in retail prices in Australia at present. In the face of increased competition, incumbent retailers are having to both compress margins and use technology to become more efficient. Our liaison contacts tell us that they are investing heavily in better inventory management and other cost-saving measures, often by using data analysis more extensively.

Adopting these innovations takes time, because firms have to become familiar with the new technologies and change their business practices to take advantage of them. It wouldn’t be the first time that the computers – or perhaps this time, the machine learning algorithms – were visible everywhere except in the productivity statistics for just this reason.[7]

Adopting new technologies and business models also requires a willingness to change. Just as views to protection can change, so can society’s attitudes to risk, innovation and, thus, entrepreneurship. We saw, after all, that Australia’s economic culture could shift from being inward-looking to outward-looking over the course of a couple of decades.

Australia is normally seen as being a relatively fast adopter of technology. But there are some aspects where we seem to lag. One is R&D expenditure (Graph 7). While this isn’t greatly below the average of industrialised countries and many similar countries get by perfectly well doing much less, it has been declining in importance lately. Some other indicators also suggest that Australian firms have in recent years been less likely to adopt innovative technologies than their peers abroad. For example, while small firms are holding their own, large firms in Australia are less likely to use cloud computing services than large firms in many other countries.[8] This wasn’t always the case: a decade and a half ago, Australian firms were towards the front of the curve in adopting the e-commerce technologies that were new at the time (Macfarlane 2000). A lot depends on whether the workforce has the skills to use these new technologies, but at heart, technology adoption is a business decision.

Graph 7: Gross Research and Development Expenditure

Senate Approves Foreign Vacant Property Fine

The legislation to tighten some aspects of investment property, and levy a charge on vacant foreign owned property has been passed in the Senate.

The legislation prevents property investors from claiming travel expenses when travelling between properties, as well as tightening  depreciation on  plant and equipment tax deductions.

Foreign owners will be charged a fee if they leave their properties vacant for at least six months in a 12-month period, in an attempt to release more property to ease supply. The latest Census showed that there are 200,000 more vacant homes across Australia than there were ten years ago.


Introduced with the Foreign Acquisitions and Takeovers Fees Imposition Amendment (Vacancy Fees) Bill 2017, the bill amends the: Income Tax Assessment Act 1997 to: provide that travel expenditure incurred in gaining or producing assessable income from residential premises is not deductible, and not recognised in the cost base of the property for capital gains tax purposes; and limit deductions for plant and equipment assets used for producing assessable income from residential premises to when the asset was first used for a taxable purpose; Foreign Acquisitions and Takeovers Act 1975 to implement an annual vacancy fee on foreign owners of residential real estate where residential property is not occupied or genuinely available on the rental market for at least six months in a 12-month period; and Taxation Administration Act 1953 to make consequential amendments.