Where will the Growth Really Come From?

Luci Ellis RBA Assistant Governor (Economic) delivered the Stan Kelly Lecture on “Where is the Growth Going to Come From?“. An excellent question given the fading mining boom, and geared up households!

Over time, some industries grow faster than others. For a while, the mining industry was growing faster than the rest. Other industries take the lead at other times. But it doesn’t really get at the underlying drivers of growth. We need to ask: where will the growth really come from, over the longer term?

In answering this question, it is hard to go past the ‘three Ps’ popularised by our colleagues at Treasury: population, participation and productivity. I’ll go through each in turn.

Population

As the Governor noted in a speech a few years ago, Australia’s population is growing faster than in almost any other OECD economy (Lowe 2014). That has remained true over the past couple of years. The rate of natural increase is higher than many other countries, but most of the difference is the large contribution from immigration.

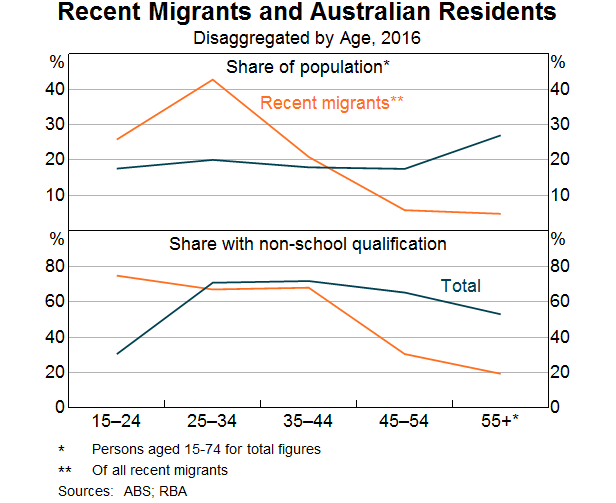
Of course, just adding more people and growing the economy to keep pace wouldn’t boost our living standards.[5] But there are two reasons why we should not assume that this is all that happens. Firstly, recent migrants have a different profile to the incumbent Australian population. They are generally younger, and the youngest age group are significantly more likely to have non-school qualifications (Graph 5). This is possibly because so many recent migrants initially arrive on student visas and then stay. In line with that, service exports in the form of education have grown rapidly over the past few decades.

Older migrants are on average less likely to have such a qualification than existing residents in the same age groups, but they are a small fraction of all migrants. The average education level of newly arrived Australians is actually higher than that of existing residents, precisely because they are younger. So Australia’s migration program is structured in a way that, in principle at least, it can grow the economy while raising average living standards.

Graph 5: Recent Migrants and Australian Residents

Secondly, increasing economic scale is not neutral. There is more to it than just getting bigger. This is the lesson of what is sometimes called New Economic Geography: scale economies arise from product differentiation (Fujita, Krugman and Venables 1999). Bigger, denser cities are more productive. Perhaps more importantly, larger population centres allow more variety in the goods and services produced. Fujita and Thisse (2002) quote Adam Smith making the same point (Smith 1776, p 17).

There are some sorts of industry, even of the lowest kinds, which can be carried on no where but in a great town. A porter, for example, can find employment and subsistence in no other place. A village is by much too narrow a sphere for him; even an ordinary market town is scarce large enough to afford him constant occupation.So it is also with management consultants, medical specialists and a myriad of other occupations that can only be sustained in a large market.

Participation

The second of the three Ps, participation, can and has been increasing average incomes and living standards. It is usually presumed that ageing of the population will reduce participation. In Australia at least, other forces have offset that tendency in recent years.

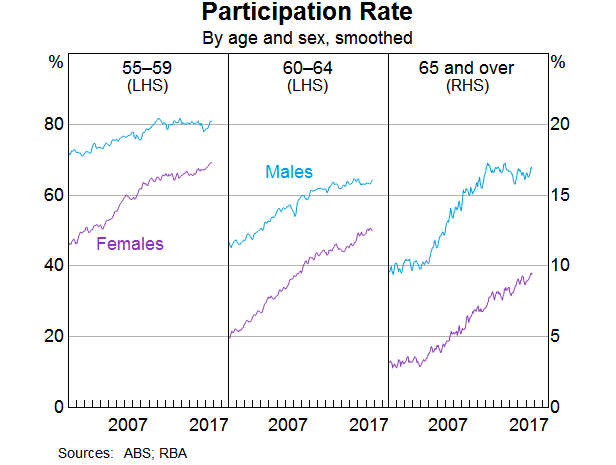
In our Statement on Monetary Policy, released last week, we noted that the participation rate has been rising recently. The increase has been concentrated amongst women and older workers. That is true of the pick-up over recent months. It is also true over a somewhat longer period, as shown in this graph (Graph 6). Older workers have increased their participation in the workforce as the trend to earlier retirement has abated. Mixed in with this is a cohort effect related to the increasing participation of women more generally. Each generation of women participates in the labour force at a greater rate than the previous generation of women did at the same age.

Graph 6: Participation Rate

There is a connection here with the increase in health and education employment I mentioned earlier. Better healthcare outcomes means that fewer people retire early because of ill-health, so participation rises. More extensive childcare options make it easier for both parents to be in paid work. Given the usual presumptions in our society about who has primary responsibility for caring for children, this shift affects participation of women more than that of men. So it’s no surprise that the participation rates of women aged 35–44 have also been rising strongly. And more flexible work arrangements tend to encourage participation by both female and older workers.

In the end, though, lifting participation is a once-off adjustment. Once someone enters the workforce, they can’t enter it a second time without leaving first. Greater participation raises the level of living standards but it isn’t an engine of ongoing growth. We must also remember that the objective is not that everyone must be in paid employment. Many people are outside the labour force for good reasons, for example because they are in full-time education, caring for children or other relatives, or doing volunteer work by choice.

Productivity and Innovation

That leaves us with productivity, arguably the most important of three Ps, but unfortunately also the hardest to measure. It is also an area where distributions and firm-specific decisions really matter. Some recent international evidence shows that the firms at the global productivity frontier can be several times more productive than the average firm in their industry (Andrews, Criscuolo and Gal 2015).[6] This research also finds that firms tend to adopt a new technology only after the leading firms in their own country have adopted it. That is, the national productivity frontier first has to catch up to the global frontier, by adapting the new technology to local conditions. So the average productivity of firms in an economy depends on three things.

  1. How quickly the leading firms in that country adopt the technology and match the productivity levels of the globally leading firms in that industry.
  2. How large the leading firms are in the national economy.
  3. How quickly the laggard firms can catch up, once the national leading firms have adopted a particular technology.

The findings of this research suggest that this last factor – the rate of technology adoption – has slowed down since the turn of the century.

The policy implications of these findings are subtle, and depend on whether you want to affect firms near the frontier, or the firms that are lagging far behind. For example, a more flexible labour market might make it easier for the leading firms to grow faster. Average productivity would rise because those leading firms account for a greater share of output. But then you would have an economy dominated by ‘superstar firms’ (Autor et al 2017). The implications of that are not necessarily benign. For a start, inequality could be greater. Median living standards might not rise.

The drivers of innovation, like the drivers of creativity more generally, are hard to pin down. But the literature does provide some pointers to them. First and perhaps most important is simply to grow: growth is more conducive to innovation than recession is. Recessions do not engender ‘creative destruction’; they produce liquidations, which are destructive destruction (Caballero and Hammour 2017). Indeed, when labour is plentiful, there is not much incentive to invest in productivity-boosting technology. And when everyone’s sales are weak, there is not much incentive to invest to try to increase them. There is nothing quite like a tight labour market to make firms think about how to do things more efficiently.

The pressures of strong sales or competition might spur innovation, but many other factors enable it. Infrastructure is a key enabler not only of productivity growth of existing firms, but whole new business opportunities. Often we think of communications infrastructure and the internet in this context. Transport infrastructure is at least as important, I would argue, which makes the current pipeline of public investment even more relevant to future growth outcomes. That’s because online commerce still needs good physical logistics. Unless it’s a purely digital product, something still needs to be delivered. Australia is a highly urbanised country, but it is also a highly suburbanised country. Improving urban transport infrastructure, as well as inter-urban transport infrastructure, could help boost productivity across a range of both traditional and new industries.

Also important is the political and regulatory environment. It would not surprise Stan and Bert Kelly that much of the literature finds that product market regulation and other devices protecting laggard firms tend to retard innovation. More generally, barriers to entry make it harder for new, potentially more innovative firms to break in.

It isn’t all about the start-ups, though. A lot depends on the propensity of existing firms to adopt new technologies and business practices. We think that this is one of the reasons for the slow rate of growth in retail prices in Australia at present. In the face of increased competition, incumbent retailers are having to both compress margins and use technology to become more efficient. Our liaison contacts tell us that they are investing heavily in better inventory management and other cost-saving measures, often by using data analysis more extensively.

Adopting these innovations takes time, because firms have to become familiar with the new technologies and change their business practices to take advantage of them. It wouldn’t be the first time that the computers – or perhaps this time, the machine learning algorithms – were visible everywhere except in the productivity statistics for just this reason.[7]

Adopting new technologies and business models also requires a willingness to change. Just as views to protection can change, so can society’s attitudes to risk, innovation and, thus, entrepreneurship. We saw, after all, that Australia’s economic culture could shift from being inward-looking to outward-looking over the course of a couple of decades.

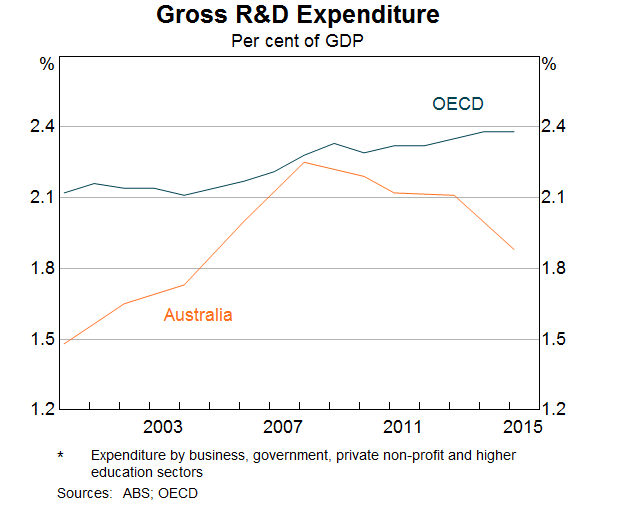
Australia is normally seen as being a relatively fast adopter of technology. But there are some aspects where we seem to lag. One is R&D expenditure (Graph 7). While this isn’t greatly below the average of industrialised countries and many similar countries get by perfectly well doing much less, it has been declining in importance lately. Some other indicators also suggest that Australian firms have in recent years been less likely to adopt innovative technologies than their peers abroad. For example, while small firms are holding their own, large firms in Australia are less likely to use cloud computing services than large firms in many other countries.[8] This wasn’t always the case: a decade and a half ago, Australian firms were towards the front of the curve in adopting the e-commerce technologies that were new at the time (Macfarlane 2000). A lot depends on whether the workforce has the skills to use these new technologies, but at heart, technology adoption is a business decision.

Graph 7: Gross Research and Development Expenditure

Senate Approves Foreign Vacant Property Fine

The legislation to tighten some aspects of investment property, and levy a charge on vacant foreign owned property has been passed in the Senate.

The legislation prevents property investors from claiming travel expenses when travelling between properties, as well as tightening  depreciation on  plant and equipment tax deductions.

Foreign owners will be charged a fee if they leave their properties vacant for at least six months in a 12-month period, in an attempt to release more property to ease supply. The latest Census showed that there are 200,000 more vacant homes across Australia than there were ten years ago.


Introduced with the Foreign Acquisitions and Takeovers Fees Imposition Amendment (Vacancy Fees) Bill 2017, the bill amends the: Income Tax Assessment Act 1997 to: provide that travel expenditure incurred in gaining or producing assessable income from residential premises is not deductible, and not recognised in the cost base of the property for capital gains tax purposes; and limit deductions for plant and equipment assets used for producing assessable income from residential premises to when the asset was first used for a taxable purpose; Foreign Acquisitions and Takeovers Act 1975 to implement an annual vacancy fee on foreign owners of residential real estate where residential property is not occupied or genuinely available on the rental market for at least six months in a 12-month period; and Taxation Administration Act 1953 to make consequential amendments.

Pepper Takeover Approved

From Australian Broker.

The shareholders of Pepper Group have overwhelmingly approved the scheme implementation deed for Red Hot Australia Bidco, an entity owned by certain funds, clients or accounts managed or advised by KKR Credit Advisors or its affiliates, for Bidco to acquire all of the Pepper shares.

Approximately 99.96% of voting shareholders voted in favour of the transaction at a special shareholder meeting today.

As a result of the positive vote, Pepper shareholders not electing one of the Election Options in the scheme will receive $3.60 in cash per share and a special dividend of 10 cents a share.

The Scheme also included an equity alternative to the Cash Consideration (Scrip Option) allowing shareholders (other than certain foreign ineligible shareholders) to instead receive one share in Red Hot Australia Holdco, which is the owner of 100% of the shares in Bidco, for each Pepper share they hold.

Pepper Group chairman, Seumas Dawes said “We are pleased with the strong vote in favour of the scheme, which directors believe delivers maximum value for shareholders. In addition, we are delighted that many shareholders chose to remain invested in the Pepper business.”

Commenting on what the transaction means for the Pepper Group Business, group CEO Mike Culhane said, “With the support of KKR, we now have the opportunity to accelerate our long term growth plans around the world. KKR’s investment is a strong endorsement of the outlook for our business. We are confident this partnership will position the company for long-term success.”

The scheme will be formally implemented on 4 December when shareholders will receive the cash consideration for their shares or an allocation of shares in Holdco.

ANZ welcomes decision on SA Bank Tax

ANZ today welcomed the decision of the South Australian Government it would not be proceeding with its planned bank tax.

ANZ Chief Executive Shayne Elliott said: “This is positive decision for all South Australians and a clear sign the State is once again open for business and investment.”

“We look forward to continuing to invest in our South Australian business with renewed certainty, which remains an important part of our business here in Australia,” Mr Elliott said.

Where Rate Rises Will Hit The Hardest

It seems that eventually mortgage rates will rise in Australia, as global forces exert external pressure on the RBA, and as the RBA tries to normalise rates (at say 2% higher than today). Timing is, of course, not certain.

But it is worth considering the potential impact. While our mortgage stress analysis takes a cash flow view of household finances, our modelling can look at the problem another way.

One algorithm we have developed is a rate sensitivity calculation, which takes a household’s mortgage outstanding, at current rates, and increments the interest rate to the point where household affordability “breaks”.  We use data from our household survey to drive the analysis.

We have just run this analysis with data to end October 2017. We will explore the top line results, and then drill into some NSW specific analysis.

So we start with the average across the country. We find that around 10% of households would run into affordability issues with less a 0.5% hike in mortgage rates,  and around another 8% would be hit if rates rose 0.5%, and a larger number would be added to the “in pain” pile, giving us a total of around 25% of households across the country in difficulty if rates went 1% higher. [Note that the calculation does not phase the rate increases in]. Around 40% of households would be fine even if rates when more than 7% higher.

We can run a similar calculation at a state level. The chart below shows the relative impact on less than 0.5%, 0.5% and 1% rate rises, giving a cumulative total.  We find that around 40% of households in NSW would have a problem, compared with 27% in VIC and 24% in WA.

We can also take the analysis further, to a regional view across the states. This reveals that the worst impacted areas would be, in order, Greater Sydney, Central Coast, Curtain and Greater Melbourne. These are all areas where home prices relative to income are significantly extended, thus households are highly leveraged.

Now lets look further at NSW. Here is the NSW footprint, including all the rate increase bands. More than 30% are protected even if rates are 7% or more higher.

We can look at the type of households, using our segmentation modelling.  Many will expect households in the disadvantaged areas of Greater Sydney to be worst hit by rate rises. This however is not the case, simply because they have smaller mortgages, lenders have lent cautiously, and because these households are use to handling difficult cash flows. Despite this, around 8% of households would be hit hard by a 1% rise in mortgage rates, enough to be a problem, but probably a lower proportion than would be expected.

However, young growing families have more of an issue (this will include a number of first time buyers), with around 35% in difficulty in the case of just a small rise, and more than 60% at risk at 1% higher than today.  Loans are relatively large compared with incomes (which are not rising faster than cpi).

But the segment with the most significant exposure is the Young Affluent household group. These households, which also includes some first time buyers, have larger incomes, but also larger mortgages, and are leveraged significantly, such that more than 70% of this group would struggle with a small rise. More than 85% would have issues with a 1% rate rise.

Many of these households have bought new high-rise apartments in the inner suburban ring, for example around Bondi, Wolli Creek and Hurstville.

So, in a rate increase scenario, we think specific households and locations will be disproportionately hit. The banks should be incorporating this type of analysis in their risk scenario models and underwriting standards. We think some are still lending too generously. The ~7.25 rate floor is not enough to protect borrowers or  the bank.


2018 Crunch Time For Digital Transformation

In a new report, Forrester says that Digital transformation is not elective surgery. It is the critical response needed to meet rising customer expectations, deliver individualized experiences at scale, and operate at the speed of the market. This echoes our Quiet Revolution report, released just yesterday.

They say the results are sobering:

Over 60% of executives believe they are behind in their digital transformation. Lagging results have created a loss of confidence in the CIO, driving up the number of chief digital officers and business units creating their own digital strategies.

But that misses the point. Digital transformation is a CEO issue and an economic question.

Digital transformation is expensive; CEOs can’t drive operational savings fast enough to fund it and are cautious about destroying margins.

In 2018, CEOs must show the political will and, with the CIO and CMO, orchestrate digital transformation across the enterprise.

Some CEOs will use their balance sheet to acquire digital assets and buy time. But 20% of CEOs will fail to act: As a result, those firms will be acquired or begin to perish.

More on this from  IT Wire.

Companies face a year of more uncertainty in 2018 and the window of opportunity is closing for many looking to digitally transform, and revitalise customer experiences, according to a new report.

According to the report from research firm Forrester, 2018 will force decisive action on the digital front for companies to take control of their destiny.

“The dynamics favour those taking aggressive action and create existential risks for those still holding on to old ways of doing business,” Forrester warns.

And Forrester predicts that the chief information officer’s agenda for 2018 will focus on fully embracing digital transformation, cultivating talent, and implementing (not just testing) new technologies.

It says that the rapid maturation of artificial intelligence, blockchain and conversational interfaces will force organisations to create new customer experiences, transform jobs and forge new partnerships.

“As technology continues to disrupt business, digital will disrupt the role of the CIO. A new breed of digital-savvy CIOs with digital backgrounds will emerge and demand a new title to fit their transformation,” Forrester says.

The research firm also predicts that AI and Internet of Things will remain hot, “blockchain will simmer, and quantum will gather steam”, while digital business platforms are just “a wave” and companies will either build them or deliver through them.

In a further prediction, Forrester says the pace of automation across industries will pick up significantly around the world in 2018, altering the shape of the global workforce.

Forrester expects the global market for automation will accelerate faster in the New Year as enterprises aim to enhance performance and garner insights from commodity tasks.

And, according to Forrester, automation will eliminate 9% of US jobs but create 2% more and “a political automation backlash” will briefly impede progress – and lose, while bots, backed by AI, will alter traditional information management.

Other predictions for 2018 from Forrester include:

Artificial intelligence: the honeymoon for AI is over: blended AI will Disrupt customer service and sales strategy

CIOs will move away from the lift-and-shift approach to AI tech implementations, and new applications of blended AI will increasingly be used to improve customer service and sales processes in the New Year. In addition, Forrester predicts that AI will make decisions and provide real-time instructions at 20% of firms and will increasingly be used for visual experience.

Blockchain: be ready to face the realities behind the blockchain hype

It says 2018 will be the year CIOs will exploit the potential of blockchain technology. While there will be steady improvement and a few breakthroughs, don’t expect a major leap in technology maturity in 2018. In addition, CIOs, CISOs will pay greater attention to blockchain security, and blockchain will start to transform fraud management and identity verification. Banking processes will also see heterogeneous blockchain adoption in 2018.

Cloud computing accelerates enterprise transformation everywhere

Public cloud adoption will reach a 50% adoption rate in 2018, which is a significant milestone for enterprises. Looking at the factors shaping the cloud computing landscape next year, Forrester also predicts that the market should expect further consolidation through 2020. Enterprises will shift 10% of their traffic from carrier backbones to other providers, and telecom providers will feel the effects.

Cyber security: businesses will face even more challenges In 2018

Rising tensions in international relations, ubiquitous connectivity, digital transformation initiatives and the data economy will have a large impact on cyber security. Forrester has six predictions for cyber security in 2018, including: Governments will no longer be the sole providers of reliable, verified identities; More IoT attacks will be motivated by financial gain than chaos; and blockchain will overtake AI in VC funding and security vendor roadmaps.

IoT moves from experimentation to business scale

IoT technologies will dictate how companies deliver high-value experiences for their customers next year. Increased consumer adoption and advances in AI are fuelling the improvement of connected devices, and the quality of voice services will boost adoption of IoT devices. In addition, IoT will be at the center of broader and more damaging cyber attacks as hackers seek to compromise systems to extract sensitive data.

Employee experience powers the future of work

An engaged workforce boosts customer experience and revenue performance. While Forrester predicts that employee engagement won’t improve in 2018, technology leaders must stay on top of micro trends like collaboration and employee technology as well as macro issues, such as how automation is reshaping labor, as they are thrust into the forefront to help create the conditions for a positive employee experience.

Mobile evolves into the digital experience conductor

Next year is the year that mobile becomes core to the digital ecosystem. While many firms believe that they’ve checked the box on mobile, they also should note that what is changing is the next generation of consumer experiences on these devices. Smart firms will continue to invest heavily in the underlying technology: the architecture, talent, and process to deliver these experiences. Emerging tech like AR, AI and chatbots will continue to pique interest but mainstream breakthrough is still further off.

Wages Growth Stalls Again

The seasonally adjusted Wage Price Index (WPI) rose 0.5 per cent in the September quarter 2017 and 2.0 per cent over the year, according to figures released today by the Australian Bureau of Statistics (ABS). This was below consensus expectation, and continues the slow grind in household income, for many falling below the costs of living.  Those in the public sector continue to do better than those in the private sector.

The WPI, seasonally adjusted, has recorded quarterly wages growth in the range of 0.4 to 0.6 per cent for the last 13 quarters (from the June quarter 2014).

ABS Chief Economist Bruce Hockman said: “Annual wages growth increased marginally to 2.0 per cent in the September quarter 2017. The higher wage growth in the September quarter was driven by enterprise agreement increases, end of financial year wage reviews and the Fair Work Commission’s annual minimum wage review.”

Seasonally adjusted, private sector wages rose 1.9 per cent and public sector wages grew 2.4 per cent through the year to the September quarter 2017.

In original terms, through the year wage growth to the September quarter 2017 ranged from 1.2 per cent for the Mining industry to 2.7 per cent for Health care and social assistance and Arts and recreation services.

Western Australia recorded the lowest through the year wage growth of 1.3 per cent and Victoria, Queensland and Tasmania the highest of 2.2 per cent.

Westpac capital requirements increased after breaching regulatory obligations

The Reserve Bank in New Zealand says that Westpac New Zealand Limited (Westpac) has had its minimum regulatory capital requirements increased after it failed to comply with regulatory obligations relating to its status as an internal models bank.

Internal models banks are accredited by the Reserve Bank to use approved risk models to calculate how much regulatory capital they need to hold. Westpac used a number of models that had not been approved by the Reserve Bank, and materially failed to meet requirements around model governance, processes and documentation.

“This is very disappointing. Operating as an internal models bank is a privilege that requires high standards and comes with considerable responsibilities. Westpac has not met our expectations in this regard,” Reserve Bank Deputy Governor and Head of Financial Stability Geoff Bascand said.

The Reserve Bank required Westpac to commission an independent report into its compliance with internal models regulatory requirements. The report found that Westpac:

  • currently operates 17 (out of 35) unapproved capital models;
  • has used 21 (out of 32) additional unapproved capital models since it was accredited as an internal models bank in 2008; and
  • failed to put in place the systems and controls an internal models bank is required to have under its conditions of registration.

The Reserve Bank has decided that Westpac’s conditions of registration should be amended to increase its minimum capital levels until the shortcomings and non-compliance identified in the independent report have been remedied.  Westpac’s minimum capital ratio requirements will be 6.5 percent for Common Equity Tier 1 capital, 8 percent for Tier 1 capital and 10 percent for Total capital, with the additional 2.5 percent capital conservation buffer applying.  Currently, for all other locally incorporated banks capital ratios are set at, respectively, 4.5 percent, 6 percent and 8 percent, plus the 2.5 percent buffer.

In addition, the Reserve Bank has accepted an undertaking by Westpac to maintain its total capital ratio above 15.1 percent until all existing issues have been resolved.  The Reserve Bank has given Westpac 18 months to satisfy the Reserve Bank that it has sufficiently addressed those issues or it risks losing accreditation to operate as an internal models bank.

“We believe the regulatory action is appropriate given the seriousness of Westpac’s non-compliance and the need to protect the integrity of the capital regime,” Mr Bascand said.

The Reserve Bank has taken into account that Westpac has not deliberately sought to reduce its regulatory capital. While there have been serious shortcomings and  non-compliance, it appears that Westpac has remained well above its required regulatory capital levels.

Westpac has confirmed that it does not dispute the findings of the independent report, that it is committed to remedying all the issues identified, and that it will maintain its total capital ratio above 15.1 percent.

Major aggregator issues fraud warning to brokers

From The Adviser.

One of the industry’s largest aggregators has said that brokers are “on the front line” of preventing mortgage fraud as regulators turn their attention to the third-party channel.

In a compliance update this week, Connective pointed to findings from the 2016 Veda Cybercrime and Fraud Report, which recorded a 27 per cent year-on-year increase in falsifying personal information.

“Falsified documentation — particularly documents that verify a customer’s income — is the most common type of fraud that a mortgage broker is likely to encounter,” the aggregator said.

“It is your responsibility to ensure [that] the income declared on a customer’s loan application truly reflects their actual income. That puts you on the front line in terms of mortgage fraud prevention.”

Since 2010, ASIC has investigated more than 100 matters relating to loan fraud, and it banned, suspended or placed conditions on the licenses of more than 80 individuals or companies.

“We can only expect this scrutiny to intensify,” Connective said. “Quite recently, one mortgage broker was actually jailed for five years for colluding with clients over fraudulent loan applications.”

The award-winning aggregator urged brokers to carefully check income and verify living expenses by “studying” payslips and bank statements.

“You should check carefully to ensure that these documents, particularly the payslip, contain the information you would reasonably expect to see, and make an effort to check [that] the documents have not been altered or doctored.”

Connective provided this list of what should appear on a payslip:

  • Employer’s and employee’s names
  • Employer’s Australian Business Number (if applicable; verify by looking it up online)
  • Pay period
  • Date of payment
  • Gross and net pay
  • Hourly rates and amount paid
  • Any allowances or bonuses
  • Superannuation deductions
  • Any other deductions (such as child support payments, HECS payments)
  • Leave balances
  • A year to date summary

“If you are in any doubt, it is a good idea to ask your customer’s permission to call their employer and verify the information in their payslip,” Connective said. “If they refuse to give you permission, this can be considered a red flag.”

Back in June, Equifax BDM Steve Arsinoski informed brokers at a Pepper Money roadshow that 13 per cent of frauds reported were targeting home loans and there has been a 25 per cent year-on-year increase in frauds originating from the broker channel.

NAB streamlines loan process for brokers

From Australian Broker.

National Australia Bank (NAB) has announced a series of changes that will make its digital home loan capabilities more efficient for brokers and their clients.

The bank has introduced two online verification tools, IDme and ZipID, that allow brokers to securely collect customer identification from their mobile devices. NAB will also add DocuSign to its suites of tools in 2018 so customers can sign documents anywhere from their phone or tablet.

“We are focused on using smart technology to make it easier for brokers to both collect customer information and submit documentation, simplifying the home loan process,” said Steve Kane, NAB general manager of broker distribution.

These improvements have been rolled out as part of the bank’s Helping You Accelerate campaign which seeks to enhance the home loan experience for both brokers and customers.

Brokers will gain access to a variety of digital tools and personalised support from NAB to help guide them through the home loan process and deliver a positive experience to clients.

“In 2017 we have made a range of changes to make submitting home loan applications easier, simpler and more efficient for brokers and their customers,” said Kane.

The Helping You Accelerate campaign will help brokers get the most out of the support NAB offers by integrating its tools and assistance into a simple, step-by-step guide, he added.

“It’s yet another way we are showing our commitment to the broker channel.”

Over the past 12 months, NAB has rolled out a number of other initiatives to assist brokers such as its renewed small business offerings for SME clients and the Customer Adviser Broker Program which saw the bank install support experts in more than 20 branches with the specific remit of on-boarding broker clients.

“These initiatives are just a few examples of how NAB is listening to the insights of our brokers and continually improving the broker-customer experience. It’s just one step closer to becoming the bank for brokers,” Kane said.