‘World-first’ home loan auction platform launches

From The Adviser.

The “world’s first auction-style platform” for loans and deposits has launched, enabling consumers to tender their home loan needs to both brokers and lenders.

Australian fintech Lodex has launched a new online platform that enables borrowers to set up an auction for their home loans, car loans, personal loans (and eventually deposit/savings accounts, credit cards and short-term loans) on their smart device or computer.

After building their anonymous profile, which outlines the lending requirements, and accessing their credit score (via Experian) and social score (via Lenddo) — or “financial potential” for deposits — consumers can then post their loan or deposit requests and wait for offers to come in.

The scores aim to provide lenders and brokers with insights into their individual credit risk, without affecting consumers’ credit score.

All registered lenders and brokers can place indicative offers on the platform within four days.

The consumer, which uses the platform for free, then picks the most suitable deal.

According to co-founders and banking executives Michael Phillipou and Bill Kalpouzanis, Lodex is “the world’s first auction-style platform” that aims to create a “paradigm shift” in the loan process.

Speaking to The Adviser, Mr Phillipou said: “We’re entering exciting times for consumers, lenders and brokers alike. Lodex aims to support all sides in the marketplace. We’re encouraging innovation because it benefits everyone.”

The director elaborated: “From a broker’s perspective, it’s pretty straightforward… everyone is looking for business, everyone is looking for leads and the markets are moving digitally. So, if I’m a broker, I’d always be looking for opportunities to connect with consumers.

“From our perspective, what we’ve done through the platform is to enable a consumer to have significant power, and through that power using data and technology, enable them to get access to a marketplace where they want choice.”

Mr Phillipou, however, said that the platform is not purely focused on rate.

“The consumer can build a unique profile and set out a number of requirements based on what they are looking for,” the co-founder said.

“So, a broker or lender has a number of different attributes based on what the consumer is requesting that enables them to provide an indicative offer [for example, brokers could theoretically provide sub-prime offers via their specialist lender accreditations]. It’s obviously only indicative because any interaction is subject to responsible lending and these brokers and lenders still need to go through their respective steps in order to comply with their responsible lending obligations to make sure it is still suitable.”

The platform is already looking at launching into overseas markets, particularly South East Asia and Europe, which have similar distribution and regulatory frameworks.

The Lodex Advisory Board includes chairman Andrew McEvoy, a former executive at Fairfax Media and managing director of Tourism Australia; marketing and advertising adviser Sean Cummins, the global CEO of Cummins and Partners; strategy adviser Kimberly Gire, a former CFO of retail & business bank at Westpac; and strategy adviser Francesco Placanica, the former CTO of Commonwealth Bank.

Banks Must Go Digital To Protect Margins

Looking across the world of banking, there is one striking trend according to the latest Mckinsey Global Banking Report. Profit remains elusive as margins are crushed. Return on equity is stuck in a range of 8 to 10 per cent (though we note Australian Banks’ are higher!, but are still falling). Recovery from the 2007 banking crisis has, they say, been tepid.

Underlying this is a slowing in revenue growth, currently as low as 3%, half that of the previous five years – so margins are down 35 basis points in China and 46 basis points in the USA. They suggest that in a fully disrupted world ROE could fall to around 5%, compared with around 9.3% without disruption.

They claim the biggest contribution to profitability is not geography, but a bank’s business model.

We found that “manufacturing”—the core businesses of financing and lending that pivot off the bank’s balance sheet—generated 53.0 percent of industry revenues, but only 35.0 percent of profits, with an ROE of 4.4 percent. “Distribution,” on the other hand—the origination and sales side of banking—produced 47 percent of revenues and 65 percent of profits, with an ROE of 20 percent.

Now new digital platform players are threatening customer relationships and stealing margin. But Fintechs, which were seen as an outright threat initially, are now collaborating with major players, for example Standard Chartered and GlobalTrade, Royal Bank of Scotland and Taulia, and Barclays and Wave.

“digital pioneers are bridging the value chains of various industries to create “ecosystems” that reduce customers’ costs, increase convenience, provide them with new experiences, and whet their appetites for more.”

So they argue, banks are at a cross roads. Should banks participate in this new digital ecosystem or resit it? To participate, banks will have to deploy a vast digital toolkit. This offers a path to sustainable higher ROE, perhaps. This is a substantive digital transformation, designed from customer centricity.

The point, we would add from our Quiet Revolution banking channel analysis, is that customers are already ahead of banks, demanding more and better digital services, so first in best dressed!


Another Weak Set of Auction Results – 11 Nov 2017

The Domain preliminary auction clearance results are in, and they appear to reveal another weak result, especially in the Sydney market.  The overall rates are lower than this time last year.

The clearance rate in Brisbane was 32% on 143 listed,  Adelaide achieved 76% on 81 scheduled and Canberra 71% on 102 auctions.

Another Nice Mess – The Property Imperative Weekly – 11 Nov 2017

In our latest weekly update, we explore how that RBA is caught between stronger global economic indicators, and weaker local conditions, and what this means for local households, the property market and banks.

Welcome to the Property Imperative weekly to 11th November 2017. Read the transcript or watch the video.

We start this weeks’ digest with the latest results from the banking sector.

CBA’s 1Q18 Trading Update reported a rise in profit, and volumes, as well as a lift in capital. Expenses were higher, reflecting some provisions relating to AUSTRAC, but loan impairments were lower. WA appears to be the most problematic state. Their unaudited statutory net profit was around $2.80bn in the quarter and their cash earnings was $2.65bn in the quarter, up 6%. Both operating income and expense was up 4%.

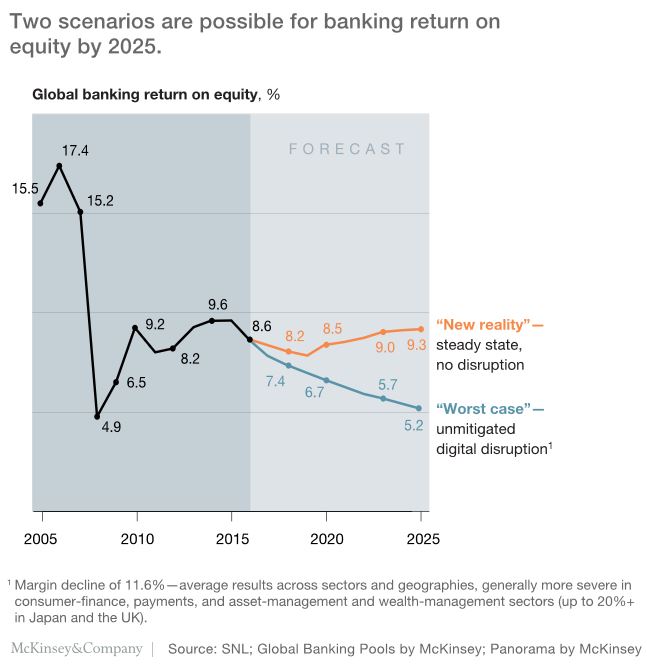
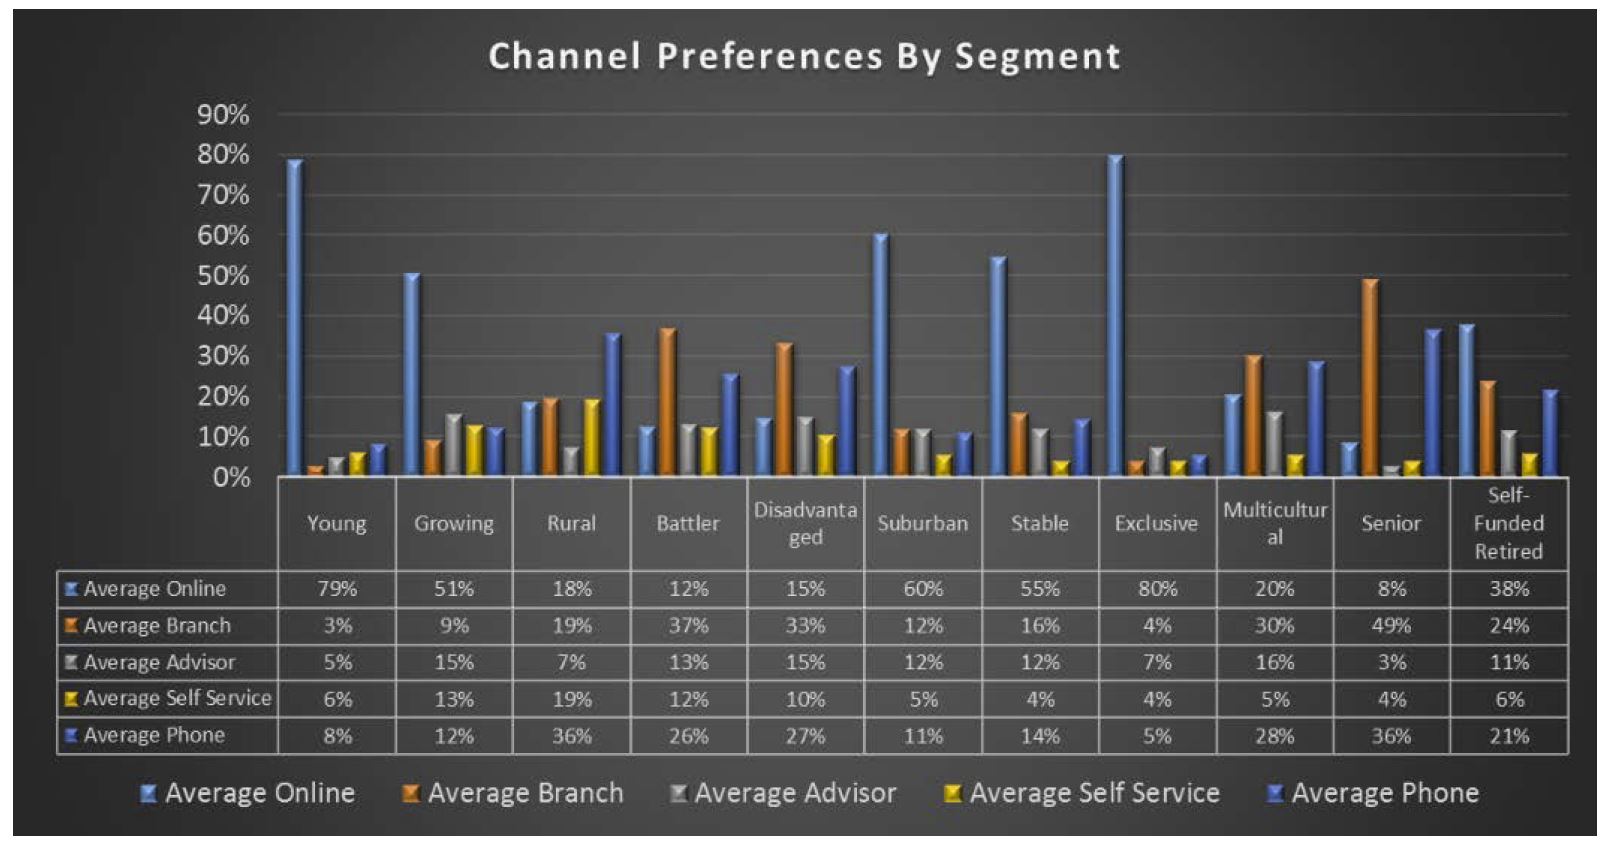
Westpac’s FY17 results were a bit lower than expected, impacted by lower fees and commissions, pressure on margins, the bank levy and a one-off drop to compensate certain customers.  Despite a strong migration to digital, driving 59 fewer branches and a net reduction of ~500 staff, expenses were higher than expected. There has been a 23% reduction in branch transactions over the past two years in the consumer bank, once again highlighting the “Quiet Revolution” underway and the resulting problem of stranded costs. Treasury had a weak second half. But the key point, to me, is that around 70% of the bank’s loan book was in one way or another linked to the property sector, so future performance will be determined by how the property market performs. Provisions were lower this cycle, and at lower levels than recent ANZ and NAB results. WA mortgage loans have the highest mortgage arrears but were down a bit.

Looking at mortgage defaults across the reporting season, there were some significant differences. Some, like Westpac, indicated that WA defaults in particular are easing off now, while others, like ANZ and Genworth, are still showing ongoing rises. This may reflect different reporting periods, or it may highlight differences in underwriting standards. Our modelling suggests that the rate of growth in stress in WA is indeed slowing, but it is rising in NSW (see the Nine TV News Segment on this which featured our research) and VIC; and there is an 18 to 24-month lag between mortgage stress and mortgage default. So, in the light of expected flat income growth, continued growth in mortgage lending currently at 3x income, rising costs of living and the risk of international funding rates rising too, we think it is too soon to declare defaults have peaked. One final point, many households have sufficient capital buffers to repay the bank, thanks to ongoing home price rises. Should prices start to fall, this would change the picture significantly.

Banks have enjoyed strong balance sheet growth in recent years as they lend ever more for mortgages, at the expense of productive business lending. A number of factors have driven the housing boom including population and income growth for the past 25 years, a huge fall in interest rates and increases in the tax advantages to property investment through negative gearing and the halving of the capital gains tax level.

Fitch Ratings says the banks’ had solid results for the 2017 financial year, supported by robust net interest margins and strong asset quality. However, Australia’s four major banks will face earnings pressure from higher impairment charges and lower revenue growth in their 2018 financial year, and cost control to remain an important focus. They benefitted from the APRA inspired repricing of mortgages, and from lower impairment charges. Fitch said that mortgage arrears have increased modestly from low bases in most markets – Western Australia has had more noticeable deterioration – and they expect this trend to continue in FY18 due in part to continued low wage growth and an increase in interest rates for some types of mortgages.

The latest household finance data from the ABS confirms what we already knew, lending momentum is on the slide, and first time buyers, after last month’s peak appear to have cooled. With investors already twitchy, and foreign investors on the slide, the level of buyer support looks anaemic. Expect lots of “special” refinance rates from lenders as they attempt to sustain the last gasp of life in the market.

The number of new loans to first time buyers was down 6.3%, or 630 on last month. We also see a fall in fixed loans, down 14%.  The DFA sourced investor first time buyers also fell again, down 4%. More broadly, the flow of new loans was down $19 million or 0.06% to $33.1 billion. Within that, investment lending flows, in trend terms, fell 0.52% or $62.8 million to $12.1 billion, while owner occupied loans rose 0.32% or $47.7 million to $15.0 billion.  So investment flows were still at 44.6% of all flows, excluding refinances. Refinances comprise 17.9% of all flows, down 0.07% or $3.9 million, to $5.9 billion.

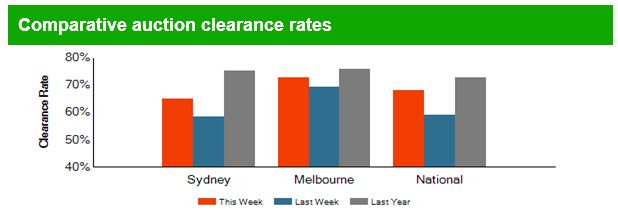
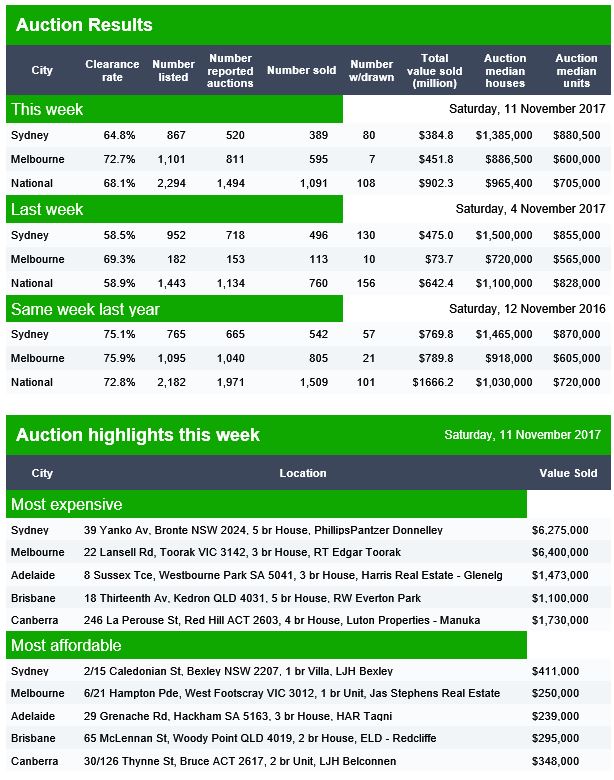
Auction volumes were also lower this past week, partly because of the Melbourne Cup festivities, and CoreLogic’s latest data suggests a slowing trend, more homes listed, and further home price falls in Greater Sydney. As a result, we expect home lending to trend lower ahead.

The MFAA says there has been a boom in mortgage brokers, but this may be unsustainable, given lower mortgage growth.  The snapshot, up to March 2017, shows that the number of brokers was estimated to be 16,009, representing 1 broker for every 1,500 in the population and they originated around 53% of new loans.  Overall the number of brokers rose 3.3% but net lending grew only 0.1%. As a result, the average broker saw a fall in their gross annual income. Also, on these numbers, brokers cost the industry more than $2 billion each year!

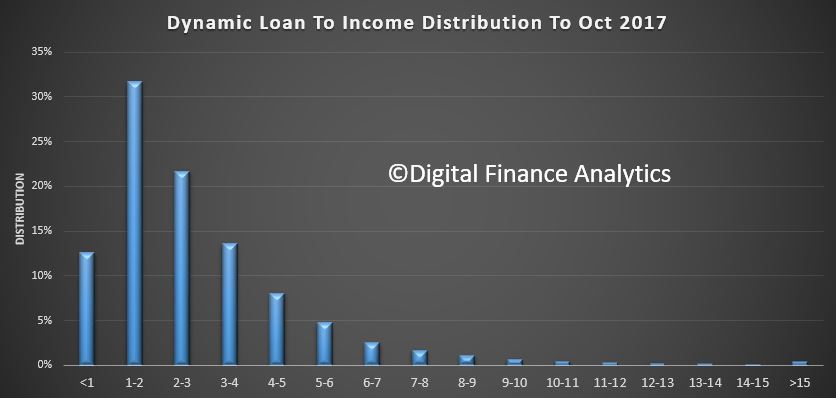
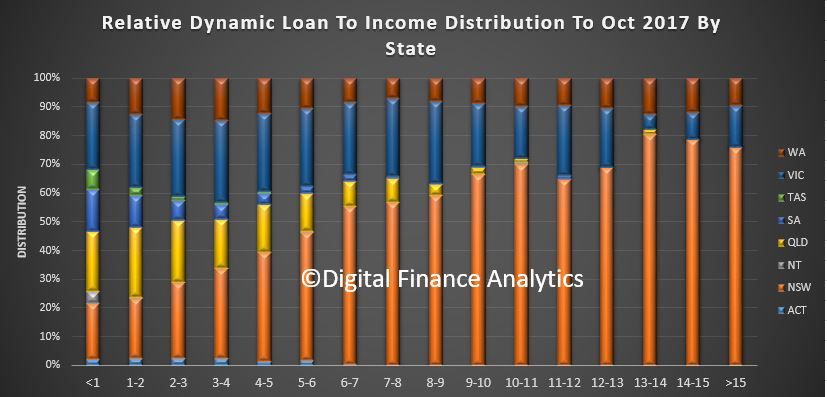
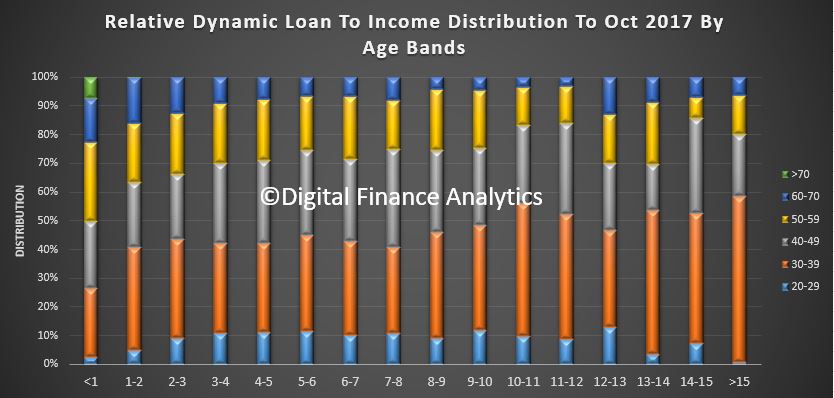
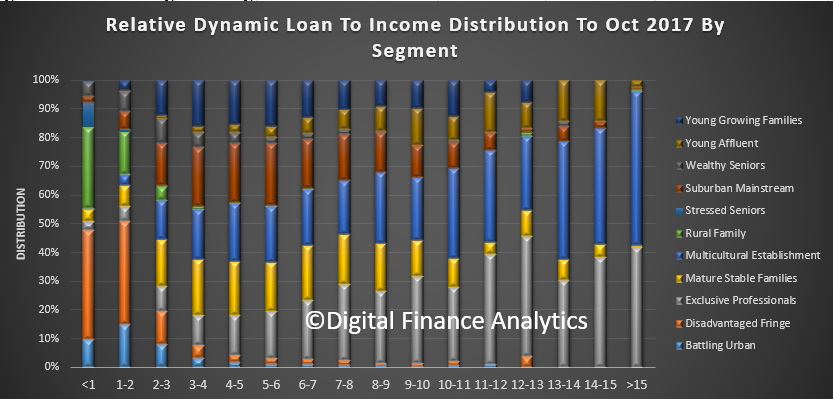
We published data on the dynamic loan-to-income data (LTI) from our household surveys. Currently we estimate that more than 20% of owner occupied mortgage loans on book have a dynamic LTI of more than 4 times income. Some LTI’s are above 10 times income, and though it’s a relatively small number, they are at significantly higher risk. Looking at the data by state, we see that by far the highest count of high LTI loans resides in NSW (mainly in Greater Sydney), then VIC and WA. Younger households have a relatively larger distribution of higher LTI loans. Reading across our core segmentation, we see that Young Affluent, Exclusive Professional and Multi-Cultural Establishment are the three groups more likely to have a high dynamic LTI. We also see a number of Young Growing Families in the upper bands too. As many lenders also hold the transaction account for their mortgage borrowers, it is perfectly feasible to build an algorithm which calculates estimated income dynamically from their transaction history, and use this to estimate a dynamic LTI. This would give greater insight into the real portfolio risks, compared with the blunt instrument of LVR. It is less misleading that LTI or LVR at origination.

The latest edition of our Household Financial Security Confidence Index to end October shows households are feeling less secure about their finances than in September. The overall index fell from 97.5 to 96.9, and remains below the 100 neutral setting. We use data from our household surveys to calculate the index.  While households holding property for owner occupation remain, on average, above the neutral setting, property investors continue to slip further into negative territory, as higher mortgage rates bite, rental returns slide and capital growth in some of the major markets stalls.  Property inactive households remain the most insecure however, so owning property in still a net positive in terms of financial security. There are significant variations across the states. VIC households continue to lead the way in terms of financial confidence, and WA households are moving up from a low base score. However, households in NSW see their confidence eroded as prices slide in some post codes (the average small fall as reported does not represent the true variation on the ground – some western Sydney suburbs have fallen 5-10% in the past few months). Households in QLD and SA on average have held their position this month. Confidence continues to vary by age bands, although the average scores have drifted lower again. Younger households are consistently less confident, compared with older households, who tend to have smaller mortgages relative to income, and more equity in property and greater access to savings.

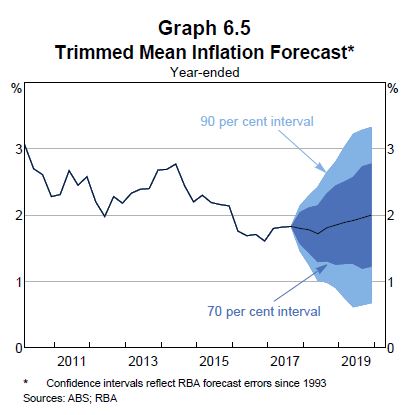
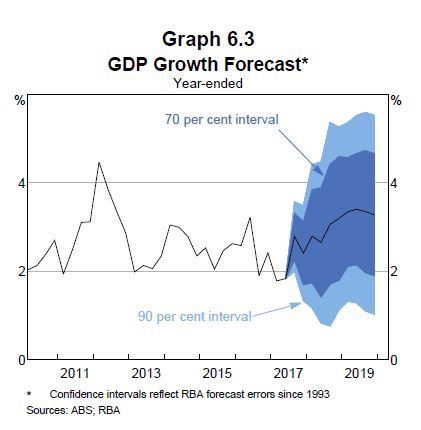
As expected the RBA held the cash rate again this week, for the 15th month in a row.  The RBA’s statement on Monetary Policy highlighted the tension between stronger global growth, reflected in expected rising interest rate benchmarks in several countries, including the USA; and weaker inflation and growth in Australia. As a result, pressure to lift the cash rate here appears lower than before. Underlying inflation is expected to remain steady at around 1¾ per cent until early 2019, before increasing to 2 per cent. The revised CPI weightings now announced by the ABS, will tend to reduce the inflation numbers in the next release. The RBA suggests growth will be lower for longer though is still holding to a 3% growth rate over their forecast period, They also highlighted the impact of stagnant wage growth and high household debt once again.

If rates do stay lower for longer here, it may benefit households already suffering under mountains of mainly housing related debt, but put pressure on the dollar and terms of trade, as rates overseas climb, sucking investment dollars away from Australia and lifting funding costs. Some are suggesting that the gap between income and credit growth, 2% compared with 6% over the past year, will require the RBA to lift the cash rate sooner, and ANZ for example is still forecasting rate hikes in 2018.

International conditions are on the improve, and many assume the rises in benchmark cash rates will be slow and steady. However, A GUEST post on the unofficial Bank of England’s “Bank Underground” blog makes the point, by looking at data over the past 700 years, that most reversals after periods of interest rate declines are rapid. When rate cycles turn, real rates can relatively swiftly accelerate. The current cycle of rate decline is one of the longest in history, but if the analysis is right, the rate of correction to more normal levels may be quicker than people are expecting – and a slow rate of increases designed to allow the economy to acclimatize may not be possible.  Not pretty if you are a sovereign or household sitting on a pile of currently cheap debt!

So, we see on one side global conditions improving, with interest rates set to rise, while locally economic indicators are weakening suggesting the RBA may hold the cash rate lower for longer. This is creating significant tension, and highlights the dilemma the regulators face. But as we said before, this is a problem of their own making, as they dropped rates too far, and did not recognise the growing risks in the housing sector soon enough. So, already on the back foot, we expect to see some further targeted regulatory intervention, and we expect the cash rate to stay lower for longer, until the international upward pressure swamps the local situation. We think this may be much sooner than many, who are now talking of no rate change for a couple of years.  Meantime households with large loans, little income growth and facing rising costs will continue to spend less, tap into savings, and muddle though. Not a good recipe for future growth, and economic success. As Laurel and Hardy used to say ” Well, here’s another nice mess you’ve gotten me into!”

And that’s the Property Imperative Weekly to 11th November 2017. If you found that useful, do leave a comment, subscribe to receive future updates, and check back next week.

Could we nationalise the superannuation system even if we wanted to?

From The Conversation.

Two decades of reforms, reviews and inquiries appear to have better served the financial sector than the interests of super fund members.

At first glance Australia’s 214 major superannuation funds are performing well, giving a healthy 9.2% return on the A$1.4 trillion we have deposited with them. But there are issues with our publicly mandated but privately controlled superannuation system.

Admittedly, our current system provides a range of benefits – increasing retirement incomes, giving us plenty of choice between funds (in theory if not in practice), and investing in the Australian economy.

But the operating expenses for Australian funds consistently and significantly outstrip those in other OECD countries. Fees are high and there is little evidence that higher fees lead to better services.

In 2009 the Inquiry into Financial Products and Services in Australia recommended there be an annual check on the quality of advice. The only superannuation-related survey that has been undertaken to date found that 39% of advice was poor and only 3% was good quality. No further surveys have been conducted.

Australians are forced to contribute to superannuation funds, without the right of exit, but they aren’t protected from high fees or bad investment strategies. A nationalised superannuation system, or one that combines private and public super funds, could simplify the system and reduce costs.

Baked in problems

Australia’s system wasn’t originally intended to be entirely privately-run, which has left us without many necessary protections (such as appropriate disclosure of fees and charges).

Australia was almost alone among OECD countries in reaching the 1980s with no national employment-related retirement income scheme. There had been at least ten attempts to set one up between the 1890s to the 1970s. All failed to win support from employers, existing superannuation funds, life offices and state governments.

An additional attempt was made in the last Parliament of the Liberal government in 1972. The incoming Whitlam Labor government also tried to introduce a national superannuation scheme in 1973, establishing the Hancock inquiry.

Consistent with its recommendations, the Hawke/Keating Labor government intended to move forward with a national scheme. However, against the backdrop of past nationalisation failures, recession, high inflation, a wage freeze, strikes, declining union membership, and the increasing discontinuation of superannuation products, the government instead privatised it.

Thus, the Hawke/Keating Labor government was a major winner of a privatised scheme gaining electoral support from a coalition of private interests.

Absent from this coalition were the fund members. There is no evidence of any consultation process with either the fund members themselves and/or any consumer representative groups prior to the development of our present, privatised regime.

The Superannuation Guarantee scheme introduced a minimum employer contribution to superannuation for most employees. This scheme was a windfall for the financial sector, as they received a guaranteed, trillion-dollar stream of superannuation contributions to look after with no exit rights for members.

The union movement would also appear to be a winner from privatisation. The privatised system allowed the unions to expand the number of their existing industry funds to earn more administration and investment-based fees. The 41 industry funds currently hold A$545.2 billion, compared to the A$587.8 billion held by the 128 for-profit retail funds.

It could be argued that the losers in this mandatory regime are the fund members who were marginalised from the outset. As it was originally intended to be a government-run system, many of the administrative processes necessary for an efficient and effective privatised system were originally absent.

For example, there were no codified accounting, reporting and disclosure requirements. No mandatory requirements for the disclosure of fees and charges. No codified audit report requirements. And, for nearly a decade, the regulator did not have appropriate constitutional powers to enforce civil and criminal penalties against non-complying trustees.

Two-decades of reforms have remedied the constitutional, auditing and accounting issues. But significant issues remain, including limitations in the disclosure of fees and charges and the related issue of conflicted payments.

Alternative super systems

In theory, there are alternative superannuation models for Australia to consider. For example, there are nationalised schemes such as the government-run Canadian Pension Plan.

All of the funds from the Canadian Pension Plan are invested by Canada’s Pension Plan Investment Board, which operates with a clear mandate to maximise returns, without undue risk of loss.

Nationalising the superannuation industry in this way appears to have benefits – members would receive the same return for equal contributions, employers and employees would only have to deal with one fund, and the amount spent on running the fund (for example on administration, marketing) would be reduced.

There is also the option of adopting a combined system, as in Norway, which features both national and privately-run superannuation funds.

In reality however, given the coalition of vested interests that have forged Australia’s existing, publicly mandated, privatised system, only the voice of the members themselves can force an honest and open debate on this important issue.

Author: Suzanne Taylor, Lecturer/Co-Ordinator, Queensland University of Technology

Machine Learning, Analytics And Central Banking

The latest Bank Underground blog post “New Machines for The Old Lady”,  explores the power of machine learning and advanced analytics.

Rapid advances in analytical modelling and information processing capabilities, particularly in machine learning (ML) and artificial intelligence (AI), combined with ever more granular data are currently transforming many aspects of everyday life and work. In this blog post we give a brief overview of basic concepts of ML and potential applications at central banks based on our research. We demonstrate how an artificial neural network (NN) can be used for inflation forecasting which lies at the heart of modern central banking.   We show how its structure can help to understand model reactions. The NN generally outperforms more conventional models. However, it struggles to cope with the unseen post-crises situation which highlights the care needed when considering new modelling approaches.

Similarly to the victory of DeepBlue over chess world champion Garry Kasparov in 1997, the 2017 victory of AlphaGo over Go world champion Ke Jie is seen as a hallmark of the advancements of machine intelligence. Both victories were made possible by rapid advancements of information technologies, however in different ways. For DeepBlue, it was improvements in computer memory and processing speed. But for AlphaGo, it was the ability to learn from and make decisions based on rich data sources, flexible models and clever algorithms.

Recent years have seen an explosion in the amount and variety of digitally available data (“big data”). Examples are online activities, such as online retail and social media or from the usage of smartphone apps. Another novel source is the interaction of the gadgets themselves, e.g. data from a multitude of sensors and the connections of everyday devices to the internet (the “internet of things”).

Monetary policy decisions, the supervision of financial institutions and the gauging of financial market conditions – the common tasks of the Bank of England and many other central banks – are certainly data-driven activities. However, these have traditionally been fuelled by relatively “small data”, often in the form of monthly or quarterly time series. This also changed in recent years, partly driven by reforms following the Global Financial Crisis 2008 (GFC), which handed central banks and regulators with additional powers, responsibilities and more data. These novel data sources and analytical techniques provide central banks, and also the economics profession more widely, with new opportunities to gain insights and ultimately promote the public good.

What is machine learning?

ML is a branch of applied statistics largely originating from computer science. It combines elements of statistical modelling, pattern recognitions and algorithm design. Its name can be interpreted as designing systems for automated or assisted decision making, but not (yet) autonomous robots in most cases. Hence, ML is not a fixed model or technique, but rather an analytical toolbox for data analysis, which can be used to tailor solutions for particular problems.

The main difference between ML and conventional statistical analysis used in economic and financial studies (often summarised under the umbrella of econometrics) is its larger focus on prediction compared to causal inference. Because of this, machine learning models are not evaluated on the basis of statistical tests, but on their out-of-sample prediction performance, i.e., how the model describes situations it hasn’t seen before. A drawback of this approach is that one may struggle to explain why a model is doing what it does, commonly known as the black box criticism.

The general data-driven problem consists of a question and a related dataset. For example, “What best describes inflation given a set of macroeconomic time series?” This can be framed as a so-called supervised problem in ML terminology. Here, we are trying to model a concrete output or target variable Y (inflation), given some input variables X.  These supervised problems can be further segmented into regression and classification problems. The regression problem involves a continuous target variable, such as the value of inflation over a certain period of time. Classification, in the other hand, involves discrete targets, e.g. if inflation is below or above target at certain point in time, or if a bank is in distress or not. Alongside this, there is also unsupervised machine learning where no such labelled target variable Y exists. In this case, any ML approach would try to uncover an underlying clustering structure or relationships within data. These main categories of machine learning problems are shown in Figure 1. We discuss a case study for all three problem types in SWP 674: Machine learning at central banks. Case study 3 on analysis tech start-ups with a focus on financial technology (fintech) is also reviewed in this post.

Figure 1: Machine learning taxonomy. Case studies refer to SWP 674: Machine learning at central banks.

Case study: UK CPI inflation forecasting

As a simple example, we feed a set of macroeconomic time series (e.g. the unemployment rate or rate of money creation) into an artificial neural network to forecast UK CPI inflation over a medium-term horizon of two years and compare its performance to a vector autoregressive model with one lag (VAR). It is worth noting that this is not how central banks typically forecast inflation but it works well to see how ML techniques can be used.

An important aspect to consider here is that many ML approaches do not take time into account, meaning that they mostly focus on so-called cross sectional analyses. ML approaches which do take time into account are, among others, online learning or reinforcement learning. These approaches would need considerably more data than are available for our coarse-grained time series. We therefore take a different approach building temporal dependencies implicitly into our models. Namely, we match pattern in a lead-lag setting where changes in consumer prices lead changes or levels of other aggregates by two years. The contemporaneous 2-year changes of input variables and CPI target are shown in Figure 2, with the exception of the Bank rate, implied inflation from indexed Gilts and the unemployment level which are in levels. One can see that the crisis in the end of 2008 (vertical dashed line) represents a break for may series.

Figure 2: Selection of macroeconomic time series used as inputs and target of NN.

A key element of machine learning is training, i.e. fitting, and testing a model on different parts of a dataset. The reason for this is the mentioned absence of general statistical tests in many situations. The difference between training and test performance indicates then how well a model generalises to unseen situations. In the current setting this is performed within an expanding window setting where we successively fit the model on past data, evaluate its performance based on an unconditional forecast and then expand the training dataset by a quarter.

The result of this exercise is given in Figure 3, which shows the model output of a neural network (NN) with two hidden layers, technically a deep multi-layered perceptron.  This is a multi-stage model which combines weighted input data in successive layers and map these to a target variable (supervised learning). They are also at the forefront of recent AI developments. The NN model (green) in this unconditional forecast has an average annualised absolute error below half a percentage point over a two-year horizon during the pre-GFC period. This is already more than twice as accurate as the simple vector-autoregressive (VAR) benchmark model with one lag (grey line in Figure 3). The NN also shows relatively low volatility in its output, contrasted to the VAR.

Figure 3: ML model performance of combination of a deep neural network and support vector machine (green) relative to UK CPI inflation (blue). Red prediction intervals (PI) are constructed from sampled input data. The GFC only impacts the models in 2010 because of 2-year lead-lag relation of all models. Source: SWP 674.

Looking into the black box

ML models, particularly deep neural networks, are often criticised for being hard to understand in terms of their input-output relations. We can, however, get a basic understanding of the model in the current case as it is relatively simple. The model performance in Figure 3 drops markedly as soon as the effects from the GFC enter the model (vertical red dashed line), forecasting inflation persistently too low.

This behaviour can be understood when looking at the NN input structure before and after the GFC. Figure 4 depicts the relative weights stemming from different variables entering the first hidden layer of the neural network for pre and post-crisis data. This part of the NN has been identified to contribute the leading signal of the model’s output.  We see that changes in private sector debt and gross disposable household income (GDHI) provided the strongest signal in the pre-crisis period, as seen by the darker shades of normalised inputs. Particularly, the former saw a sharp drop at the onset of the crisis. Post-crisis, model weights gradually gave more importance to the increased level of unemployment. Both factors can explain why the neural network – wrongly in this case – predicted a sharp drop in inflation (see Figure 2).

The above discussion can best be thought of as a statistical decomposition. Artificial neural networks, like other machine learning approaches, are non-structural models focusing on correlations in the data. Therefore, care has to be given when interpreting the results of such an analysis. A strong correlation may or may not point to a causal relationship. Further analyses may be needed to pinpoint such a relation.

Figure 4: Pre and post crisis input weight structure to first (hidden) layer of neural network from macroeconomic time series inputs. Darker values indicate a stronger signal. Source: SWP 674.

Conclusion

We have given a very brief introduction of machine learning techniques and demonstrated how they might be used for tasks which central banks have been trusted with. Many of these tasks are linked to the availability of ever more granular data. Here, their particular strength lies in the modelling of non-linearities and accurate prediction.

However, care is needed when interpreting the outputs from ML models. For example, they do not necessary identify economic causation. The fact that a correlation between two variables has been observed in the past does not mean it will hold in the future, as we have seen in the case of the artificial neural network when it is faced with a situation not previously seen in the data, resulting in forecasts wide of the mark.

Chiranjit Chakraborty and Andreas Joseph both work in the Bank’s Advanced Analytics Division.

Note: Bank Underground is a blog for Bank of England staff to share views that challenge – or support – prevailing policy orthodoxies. The views expressed here are those of the authors, and are not necessarily those of the Bank of England, or its policy committees.

Australia’s Major Banks Face Earnings Pressure in FY18

Fitch Ratings expects Australia’s four major banks to face earnings pressure from higher impairment charges and lower revenue growth in their 2018 financial year, with cost control to remain an important focus. This follows the banks’ solid results for the 2017 financial year, supported by robust net interest margins and strong asset quality.

Australia and New Zealand Banking Group Limited (AA-/Stable), Commonwealth Bank of Australia (AA-/Stable), National Australia Bank Limited (AA-/Stable) and Westpac Banking Corporation (AA-/Stable) reported total statutory net profit after tax of AUD29.6 billion in FYE17 (up 30.3% compared with FYE16, which included National Australia Bank’s one-off losses on the sale and demerger of subsidiaries, or 6.4% higher based on cash net profit after tax).

Net interest margins held up well during the year despite strong competition for both retail deposits and loans. The major banks benefitted from asset repricing in the second half of the year largely in response to the Australian Prudential Regulation Authority’s (APRA) announced additional macro-prudential limits on mortgages in March 2017 (for more details, see Fitch: Further Regulatory Tightening Possible in Australia, dated 31 March 2017). Volume growth held up reasonably well during the year, which supported revenue growth, although this is likely to slow through the next financial year.

All four major banks reported lower impairment charges and a reduction in impaired assets (apart from a small uptick for Commonwealth Bank of Australia) relative to recent years, which also supported operating profits. Fitch expects the current impairment levels to be close to the peak of the asset quality cycle, with impairments likely to increase in FY18. Mortgage arrears have increased modestly from low bases in most markets – Western Australia has had more noticeable deterioration – and we expect this trend to continue in FY18 due in part to continued low wage growth and an increase in interest rates for some types of mortgages. However, interest rates in general are likely to remain low and we do not think unemployment will increase so any increase in mortgage arrears is likely to be modest and manageable.

The banks highlighted an ongoing focus on cost management, efficiency improvements, and investment, including in their IT systems and digital distribution, and regulatory changes in their FY17 results announcements. National Australia Bank especially flagged a significant increase in digital investment of AUD1.5 billion over three years to enhance its technology and customer experience. Rising investments and a focus on cost reduction to improve profitability will be a challenge for the major banks in the coming years. The banks are likely to face pressure on their profitability in the short term, although in the longer term these measures should improve efficiency. Conduct related charges may also have a negative impact on future costs.

Common equity Tier 1 (CET1) ratios are broadly at the regulator’s definition of “unquestionably strong” levels well ahead of the 2020 deadline. The CET1 ratios of National Australia Bank and Commonwealth Bank of Australia lag the other two major banks, but Fitch expects both to get to the minimum levels through internal capital generation, and, in the case of Commonwealth Bank of Australia, the sale of its life insurance business. Fitch is awaiting further clarification from APRA on how the “unquestionably strong” capital levels will be implemented, with the regulator likely to provide details by the end of this calendar year.

RBA Statement On Monetary Policy Released

The RBA’s latest Statement on Monetary Policy, released today, highlights the tension between stronger global growth, reflected in expected rising interest rate benchmarks in several countries, including the USA; and weaker inflation and growth in Australia. As a result, pressure to lift the cash rate here appears lower than before. Underlying inflation is expected to remain steady at around 1¾ per cent until early 2019, before increasing to 2 per cent.

GDP growth should strengthen over the rest of the forecast period as the drag from mining investment comes to an end and public demand and non-mining business investment continue to support growth.

So, they are holding to the above 2% inflation rate, and 3% growth rate over their forecast period.

However, if rates do stay lower for longer here, it may benefit households already suffering under mountains of mainly housing related debt, but put pressure on the dollar and terms of trade, as rates overseas climb sucking investment dollars away from Australia and lifting funding costs.

Here is their summary:

The Australian economy is expected to expand at a solid pace over the next couple of years, and labour market developments have been quite positive of late. The drag on growth from the end of the mining investment boom has eased and is likely to end sometime in the next year or so. Investment in the non-mining sector has been increasing but growth in consumption has been below average. Inflation and wage growth remain low. Both are expected to increase only gradually over time.

A number of factors are serving to hold inflation down. Wage growth has remained low and strong competition in the retail sector is dampening retail inflation across a broad range of goods. Although the unemployment rate has declined and is expected to fall further, some spare capacity is likely to remain in the labour market in the period ahead. It is also likely that structural factors and the adjustment following the terms of trade boom have been working to contain wage growth. Stronger labour market conditions are nonetheless expected to lead to a pick-up in wage growth over time. Important uncertainties influencing the outlook for inflation include the questions of how much wage growth might pick up as the labour market tightens, and how quickly the resulting increase in labour costs might feed into inflation.

Both headline and trimmed mean inflation were a little below 2 per cent over the year. Short-run fluctuations in the prices of volatile items such as fruit and vegetables added to the ongoing dampening effects of strong retail competition on the prices of tradeable goods and services.

Slow growth in labour costs and rents also contributed to inflation remaining low. Working in the opposite direction, cost pressures are feeding through into the prices of newly built homes. Tobacco and electricity prices have also boosted headline inflation and are expected to continue to do so. Headline inflation could also be a bit higher in the December quarter because petrol prices have risen noticeably in recent weeks.

Further out, the various measures of inflation are expected to reach 2–2¼ per cent by the end of the forecast period. The forecasts reflect an expectation that wage growth will gradually pick up. They also incorporate the effect of the slight appreciation of the Australian dollar since midyear. If the exchange rate were to appreciate further, economic activity and inflation would be likely to pick up more slowly than currently forecast. The Bank’s assessment of how inflationary pressures are likely to evolve is not affected by the forthcoming update to the weights used to calculate the consumer price index, although the forecasts have been lowered a little to account for this methodological change.

The outlook for the Australian economy is little changed from three months ago. Quarterly GDP growth is expected to have eased slightly in the September quarter. Beyond that, growth is forecast to average about 3 per cent over the next couple of years. Growth in resource exports will more than offset the diminishing drag from lower mining investment. The mining sector is therefore likely to contribute to economic growth over the forecast period, as will other categories of exports. Chinese demand for resources for steel production has supported bulk commodity prices. However, the terms of trade are generally expected to fall over the forecast period, reaching a level somewhat above the trough recorded in early 2016, because Chinese steel demand is expected to be lower, while global supply of iron ore will have increased further.

The outlook for business investment looks to be more positive than it has for some time. Reported business conditions are at a high level and, following recent data revisions, non‑mining business investment now appears to be increasing by more than previously thought. Forward-looking indicators, especially those for non-residential building, are consistent with this continuing. A considerable amount of public infrastructure work is planned or underway, particularly in the south-eastern states. This is contributing to activity of the private-sector firms undertaking this work on behalf of the public sector, as well as encouraging some of those firms to invest more themselves.

Growth in household consumption looks to have slowed in the September quarter given recent weakness in retail spending. Consumption growth is expected to pick up gradually, but slow growth in incomes and high levels of debt are constraining factors. The slow growth in household income has been driven primarily by unusually soft outcomes for average earnings of
employees as measured in the national accounts, which has more than offset the effects of strong employment growth. Wage growth has been slow, averaging an annual rate of around 2 per cent in recent quarters, but average earnings growth has been slower still. Shifts in the composition of employment within industries to lower-paid work might partly explain this, along with the usual volatility in this measure of average earnings.

Labour market conditions have strengthened considerably in recent months. Growth in employment has continued to outpace that of the working-age population. Employment has increased in all states and has been concentrated in full-time jobs. Forward-looking indicators of labour demand suggest that above-average employment growth will continue in coming quarters. Labour supply has also expanded in all states, driven by increasing participation of women and older workers retiring later than in the past. Measures of unemployment and underutilisation have declined.

Dwelling investment looks to have peaked earlier than previously expected, and the pipeline of projects to be completed is now being worked down in some states. Dwelling investment is nonetheless expected to remain at a high level over the next couple of years, but not to contribute to overall economic growth. This implies that housing supply will continue to expand at an above-average rate, which would tend to weigh on housing prices and rents in some markets.

Housing credit growth has eased a little, and the profile of new lending has shifted away from interest-only and other riskier types of lending. This suggests that recent prudential measures are helping to address risks in household balance sheets. Household debt remains high, however, and continues to increase faster than household income. Conditions in the established housing market have eased noticeably in Sydney, but have remained relatively strong in Melbourne. Housing prices are little changed recently in Brisbane and Perth. Growth in rents is below average in most cities, while in Perth rents continue to fall and vacancy rates are rising.

The global economy has strengthened further over the course of 2017. GDP growth was stronger than expected in the September quarter in most major economies for which data are available, and this strength appears to have been maintained. Conditions in manufacturing sectors are particularly buoyant, supported by the ongoing expansion in global trade, which is particularly benefiting economies in east Asia.

Growth in China continues to be stronger than earlier expected. Growth in infrastructure and construction activity remains robust and upstream price pressures have emerged. Announcements during the recent Party Congress pointed to the authorities’ continued resolve to tackle financial sector risks and the high level of debt. Also consistent with the authorities’ stated policy priorities, cuts to steel production have been mandated to improve environmental outcomes. This might reduce Chinese demand for iron ore and coking coal, at least temporarily. Iron ore prices have fallen in recent months partly in anticipation of this. More broadly, growth in China is expected to slow a little in coming years, because the working-age population is declining and the authorities seem less likely to use policy stimulus to maintain growth around current rates.

Conditions in the major advanced economies continue to improve. Labour markets have tightened further and unemployment rates have reached low levels in the United States, Japan, Germany and some smaller euro area member countries. Ongoing policy stimulus, a recovery in investment and the recent tendency for labour supply to increase all suggest that this above trend growth could persist for a while yet. Wage growth has so far picked up only a little in these economies, however, and inflation generally remains low. The experience of economies with tighter labour markets than Australia’s shows how long it can take for pricing pressures to emerge in an environment of strong local and global competition.

Central banks in a few countries have begun to raise policy rates and the US Federal Reserve is reducing the size of its balance sheet. Financial market pricing suggests that market participants expect policy accommodation globally to be withdrawn only gradually. Consequently, financial conditions continue to be very accommodative. Risk and term premiums have narrowed to low levels, as have spreads on corporate bonds. This has encouraged a rise in corporate bond issuance. Equity prices have risen in most markets. Financial market volatility remains low.

The stimulatory setting of monetary policy in Australia has supported the economy and helped generate a decline in unemployment. Over the period ahead, further progress on reducing spare capacity in the economy is expected, which in turn would support the forecast gradual increase in inflation. Accordingly, at its recent meetings the Reserve Bank Board has judged that holding the cash rate at its current level of 1.5 per cent would be consistent with sustainable growth in the economy and achieving the medium-term inflation target.

Insights From Dynamic Loan To Income

One of the most powerful tools to assess risk in a mortgage portfolio is dynamic loan to income ratios (LTI). Whilst Loan to Value (LVR) has traditionally been seen as a simple lead indicator of risk, in a rising priced market, risks are hidden, while in a falling market risks suddenly reappear. In any case LVR is about the equity buffer which protects the bank, not necessarily the household, and then only once default occurs.

Among advanced economies, loan to income ratios have started to take their place as the more accurate indicator of potential risk because they look at the household cash flow, and ongoing ability to service the loan. There has been reluctance in Australia to want to get to grips with LTI, but APRA’s recent comment suggests this may, and rightly change.

The point though is LTI at loan origination, just as LVR at origination, does not tell the full story. To be effective LTI should be dynamically adjusted, so as income changes, risk does too. This should then be back-ended into the banks’ risk and capital models.

The Digital Finance Analytics Core Market Model includes dynamic LTI. Currently we estimate that more than 20% of owner occupied mortgage loans on book have a dynamic LTI of more than 4 times income.

Some LTI’s are above 10 times income, though a relatively small number, they are at significantly higher risk.

Looking at the data by state, we see that by far the highest count of high LTI loans resides in NSW (mainly in Greater Sydney), then VIC and WA.

Younger households have a relatively larger distribution of higher LTI loans.

Reading across our core segmentation, we see that Young Affluent, Exclusive Professionals and Multi Cultural Establishment are the three groups more likely to have a high dynamic LTI. We also see a number of Young Growing Families in the upper bands too.

Many lenders also hold the transaction account for their mortgage borrowers, so it is perfectly feasible to build an algorithm which calculates estimated income dynamically from their transaction history, and use this to estimate a dynamic LTI. This would give greater insight into the real portfolio risks, compared with the blunt instrument of LVR. It is less misleading that LTI or LVR at origination.

Indeed, perhaps lenders should be running annual health checks on their mortgage portfolios, using LTI as the key discriminator. This is a leading indicator of down stream risks.

It also assists in assessing the true portfolio risks, because currently if households are in difficulty, it is in the banks’ interests to close out the loan quickly, to release equity to repay the loan and reduce the number of “bad loans” on book. One simple reason why losses are so low on a portfolio basis around 2 basis points, is that in a rising market, equity gains more than cover the loans. But that could change if home prices stall or reverse.

Dynamic LTI is a tool to assess risks earlier in the cycle.

600 Technology Specialists to Join NAB

As part of its recently released updated strategy, NAB will immediately hire 600 technology specialists in the areas of software engineering, data, architecture and security.

The national and global recruitment drive is part of NAB’s plan to reshape the workforce and create up to 2,000 new jobs by 2020 to meet the changing needs of customers.

Chief Technology and Operations Officer Patrick Wright said NAB is looking for the best talent in Australia and the world to come and join its technology and digital teams.

“We want the top talent in the industry to come and join us, as we change dramatically to become the very best bank we can be and give our customers the products and services they demand and deserve,” Mr Wright said.
“We know this is an ambitious target and acknowledge the war for talent is intense, but these are the essential skills and roles we need in order to deliver our plan.

“This builds on three years of innovation at NAB, including the establishment of our innovation incubator, NAB Labs, and our innovation fund, NAB Ventures, the launch of Quickbiz which provides our business customers with lending decisions in seconds, and the continued roll-out of Customer Journeys, which is dramatically changing how we deliver improved products and services to our customers.”

The move also aims to rebalance the shift from outsourced suppliers based in Australia and overseas, to bring talent back inside the bank in NAB’s Australian offices to increase competitive advantage.

“We’re looking at the skills needed inside and outside our business to make sure that we can run our systems and service our customers as best as possible,” Mr Wright said.

NAB recently announced a record $4.5 billion investment into the bank over the next three years – with much of that funding directed to technology and digital priorities.

“This significant investment will help change the way we provision technology services, which is critical to delivering more effectively to balance innovation with resilience, and speed with security.

“Our people are integral to the success of NAB, and this investment ensures they are enabled and backed to deliver their very best.

“We understand what the fintechs across the world are doing, and we think we can do better, but we need to move now, invest in the right systems and people, and change dramatically,” Mr Wright said.

To kick start the recruitment drive, NAB has announced the appointment of leading global technology talent of two new roles; Executive General Manager Business Enabling Technology, Yuri Misnik and Executive General Manager leading our Program Management Office Kyle McNamara. The roles will report to Mr Wright.

Mr Misnik will have responsibility for all NAB’s business-facing technology teams including Digital technology and Corporate functions.

Mr McNamara will be focused on NAB’s change activities across the franchise and delivery of the significant investment slate announced last week.