CPI and Uncertainly

Interesting speech from RBA’s Guy Debelle, highlighting issues around measuring an number of economic factors. He calls out CPI as one area of uncertainly, especially as the ABS does a quarterly report (unlike many other countries who publish monthly) and the changes in weightings which will impact ahead. There is a lot of noise in the data…!

For inflation – which is also published quarterly in Australia – we won’t get an official read on the current rate until the December quarter Consumer Price Index (CPI) is released in late January, three months from now. In most other countries, the CPI is published monthly, so the wait to get an assessment on current inflation is not so long elsewhere.

More timely and more frequent estimates of output and inflation are not unambiguously desirable. There is clearly a trade-off between timeliness and accuracy. But, in the case of inflation, a more frequent estimate would help to identify changes in the trend in inflation sooner; it probably comes with more noise, but we have ways to deal with that. Any reading on inflation always contains varying degrees of signal and noise about the ‘true’ inflation process. At the moment, we need to wait three more months to gain a better understanding as to whether any particular read on inflation is signalling a possible change in trend or is just noise. That is one of the reasons why the RBA has long advocated a shift to monthly calculation of the CPI.

That said, we do not depend solely on GDP and the CPI to assess the current state of the economy. We spend a lot of time and effort piecing together information from a large number of other sources. These include higher frequency and more timely data, including from the ABS, but also from a wide range of other data providers. The information we obtain from talking to people, particularly through our business liaison program, is also invaluable.

The question then arises as to how we can filter the information we receive from all these different sources to gain an overall picture about inflation and the state of the overall economy. Take GDP as an example. Some of the data released before the national accounts, such as monthly retail sales and international trade, feed directly into the calculation of GDP. So we have a direct read on those. We ‘nowcast’ other components of GDP using data that are more timely. Let me illustrate for household consumption. We get a good measurement of consumption of goods by looking at monthly retail sales and sales of motor vehicles and fuel. But there is very little timely information on household consumption of services, so the nowcast of this component relies more on statistical relationships. Some of these relationships are pretty weak, so we also supplement this with information on sales from our regular discussions with our business liaison contacts. This then gives us an estimate of consumption for the quarter. To get a preliminary nowcast for GDP growth for the quarter, we aggregate our best estimate for each of the relevant components. We then ask ourselves whether this estimate is consistent with other information that we have, such as the monthly labour market data, as well as predictions from our macro forecasting models.

The nowcast can be then updated with new information as it comes to hand. That said, my observation from a couple of decades of forecasting is that your first estimate of GDP (three months out) is often the best, and that additional information is often noise rather than signal.

Measurement uncertainty

Aside from when data are published, uncertainty about the present also arises from how things are measured. This takes two forms. First, there is the methodology used to actually measure the variable in question. Second, there are the revisions to data after they were first published.

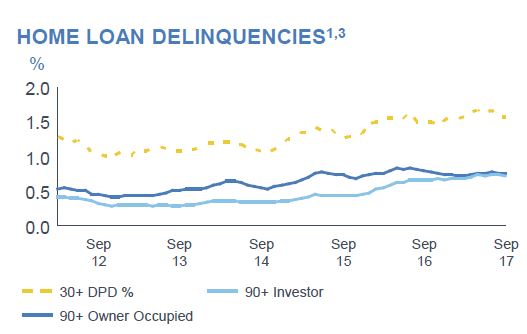
On the first, a good example is the CPI. The CPI measures prices for a large number of items purchased by households. When aggregating these to calculate the overall consumer price index, each item is assigned a weight based on its average share of household expenditure. That is, the aim is to weight each price by the amount households spend on it, on average, in the period in question.

Obviously, these weights can change through time. But the weights used in the CPI are only updated each time the ABS conducts a Household Expenditure Survey, which, in recent times, has been every five or six years.

In between each household expenditure survey, a number of things can happen. First of all, some new goods and services can come along that weren’t there before. One example you might think of is a mobile phone. Though it’s not quite that straightforward, as before mobile phones, households spent money on landline phone bills and on cameras. So often these ‘new’ goods are providing similar services to something that was there before. Nevertheless, the ABS needs to take account of these new goods coming in, as well as some old items dropping out.

Secondly, households adjust their spending in response to movements in prices and income. In practice, households tend to substitute towards items that have become relatively less expensive, and substitute away from items that have become relatively more expensive. But the expenditure weights in the CPI are only updated every five or six years. Over time, the effective expenditure weights in the CPI become less representative of actual household expenditure patterns. That is, they are putting more weight on items whose prices are rising than households are actually spending on them. This introduces a bias in the measured CPI – known as substitution bias – which only is addressed when the expenditure weights are updated. Because households tend to shift expenditure towards relatively cheaper items, infrequent updating of weights tends to overstate measured CPI inflation.

The ABS will very shortly update the expenditure weights in the CPI. Because of substitution bias, history suggests that measured CPI inflation has been overstated by an average of ¼ percentage point in the period between expenditure share updates. While we are aware of this bias, we are not able to be precise about its magnitude until the new expenditure shares are published, because past re-weightings are not necessarily a good guide. It is also not straightforward to account for this in forecasts of inflation. However, from a policy point of view, the inflation target is sufficiently flexible to accommodate the bias, given its relatively small size.

Going forward, the ABS will update the expenditure shares annually, rather than every five or six years. This will reduce substitution bias in the measured CPI.

National Accounts 2016-17 Highlights Reliance On Property

The ABS released their National Accounts for 2016-17. Overall, we see why the RBA cut rates to let property prices run hot. Without property, the economy would have been shot. But of course, getting back on a more even keel is now much more difficult and much of household wealth is attached to inflated property prices; and rates are likely to rise.

In summary:

  • growth was 2%, the lowest since 2008-9
  • wages rose 2.1%, the weakest since 1991-2
  • household consumption was the strongest growth driver at 1.22pp
  • growth in household expenditure as measured in current price terms was 3.0%, the lowest on record
  • the household saving ratio was at its lowest point (4.6%) in nine years
  • households borrowed an additional $990 billion over the 10 year period from 2006-07, mainly mortgages
  • the value of land and dwellings owned by households increased by $2,930 billion over the same period
  • land and dwellings owned by households increased by $621 billion through 2016-17
  • despite slow wage growth, household gross disposable income plus other changes in real net wealth increased $456.6 billion, or 32.6%, in 2016-17,  largely due to a $306.5 billion appreciation in the value of land held by households.

Here is the ABS summary data:

The Australian economy expanded by 2.0% in chain volume terms in 2016-17. This is the 26th consecutive year of economic growth, but the lowest rate of growth since 2008-09.

Optimal growing conditions saw the agriculture industry make a robust contribution to economic growth, largely on the back of a bumper wheat crop and higher meat sales, which returned the highest annual income to farmers on record. Mining was the beneficiary of elevated commodity prices, but the industry’s growth in volume terms was subdued. Most of the expansion in mining came from oil and gas extraction, reflecting additional capacity coming online. Service-based industries also contributed to growth, highlighting the economy’s transition to service delivery.

Household consumption expanded moderately in volume terms. Gross fixed capital formation fell for the fourth successive year, albeit only marginally, despite continuing strength in dwelling investment in 2016-17. New engineering construction continued to slide as the impact of the recent mining construction boom fades.

Weak wage growth resulted in compensation of employees rising 2.1%, the weakest annual rise since 1991-92. This, combined with a fall in social assistance benefits received by households during the year, caused the household saving ratio to fall to 4.6%, its lowest level since 2007-08.

Price pressures in the domestic economy remained weak throughout 2016-17. Subdued domestic prices and wages drove the weakest annual rise in household consumption, in current price terms, on record. The terms of trade grew for the first time in 5 years, reflecting elevated prices received for key export commodities such as coal and iron ore. These prices boosted mining company profits, real net national disposable income, and overall export revenues, which sharply narrowed the current account deficit.

The Australian economy’s overall financial position improved during 2016-17, borrowing less in net terms from the rest of the world in any year since 2001-02. In current prices Australia’s net worth at 30 June 2017 is estimated at $11,377 billion.

AUSTRALIAN ECONOMY GROWS BY 2.0%

Australian Gross Domestic Product (GDP) grew by 2.0% in the 2016-17 year. This represents a 0.1pp upward revision from the annualised 2016-17 GDP estimates published in the June quarter national accounts. GDP per capita increased 0.4% as the Australian population grew by 1.5%.

GDP and GDP per capita, Volume measures
Graph shows GDP and GDP per capita, Volume measures

CONSUMPTION DRIVES ECONOMIC GROWTH IN 2016-17

Economic growth in 2016-17 was largely driven by consumption. Government consumption contributed 0.8pp to GDP growth, while household consumption contributed 1.2pp to growth. Gross fixed capital formation made no contribution to growth, with the impact of public sector capital expansion being cancelled out by the decline in private works. Net exports contributed 0.1pp.

CONTRIBUTIONS TO GDP(E) GROWTH, Volume measures
Graph shows CONTRIBUTIONS TO GDP(E) GROWTH, Volume measures
Contributions may not add to GDP growth due to the statistical discrepancy.

HOUSEHOLD CONSUMPTION WEAK IN CURRENT PRICE TERMS

While household consumption contributed solidly to GDP growth in volume terms, growth in household expenditure as measured in current price terms of 3.0% is the lowest on record.

HOUSEHOLD FINAL CONSUMPTION EXPENDITURE, Current prices
Graph shows HOUSEHOLD FINAL CONSUMPTION EXPENDITURE, Current prices

MINING INVESTMENT CONTINUES TO FALL

In 2016-17, mining investment fell by 23.7%. This was the fourth consecutive fall in mining investment, with the level of investment now 58.1% lower than it was in 2012-13. The impact the fall in mining investment has had on GDP has been partially offset by investment in dwellings, which grew 5.2% in 2016-17.

Private sector gross fixed capital formation for non-mining industries grew 2.2% in 2016-17. Investment in non-mining is 15.1% higher than in 2012-13, with the strength being led by the information, media and telecommunications industry.

PRIVATE CAPITAL INVESTMENT, Current prices
Graph shows PRIVATE CAPITAL INVESTMENT, Current prices

SERVICES AND AGRICULTURE DRIVE GROWTH IN 2016-17 AS THE COMPOSITION OF AUSTRALIAN GROSS VALUE ADDED (GVA) CONTINUES TO SHIFT

In 2016-17, good growing conditions resulted in a large increase in the output of the Agriculture industry, contributing 0.4 percentage points to the yearly GDP growth in chain volume terms, the largest contribution from Agriculture in ten years. Health Care and Social Assistance, Professional Scientific and Technical Services and Financial and Insurance Services industry all contributed at least 0.3 percentage points to GDP growth this year.

This is consistent with the longer term trend being observed with these three industries along with Mining and Construction making up the largest share of the overall economy in 2016-17. This is in contrast to the 1996-97 year in which Manufacturing, Financial and Insurance Services and Public Administration and Safety were the top three contributors.

INDUSTRY SHARES OF GVA – Selected industries, Current prices

GVA at basic prices of industries as a proportion of total GVA at basic prices

COMPENSATION OF EMPLOYEES SHARE OF TOTAL FACTOR INCOME FALLS

In 2016-17, the compensation of employees (COE) share of total factor income fell to 52.8%. This share is still higher than the lowest level recorded, but continues the long term decline from 57.1% in 1984-85. The series has been more volatile in the past 7-8 years with swings in the terms of trade impacting overall factor income.

The profit share (based on gross operating surplus) of total factor income was 26.5% for the 2016-17 year. This increase is due to the higher profits received by the mining industry this year due to the increase in the terms of trade. The current year share is less than the peak of 28.9% in 2008-09 but still higher than the 22.0% share observed in the mid-1980s. The profit share of total factor income should not be interpreted as a direct measure of ‘profitability’ for which it is necessary to relate profits to the level of capital assets employed.

WAGES SHARE OF TOTAL FACTOR INCOME
Graph shows WAGES SHARE OF TOTAL FACTOR INCOME


PROFITS SHARE OF TOTAL FACTOR INCOME
Graph shows PROFITS SHARE OF TOTAL FACTOR INCOME

CHANGES TO INDUSTRY COMPENSATION OF EMPLOYEES OVER TIME

The industry share of COE has changed significantly over time. The Health Care and Social Assistance and Professional, Scientific and Technical Services industries had the largest proportion of total COE in 2016-17. The Manufacturing industry made up the highest share of COE in 1996-97 but this share has now fallen to 7.3%.

INDUSTRY SHARES OF COE – Selected industries, Current prices
Graph shows INDUSTRY SHARES OF COE - Selected industries, Current prices

HOUSEHOLD SAVING RATIO DECLINES

The household saving ratio was at its lowest point (4.6%) in nine years in 2016-17. This fall in net saving as a proportion of net disposable income can be attributed to slower growth in COE as well as a reduction in social assistance benefits received. The result this year is not isolated, and continues the downward trend seen in the past five years.

HOUSEHOLD SAVING RATIO
Graph shows HOUSEHOLD SAVING RATIO

GDP CHAIN PRICE INDEX GROWTH DRIVEN BY STRONG EXPORT PRICES

The GDP chain price index grew by 3.8% in 2016-17. Strength in export prices (specifically coal and metal ore) drove this result. The domestic final demand chain price index rose 0.8% in 2016-17, which is the lowest reading of domestic price pressure since 1996-97.

CHAIN PRICE INDEXES
Graph shows CHAIN PRICE INDEXES

MARKET SECTOR MULTIFACTOR PRODUCTIVITY INCREASES

Market sector multifactor productivity (MFP) grew 0.6% in 2016-17. This result reflects a 1.9% increase in GVA and a 1.3% increase in labour and capital inputs. On a quality adjusted hours worked basis, MFP rose 0.3%, reflecting changes in labour composition. These changes were due to educational attainment and work experience.

On an hours worked basis, labour productivity grew 1.0%. On a quality adjusted hours worked basis, labour productivity grew 0.5%.

MARKET SECTOR PRODUCTIVITY, Hours worked basis
Graph shows MARKET SECTOR PRODUCTIVITY, Hours worked basis

LOW INTEREST RATES ENTICE HOUSEHOLDS TO INVEST IN DWELLINGS AND LAND

Interest rates have been at historically low levels for a number of years, which has reduced the pressure on households in terms of the proportion of income spent paying interest on mortgages. Interest on dwellings accounted for 3.7% of total gross household income in 2016-17, compared to 5.3% in 2006-07.

Households borrowed an additional $990 billion over the 10 year period from 2006-07, while the value of land and dwellings owned by households increased by $2,930 billion over the same period. Land and dwellings owned by households increased by $621 billion through 2016-17, boosted by the recent additions in dwelling stock.

In 1988-89, the value of dwellings and land held by households was 5.1 times the value of household borrowing. By 2006-07 this ratio was at 3.3, and it has been reasonably stable since. In 2016-17, land and dwellings owned by households covered their borrowing 3.1 times.

HOUSEHOLD INTEREST PAYABLE ON DWELLINGS – Relative to total gross household income, Current prices
Graph shows HOUSEHOLD INTEREST PAYABLE ON DWELLINGS - Relative to total gross household income, Current prices


HOUSEHOLD LAND AND DWELLING ASSETS – Relative to loans, Current prices
Graph shows HOUSEHOLD LAND AND DWELLING ASSETS - Relative to loans, Current prices

HOUSEHOLD INCOME AND WEALTH

Despite slow wage growth, household gross disposable income plus other changes in real net wealth increased $456.6 billion, or 32.6%, in 2016-17. This was largely due to a $306.5 billion appreciation in the value of land held by households.

Living standards and economic wellbeing are supported by wealth as well as income. Gross disposable income grows at a fairly constant rate over time, but its rate of growth has slowed in recent years. However, households reap gains and incur losses from holding assets, such as land, dwellings, equities and accumulated saving, which also bears on consumption patterns.

HOUSEHOLD INCOME AND WEALTH, Current prices
Graph shows HOUSEHOLD INCOME AND WEALTH, Current prices


Teachers Mutual Bank Lops 30 Basis Points Off New Mortgages

From Australian Broker.

Teachers Mutual Bank’s Classic Home Loan variable rate has today been cut by 30 basis points to 3.84% for new business across its three key brands: Teachers Mutual Bank, UniBank, and Firefighters Mutual Bank.

Fixed rates across a number of home loan products have also been cut for all brands. Two year fixed rate home loans will drop to 3.69% p.a. (15 basis points). Four and five year fixed rates home loans will be reduced by 22 basis points to 4.36% p.a. and 4.49% p.a. respectively. These fixed rate changes will effect both new business for owner occupier on principal and interest payments. Interest only loans for owner occupied purposes will also be reduced by the equivalent to 4.38% p.a. (2 Years), 4.76% p.a. (4 years) & 4.89% p.a. (5 Years).

“We always seek to provide some of the most competitive rates on the market, and these new rates achieve that aim”, said Teachers Mutual Bank’s head of third party distribution, Mark Middleton.

“These changes provide customers an opportunity to lock in a very reasonable home loan rate with Teachers Mutual Bank, UniBank or Firefighters Mutual Bank. The incentive to join us increases once you consider these loans are supported by our 100% mortgage offset facility, our high levels of customer service, and our environmental credentials”, said Middleton.

These rate changes follow on from Teachers Mutual Bank Limited’s recently announced annual results, which highlighted the brand’s strong home loan performance, with first and third party lending growing by a total of 19.23% in 2016-2017.

“Our third party channels are a strong area for business growth for us, and our engagement with the broker community will be a continued focus as we grow our portfolio and our brands over the next year. These rate changes are a positive step in building that growth”, said Middleton.

Macquarie Group Announced 1H18 Net Profit of $A1,248 million

Macquarie Group has announced a net profit after tax of $A1,248 million for the half-year ended 30 September 2017 (1H18), up 19 per cent on the half-year ended 30 September 2016 (1H17) and up seven per cent on the half-year ended 31 March 2017 (2H17).

Once again the Group has exceeded market forecasts, thanks to strong growth in performance fees from its annuity style businesses, this despite a fall in net interest income. Impairments fell. Their outlook for FY18 is also stronger.  More of their business is offshore than in Australia, so as the economic pace picks up in USA and Europe, they should benefit.

They gave their normal comprehensive briefing:

Net operating income of $A5,397 million for 1H18 was up three per cent on 1H17, while total operating expenses of $A3,693 million were down one per cent on 1H17.

Macquarie’s annuity-style businesses (Macquarie Asset Management (MAM), Corporate and Asset Finance (CAF) and Banking and Financial Services (BFS)), which represented approximately 80 per cent of the Group’s 1H18 performance, generated a combined net profit contribution of $A2,094 million, up 28 per cent on 1H17 and up 30 per cent on 2H17.

Macquarie’s capital markets facing businesses (Commodities and Global Markets (CGM) and Macquarie Capital) delivered a combined net profit contribution of $A568 million, down 18 per cent on 1H17 and down 25 per cent on 2H17.

International income accounted for 62 per cent of the Group’s total income.

Macquarie’s assets under management (AUM) at 30 September 2017 was $A473.6 billion, down two per cent from $A481.7 billion at 31 March 2017, largely due to net asset realisations in Macquarie Infrastructure and Real Assets (MIRA)5 and unfavourable currency movements in Macquarie Investment Management (MIM), partially offset by positive market movements.

Macquarie also announced today a 1H18 interim ordinary dividend of $A2.05 per share (45 per cent franked), up on the 1H17 interim ordinary dividend of $A1.90 per share (45 per cent franked) and down from the 2H17 final ordinary dividend of $A2.80 per share (45 per cent franked). This represents a payout ratio of 56 per cent. The record date for the final ordinary dividend is 8 November 2017 and the payment date is 13 December 2017.

Key drivers of the change from 1H17 were:

  • A one per cent increase in combined net interest and trading income to $A1,892 million, up from $A1,874 million in 1H17. The movement was mainly due to volume growth in the loan and deposit portfolios and improved margins in BFS, and a reduced cost of holding long-term liquidity in Corporate. This was partially offset by reduced interest income from Macquarie Capital’s debt investment portfolio and higher funding costs associated with an increase in principal investments, including the acquisition of Green Investment Group (GIG), as well as lower trading income in CGM as a result of lower market volatility.
  • A 17 per cent increase in fee and commission income to $A2,568 million, up from $A2,203 million in 1H17, due to increased performance fee income in MAM and higher fee income from the US debt capital markets business in Macquarie Capital due to increased client activity.

  • This was partially offset by reduced Life Insurance income in BFS after Macquarie Life’s risk insurance business was sold to Zurich Australia Limited in September 2016; lower mergers and acquisitions fee income in the US and Asia in Macquarie Capital; and reduced CGM brokerage and commissions income, mainly in equities due to continued low volatility across global equity markets and reduced brokerage commission rates due to the trend towards lower margin platforms.
  • A one per cent decrease in net operating lease income to $A469 million, down from $A476 million in 1H17, due to improved underlying income in CAF from the Aviation, Energy and Technology portfolios offset by foreign exchange movements.
  • Share of net profits of associates and joint ventures accounted for using the equity method of $A103 million in 1H18 increased from a loss of $A8 million in 1H17, primarily due to the improved underlying performance of investments held in Macquarie Capital.
  • Other operating income and charges of $A365 million in 1H18, down from $A673 million in 1H17. The primary drivers were lower principal gains in Macquarie Capital and CGM and the non-recurrence of the gain on sale of Macquarie Life’s risk insurance business to Zurich Australia Limited in 1H17 by BFS, partially offset by lower charges for provisions and impairments across most operating groups.
  • Total operating expenses of $A3,693 million in 1H18 decreased one per cent from $A3,733 million in 1H17, mainly due to reduced project activity in BFS, reduced employment expenses from lower average headcount, partially offset by transaction, integration and ongoing costs associated with the acquisition of GIG in Macquarie Capital.

Impairments fell from $280m (1H17) to $142m 1H18.

Staff numbers were 13,966 at 30 September 2017, up from 13,597 at 31 March 2017.

The income tax expense for 1H18 was $A448 million, a two per cent increase from $A438 million in 1H17. The increase was mainly due to higher profit before tax. The effective tax rate of 26.4 per cent was down from 29.4 per cent in 1H17 and broadly in line with the 2H17 rate of 26.9 per cent, reflecting the geographic mix and nature of earnings.

Total customer deposits increased three per cent to $A49.4 billion at 30 September 2017 from $A47.8 billion at 31 March 2017. During 1H18, $A8.2 billion of new term funding7 was raised covering a range of tenors, currencies and product types.

Macquarie’s financial position comfortably exceeds APRA’s Basel III regulatory requirements, with Group capital surplus of $A4.2 billion at 30 September 2017. This surplus was down from $A5.5 billion at 31 March 2017, following payment of the FY17 final dividend and FY17 Macquarie Group Employee Retained Equity Plan buying requirement, the ECS buyback and business growth, partially offset by 1H18 profit and movement in reserves. The Bank Group APRA Basel III Common Equity Tier 1 capital ratio was 11.0 per cent (Harmonised: 13.3 per cent) at 30 September 2017, down from 11.1 per cent (Harmonised: 13.3 per cent) at 31 March 2017.

The Bank Group’s APRA leverage ratio was 6.1 per cent (Harmonised: 6.9 per cent), LCR was 153 per cent and NSFR was 109 per cent at 30 September 2017.

The Basel Committee has delayed the finalisation of proposals to amend the calculation of certain risk weighted assets under Basel III. Any impact on capital will depend upon the final form of the proposals and local implementation by APRA.

APRA has delayed until at least 1 January 2019 the implementation of a new standardised approach for measuring counterparty credit risk exposures on derivatives (SA-CCR) and capital requirements for bank exposures to central counterparties. APRA has also announced that it does not expect to finalise a new market risk standard until at least 2020, with implementation from 2021 at the earliest.

APRA provided guidance around CET1 capital ratios for Australian banks to be considered ‘unquestionably strong’ and intends to release further details on how the new requirements will be implemented later this year. APRA has indicated11 that the implementation of the proposal will incorporate changes to the prudential framework resulting from the finalisation of Basel III. Based on existing guidance, Macquarie’s surplus capital position remains sufficient to accommodate any additional requirements.

To provide additional flexibility to manage the Group’s capital position going forward, the Board has approved an on-market buyback of up to $A1 billion, subject to a number of factors including the Group’s surplus capital position, market conditions and opportunities to deploy capital by the businesses. This buyback has received the necessary regulatory approvals.

Operating group performance

  • Macquarie Asset Management delivered a net profit contribution of $A1,189 million for 1H18, up 39 per cent from $A857 million in 1H17. Performance fee income of $A537 million, from Macquarie European Infrastructure Fund 3 (MEIF3), Macquarie Atlas Roads (MQA) and other MIRA-managed funds and co-investors, was up from $A170 million in 1H17. Base fees of $A795 million were broadly in line with 1H17 as investments made by MIRA-managed funds, growth in the MSIS Infrastructure Debt business and positive market movements in MIM AUM were partially offset by asset realisations by MIRA-managed funds, net flow impacts in the MIM business and foreign exchange impacts. Investment-related income was broadly in line with 1H17 and included gains from sale and reclassification of certain infrastructure investments. Assets under management of $A471.9 billion decreased two per cent on 31 March 2017.
  • Corporate and Asset Finance delivered a net profit contribution of $A619 million for 1H18, up 19 per cent from $A521 million in 1H17. The increase was mainly driven by increased income from prepayments, realisations and investment-related income in the Principal Finance portfolio and lower provisions for impairment, partially offset by lower interest income as a result of the reduction in the Principal Finance portfolio. The Asset Finance portfolio continued to perform well. CAF’s asset and loan portfolio of $A35.5 billion decreased three per cent on 31 March 2017.
  • Banking and Financial Services delivered a net profit contribution of $A286 million for 1H18, up 10 per cent from $A261 million in 1H17. The improved result reflects increased income from volume growth in the loan and deposit portfolios and improved margins. 1H17 included the gain on sale of Macquarie Life’s risk insurance business net of expenses including impairment charges predominately on equity investments and intangible assets, and a change in approach to the capitalisation of software expenses in relation to the Core Banking platform. BFS deposits12 of $A46.4 billion increased four per cent on 31 March 2017 and funds on platform13 of $A78.9 billion increased nine per cent on 31 March 2017. The Australian mortgage portfolio of $A29.9 billion increased four per cent on 31 March 2017, representing approximately two per cent of the Australian mortgage market.
  • Commodities and Global Markets delivered a net profit contribution of $A378 million for 1H18, down 23 per cent from $A490 million in 1H17. The result primarily reflects reduced income from the sale of investments, mainly in energy and related sectors, and lower volatility across the commodities platform resulting in reduced client activity and trading opportunities. This was partially offset by strong client flows and revenues from interest rates and foreign exchange, improved results across the equities platform, and lower operating expenses reflecting reduced commodity-related trading activity, reduced average headcount and associated activity, and realisation of benefits from cost synergies following the merger of Commodities and Financial Markets and Macquarie Securities Group. Macquarie Energy improved its Platts ranking to become the No. 2 US physical gas marketer in North America.
  • Macquarie Capital delivered a net profit contribution of $A190 million for 1H18, down seven per cent from $A205 million in 1H17. The result reflects reduced investment-related income and lower M&A fee income in the US and Asia, partially offset by higher fee income from debt capital markets in the US and lower provisions and impairment charges. During 1H18, Macquarie Capital advised on 152 transactions valued at $A73 billion including being defence adviser to DUET Group in response to the $A13.4 billion acquisition by Cheung Kong Infrastructure; acquisition of 100 per cent ownership interest in RES Japan, a Japanese subsidiary of Renewable Energy Systems Group, rebranded as Acacia Renewables and focused on developing a pipeline of onshore wind energy projects; and financial advisor and equity investor in the restructuring and acquisition of the 907MW Norte III combined cycle gas plant in Juarez, Mexico. During 1H18, Macquarie completed the acquisition of the UK Green Investment Bank plc from HM Government for £2.3 billion. The Green Investment Bank, rebranded as Green Investment Group, is one of Europe’s largest teams of green energy investment specialists, with expertise in project finance and development, construction, investment and asset management of green energy infrastructure.

Macquarie advised today that ex. RBA Chief Glenn Stevens will be appointed to the Macquarie Group Limited and Macquarie Bank Limited Boards as an independent director, effective 1 November 2017.

Higher Bond Yields Could Depress Share Prices

From Moody’s

Any analysis regarding the appropriate valuation of a long-lived asset must account for the influence of interest rates. All else the same, a rise by the interest rates of lower-risk debt obligations, namely US Treasury debt, will reduce the prices of other financial and real assets. Whenever asset prices defy higher interest rates and rise, a worrisome overvaluation of asset prices may be unfolding. Today’s high price-to-earnings multiples of equities and narrow yield spreads of corporate bonds have increased the vulnerability of financial asset prices to a widely anticipated climb by short- and long-term Treasury yields.

As of 2017’s third quarter, the market value of US common stock was 15.4 times as great as the prospective moving yearlong average of US after tax profits. Third-quarter 2017’s ratio of common equity’s market value to yearlong after-tax profits was the highest since the 16.2:1 of second-quarter 2002. More importantly, the ratio last rose up to 15.4:1 in first-quarter 1998 and would ultimately peak at the 26.0:1 of third-quarter 2000. Stocks may be richly priced relative to after-tax profits, but that does not preclude a further overvaluation of equities vis-a-vis corporate earnings. (Note that the measure of after-tax profits employed in this discussion is from the National Income Product Accounts, excludes changes in the value of inventories and some extraordinary gains and losses, and uses economic depreciation instead of accounting depreciation.)

Today’s equity market differs from that of 1998-2000 for reasons extending beyond 1998-2000’s average aggregate price-to-earnings ratio (P:E) of 21.2:1, which was so much greater than the recent 15.4:1.

In addition, 1998-2000’s equity market seems even more overpriced compared to the current market because the recent 2.43% 10-year Treasury yield was so much lower than its 5.64% average of 1998-2000.

The valuation of equities very much depends on interest rates. Holding everything else constant, priceto-earnings multiples will climb higher as benchmark interest rates decline. If benchmark interest rates fall, the market will be willing to accept a lower earnings yield, or a lower ratio of earnings to the market value of common stock. At some level of corporate earnings, the attainment of a lower earnings yield will be achieved through an increase in share prices. To the contrary, a rise by interest rates will push the earnings yield higher. Barring a sufficient climb by after-tax profits, a higher earnings yield will require lower share prices.

Investor Loan Risk Is Accelerating

Traditionally in the Australian context loans to property investors have tended to perform better than loans to owner occupiers. This is because investors receive rental income streams to help pay for the mortgage costs, they are willing to carry the costs of the property against future capital gains, and many will be able to offset costs against tax, especially when negatively geared. In addition, occupancy rates in most states have been stellar.

But things are changing, as the costs of borrowing for investment purposes have risen (thanks to the banks’ out of cycle rises), while rental returns are flat, or falling and costs of managing the property are rising. The supply of investment property is rising, and occupancy rates are declining in a number of key markets.

So today, we look at the latest gross and net rental yields by using our Core Market Model.

First, we look at yields by type of property. Gross yield is the rental streams received compared with the value of the property; before costs. Net yield is calculated by subtracting the costs of the property, including interest costs on mortgages, management costs and other ongoing maintenance costs. We calculate the net yield before any tax offsets.

Across the nation, units overall are providing a slightly better net return than houses.

By state, VIC has the average worse net rental yield, followed by NSW, while TAS, NT and ACT have the highest net returns.

If we drill down into the regions in the states, we see some significant variations.

If we apply our core market segmentation, we find that more affluent households are getting better returns on average compared with the battlers and younger buyers. Perhaps experience counts.

We also see that Portfolio Investors, those with multiple properties, are on average getting better returns, whilst first time buyers are the least likely to get a positive net return. Again, experience seems to count.

Finally, in the ANZ data today, released as part of their results pack was this slide. It shows a trend which we have been observing too, that is delinquencies are rising faster among property investors (to the point where the same ratio ~0.7% applies to both investors and owner occupiers).

More, concerning, our forward modelling suggests that investors are likely to become a significant higher risk as rates rise, rental returns stall, and occupancy rates fall.  Just one more reason why we think the property investment party may be over.

Higher risks need to be factored into the banks’ modelling, especially as home price momentum is ebbing, so the value of these investment properties may start to fall.

Japanese Banks’ Voluntary Curb on Credit Card Loans

From Moody’s

Last Friday, the Nikkei reported that Bank of Tokyo-Mitsubishi UFJ, Ltd. (BTMU, Sumitomo Mitsui Banking Corporation, and Mizuho Bank, Ltd. (MHBK, the main banking units of Japan’s three megabank groups, Mitsubishi UFJ Financial Group, Inc., Sumitomo Mitsui Financial Group, Inc., and Mizuho Financial Group, Inc., introduced voluntary limits on consumer credit card loans at half or one-third of a borrower’s annual income. The banks’ self-imposed limits are credit negative because they will likely hamper growth in credit card lending, one of few highly profitable domestic businesses for the banking sector.

The restriction responds to growing criticism from lawyers and politicians that excessive credit card lending could lead to a repeat of Asia’s 1997 debt crisis. In Japan, banks’ unsecured lending, including card lending, is not subject to the country’s money lending business law, which was revised in 2010 to restrict consumer finance companies’ unsecured lending to one-third of each customer’s annual income.

Some regional banks in Japan, such as the unrated Akita Bank, Ltd., the 77 Bank, Ltd., and Hyakugo Bank, Ltd., have implemented similar limits on credit card loans, and more banks will likely follow to fend off public criticism. Last Thursday, Nobuyuki Hirano, chairman of the Japanese Bankers Association and president of BTMU’s parent group, MUFG, said at a press conference that while he does not see a need to legally limit banks’ credit card lending, each bank should try to prevent consumer clients from taking on excessive debt.

Banks have benefitted from the 2010 revision to the money lending business law, which led to the rapid growth in banks’ card loans and a sharp decrease in consumer finance companies’ unsecured loans. High margins make card lending an attractive revenue source for Japanese banks and especially domestically focused regional banks as low interest rates and weak credit demand weigh on their profitability. Interest rates on banks’ card loans are 2%-15%, significantly higher than an average loan yield of 1.1% for all Japanese banks in fiscal 2016, which ended in March 2017.

Credit card lending is riskier than secured lending, but because the size of each credit card loan is small, risks from the business are easily  manageable for banks. Also, default rates for banks’ credit card loans have been low.

ACCC and Fee Free ATM Services in Very Remote Areas

The ACCC has issued a draft determination proposing to grant re-authorisation to parties to provide fee free ATM services in very remote Indigenous communities for 10 years.

Under the arrangement, participating banks and ATM deployers provide fee-free ATM withdrawals and balance enquiries at up to 85 selected ATMs for customers of those banks. The ACCC previously authorised the arrangement in 2012 for five years, which expires in December.

“The arrangement co-ordinated by the Australian Bankers’ Association has resulted in significant public benefits over the past five years, which are likely to continue for the next ten years,” ACCC Commissioner Roger Featherston said.

People living in very remote Indigenous communities can often pay high levels of total ATM fees, due to frequent ATM usage and a lack of access to alternatives.

“High ATM usage and fees intensifies the financial and social disadvantage found in very remote communities. Enabling Indigenous people in these communities to have the same access to fee-free ATMs that other Australians enjoy in less remote parts of the country lessens this disadvantage,” Mr Featherston said.

The proposed conduct allows for additional banks and ATM deployers to be added to the arrangement.

The communities to benefit from this project are located across the Northern Territory, Queensland, South Australia and Western Australia. The full lists of ATM locations and participating banks are attached to the draft determination, available on the public register.

The ACCC is now seeking submissions on the draft determination by 16 November 2017 and expects to release its final determination in December 2017.

ANZ FY17 Results – Look Under The Hood!

ANZ today announced a Statutory Profit after tax for the Full Year ended 30 September 2017 of $6.41 billion up 12% and a Cash Profit of $6.94 billion up 18% on the prior comparable period. Half the uplift was related to one-off items. More of the business going forwards will be based on its Australian and New Zealand Retail businesses (a.k.a. mortgage lending!).

ANZ’s Common Equity Tier 1 Capital Ratio was 10.6% up 96 basis points (bps).

Return on Equity increased 159 bps to 11.9% with Cash Earnings per Share up 17% to 237.1 cents.

The Final Dividend is 80 cents per share, fully franked, reflecting a payout ratio of 68% of Cash Profit, moving closer to ANZ’s target fully franked full year payout ratio of 60‐65%.

At one level this is a strong result, as the contribution from asset sales flows into the business, such that Australia and New Zealand which now accounts for 53% of capital, up from 44% two years ago. As a result, they generated strong organic capital growth and the APRA CET1 capital ratio now stands at 10.6%, up from 9.6%, so they already meet APRA’s ‘unquestionably strong’ 2020 capital target. Organic capital generation of 229 bps over the year was over 50% greater than the average (140 bps)
of the past five years.

The Group has a strong funding and liquidity position with the Liquidity Coverage Ratio at 135% and Net Stable Funding Ratio at 114%.

The total provision charge of $1.2 billion equates to a loss rate of 21 bps, a decline of 13 bps over the year. Gross impaired assets over the same period decreased 25% to $2.38 billion with new impaired assets down 11%.

But at another level, the net interest margin is down 8 basis points on last year to 1.99%, with a fall of 2 basis points in 2H, despite the mortgage book repricing and loan switching. The Australian margin fell from 275 basis points in FY16 to 268 basis points in FY17.  There was a 4 basis point impact in 2H17 as a result of the bank levy.

Credit impairments as a percentage of average GLAs down from 0.34% to 0.21% as they de-risk the business (institutional and Asia), but grow the Retail business in Australia and New Zealand, with an emphasis on  owner occupied home lending.

Full time staff fell from 46,554 to 44,896, so the cost base has reduced and is down year on year in absolute terms for the first time in 18 years. Costs rose in Australia by 2.7%.

Australian individual provisions remained at 0.33% of Gross Lending Assets, higher than the 0.22% in New Zealand but significantly lower than Asia retail.

This also exposes them to the risks of a property downturn and higher mortgage defaults. 90-Day defaults overall remained similar to last year, but with a spike in WA and a fall in VIC/TAS. (Excludes non-performing loans).

The Australian home loan portfolio grew by 7% to $265 billion. Investor loans were 32% of flow. 56% of loan flows were originated via brokers, and 51% of the portfolio were broker sourced, up from 49% in FY16. There was a rise in fixed rate lending. The portfolio is now 45% of total group lending and 64% of the Australian lending. 31% of the portfolio are interest only loans, and 27% of flow in September half to date. They say they will meet the APRA target. There was a small rise in loans with an LVR of higher than 95% in the Sept 17 period.

Investment loan delinquencies are rising, whereas they have traditionally be lower than OO loans.

They have tightened underwriting standards, including:

  • The maximum interest only period reduced from 10 years to 5 years for investment lending to align to owner occupier lending
  • Reduced LVR cap of 80% for Interest Only lending
  • Interest only lending no longer available on new Simplicity PLUS loans (owner occupier and investment lending)
  • Minimum default housing expense (rent/board) applied to all borrowers not living in their own home and seeking Residential Investment Loans or Equity Management Accounts.
  • Restrict Owner Occupier and Investment Lending (New Security to ANZ) to Maximum 80% LVR for all apartments within 7 inner city Brisbane postcodes.
  • Restrict Investment Lending (New Security to ANZ) to Maximum 80% LVR for all apartments within 4 inner city Perth postcodes

ANZ’s captive Lenders Mortgage Insurer reported stable loss ratios of 2.4 basis points.

They warn “household debt and savings have both increased, however the ability for households to withstand economic shocks has diminished a little”. “In 2018 we expect the revenue growth environment for banking will continue to be constrained as a result of intense competition and the effect of regulation including a full year of impact of the Australian bank tax.”

Becoming more urban

From The Conversation.

Australia is increasingly linked to a fast-growing global population. The populations of Sydney and Melbourne are both expected to exceed 8.5 million by 2061. What will Australia’s cities look like then? Will they still be among the world’s lowest-density cities?

Such sprawling cities result in economic (productivity), social (spatial disadvantage) and environmental weaknesses (including a very big ecological footprint). Can our cities transform themselves to become more competitive, sustainable, liveable, resilient and inclusive?

Australian governments at all levels aspire to these goals, but they require multiple transitions. The prospects of success depend on the transformative capacity of four groups of stakeholders: state government, local government, the property development industry, and community residents.

Our newly published research has found such capacity is lacking, so transformation on the scale required remains a major challenge. Our research included a survey in Sydney and Melbourne of suburban residents’ attitudes to medium-density living and neighbourhood change – essentially “sounding out” community capacity for change. This article explores some of the findings.

So why do community attitudes in the suburbs matter? The key change involves the form and fabric of Australian cities: from a low-density suburban city to a more compact form characteristic of Europe. This requires regenerative redevelopment: redirecting population and property investment inwards to brownfields and greyfields redevelopment, rather than outwards to greenfields development, and increasing the supply of medium-density housing – the “missing middle”.

Unlike greenfields and brownfields, however, greyfields are occupied. More intensive urban infill represents a challenge to residents of established suburbs to share their higher-amenity, low-density space. And elected local councillors tend to align with their residents’ resistance to “overdevelopment” and changes in “neighbourhood character”.

Are attitudes changing?

In September 2016, the Centre for Urban Transitions surveyed 2,000 Sydney and Melbourne households in established middle-ring suburbs.

Asked “What type of dwelling would you want to live in?”, nearly 60% of residents in both cities favoured a detached house and yard. This is down from 90% in the early 1990s. So, in the space of one generation, attitudes have shifted significantly toward embracing higher-density living.

However, living arrangements extend beyond the dwelling. They include the neighbourhood and wider suburban context. Our survey explored three distinctive living environments:

  1. a separate dwelling with a garden in a suburb with poor public transport
  2. a medium-density dwelling with no garden but close to public transport
  3. a high-rise apartment in the CBD or surrounding areas.

Responses revealed that when location was combined with housing type, this significantly increased preference for medium-density housing when located in established suburbs with good public transport and access to jobs and services. In both Sydney and Melbourne, 46% favoured this. That was the same proportion as preferred a separate dwelling and garden in a car-dependent suburb. Just 8% opted for apartments.

The question is whether these shifts in preference are reflected in residents’ attitudes to higher-density housing in their own neighbourhoods.

The survey found 71% of respondents were “aware of neighbourhood change in their locality”. This figure was identical for renters and property owners.

Fewer than 10% of residents in both cities think such change is a good thing, but almost 40% understand it has to happen. Just over 10% are neutral. Preference for less or no change sits around 45%.

This suggests capacity to accept change is growing, but it is grudging and not strongly endorsed.

The survey’s final stage probed the extent to which property owners contemplating a move were aware of, or open to, options of selling as a consortium of neighbours. While not common, examples are being reported with value uplifts resulting from lot consolidation ranging from 10% to 100%.

One-quarter of Sydney respondents were open to consolidating property for sale with neighbours. This number was even higher (39%) for investment properties.

What needs to be done?

Consolidated lot sales are not part of the business model of most real estate agencies, local government, or property developers.

It’s an area where the property development industry lacks capacity and is still failing to respond to the medium-density urban infill challenge. And state governments are reluctant to extend mid-rise medium-density zones in the big cities beyond designated activity centres and transport corridors.

Supply of well-designed medium-density housing needs to be greatly increased in the well-located, established, low-density, middle-ring suburbs. And it needs to happen at a precinct scale of redevelopment beyond that of knock-down-rebuild. This would enable more innovative, sustainable and aesthetically attractive development.

Infill targets for new housing in Australia’s largest cities range from 65% (Brisbane) to 85% (Adelaide), with Melbourne and Sydney in between. But these targets are not being achieved (not even Perth’s 47%). Greenfield development is still the main demographic absorber.

The Victorian government’s latest metro strategy introduced a new policy direction to “provide support and guidance for greyfield areas to deliver more housing choice and diversity”. That doesn’t alter many residents of these areas remaining resistant to change.

State and local governments need to introduce new statutory planning instruments and guidelines to enable greyfield precinct redevelopment. These are the focus of research in three Commonwealth Co-operative Research Centres (see here, here and here).

In an urban planning system that remains strongly top-down, local government serves as the main interface with local communities and property developers due to its role in planning approvals. Often this is reflected in local government’s gaming of the state government’s residential zoning schemes to ensure housing is “locked up” in minimal change zones. This effectively indicates that more intensive infill housing should happen “somewhere else” (the NIMBY syndrome).

David Chandler, a leading figure in Australia’s building and construction industry, sums up the challenges:

The capabilities needed to design and build small-scaled medium-density housing projects of three to ten dwellings up to three storeys atop below-grade parking have yet to be developed. If medium-density dwellings of the type described here are to make up a third of the housing landscape, a new marketing platform and delivery model will be required.

If governments are seriously minded to harvest the potential of greyfield sites and the urban middle, they will not only need to bring the community along in support of these more modest densification initiatives, they will need to be proactive in making sure the housing industry has the capabilities to deliver them.

Author: Peter Newton, Research Professor in Sustainable Urbanism, Swinburne University of Technology