Such sprawling cities result in economic (productivity), social (spatial disadvantage) and environmental weaknesses (including a very big ecological footprint). Can our cities transform themselves to become more competitive, sustainable, liveable, resilient and inclusive?
Australian governments at all levels aspire to these goals, but they require multiple transitions. The prospects of success depend on the transformative capacity of four groups of stakeholders: state government, local government, the property development industry, and community residents.
Our newly published research has found such capacity is lacking, so transformation on the scale required remains a major challenge. Our research included a survey in Sydney and Melbourne of suburban residents’ attitudes to medium-density living and neighbourhood change – essentially “sounding out” community capacity for change. This article explores some of the findings.
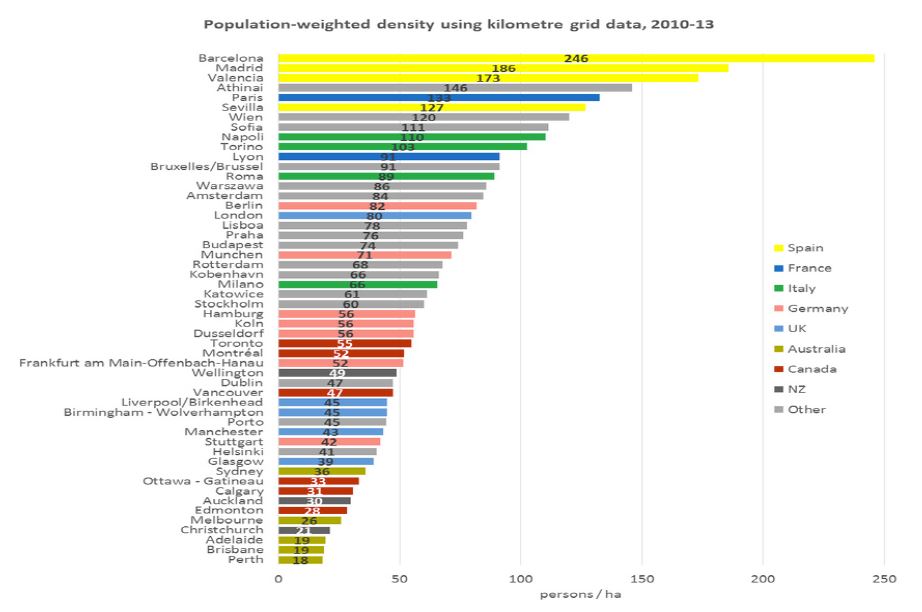
So why do community attitudes in the suburbs matter? The key change involves the form and fabric of Australian cities: from a low-density suburban city to a more compact form characteristic of Europe. This requires regenerative redevelopment: redirecting population and property investment inwards to brownfields and greyfields redevelopment, rather than outwards to greenfields development, and increasing the supply of medium-density housing – the “missing middle”.
Unlike greenfields and brownfields, however, greyfields are occupied. More intensive urban infill represents a challenge to residents of established suburbs to share their higher-amenity, low-density space. And elected local councillors tend to align with their residents’ resistance to “overdevelopment” and changes in “neighbourhood character”.
Are attitudes changing?
In September 2016, the Centre for Urban Transitions surveyed 2,000 Sydney and Melbourne households in established middle-ring suburbs.
Asked “What type of dwelling would you want to live in?”, nearly 60% of residents in both cities favoured a detached house and yard. This is down from 90% in the early 1990s. So, in the space of one generation, attitudes have shifted significantly toward embracing higher-density living.
However, living arrangements extend beyond the dwelling. They include the neighbourhood and wider suburban context. Our survey explored three distinctive living environments:
- a separate dwelling with a garden in a suburb with poor public transport
- a medium-density dwelling with no garden but close to public transport
- a high-rise apartment in the CBD or surrounding areas.
Responses revealed that when location was combined with housing type, this significantly increased preference for medium-density housing when located in established suburbs with good public transport and access to jobs and services. In both Sydney and Melbourne, 46% favoured this. That was the same proportion as preferred a separate dwelling and garden in a car-dependent suburb. Just 8% opted for apartments.
The question is whether these shifts in preference are reflected in residents’ attitudes to higher-density housing in their own neighbourhoods.
The survey found 71% of respondents were “aware of neighbourhood change in their locality”. This figure was identical for renters and property owners.
Fewer than 10% of residents in both cities think such change is a good thing, but almost 40% understand it has to happen. Just over 10% are neutral. Preference for less or no change sits around 45%.
This suggests capacity to accept change is growing, but it is grudging and not strongly endorsed.
The survey’s final stage probed the extent to which property owners contemplating a move were aware of, or open to, options of selling as a consortium of neighbours. While not common, examples are being reported with value uplifts resulting from lot consolidation ranging from 10% to 100%.
One-quarter of Sydney respondents were open to consolidating property for sale with neighbours. This number was even higher (39%) for investment properties.
What needs to be done?
Consolidated lot sales are not part of the business model of most real estate agencies, local government, or property developers.
It’s an area where the property development industry lacks capacity and is still failing to respond to the medium-density urban infill challenge. And state governments are reluctant to extend mid-rise medium-density zones in the big cities beyond designated activity centres and transport corridors.
Supply of well-designed medium-density housing needs to be greatly increased in the well-located, established, low-density, middle-ring suburbs. And it needs to happen at a precinct scale of redevelopment beyond that of knock-down-rebuild. This would enable more innovative, sustainable and aesthetically attractive development.
Infill targets for new housing in Australia’s largest cities range from 65% (Brisbane) to 85% (Adelaide), with Melbourne and Sydney in between. But these targets are not being achieved (not even Perth’s 47%). Greenfield development is still the main demographic absorber.
The Victorian government’s latest metro strategy introduced a new policy direction to “provide support and guidance for greyfield areas to deliver more housing choice and diversity”. That doesn’t alter many residents of these areas remaining resistant to change.
State and local governments need to introduce new statutory planning instruments and guidelines to enable greyfield precinct redevelopment. These are the focus of research in three Commonwealth Co-operative Research Centres (see here, here and here).
In an urban planning system that remains strongly top-down, local government serves as the main interface with local communities and property developers due to its role in planning approvals. Often this is reflected in local government’s gaming of the state government’s residential zoning schemes to ensure housing is “locked up” in minimal change zones. This effectively indicates that more intensive infill housing should happen “somewhere else” (the NIMBY syndrome).
Author: Peter Newton, Research Professor in Sustainable Urbanism, Swinburne University of Technology

 By state, VIC has the average worse net rental yield, followed by NSW, while TAS, NT and ACT have the highest net returns.
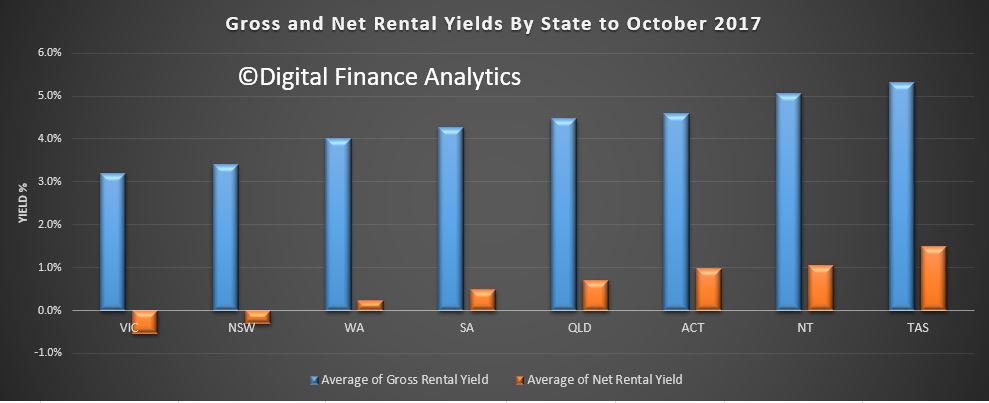 If we drill down into the regions in the states, we see some significant variations.
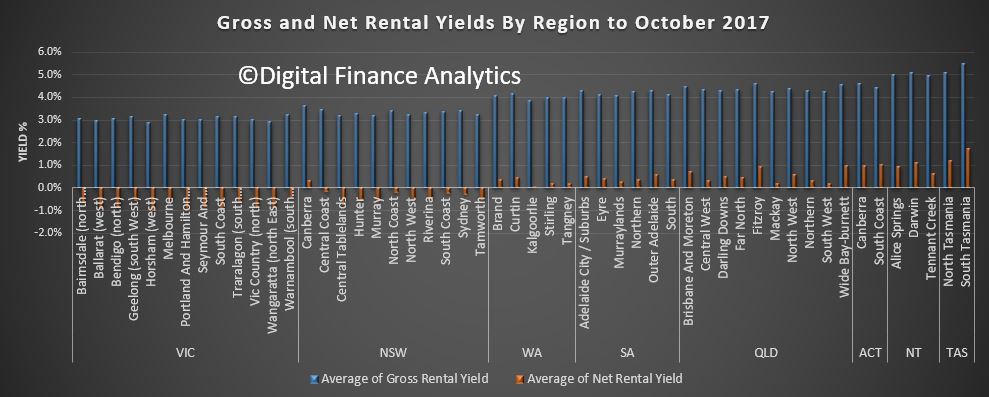 If we apply our core market segmentation, we find that more affluent households are getting better returns on average compared with the battlers and younger buyers. Perhaps experience counts.
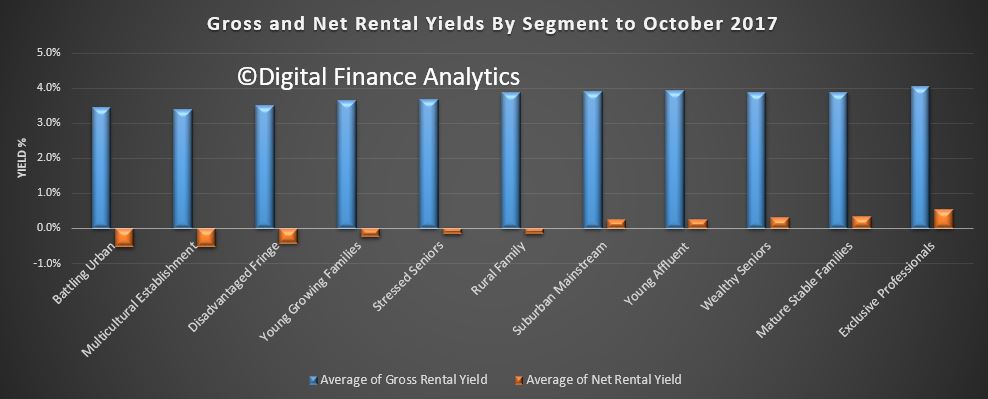 We also see that Portfolio Investors, those with multiple properties, are on average getting better returns, whilst first time buyers are the least likely to get a positive net return. Again, experience seems to count.
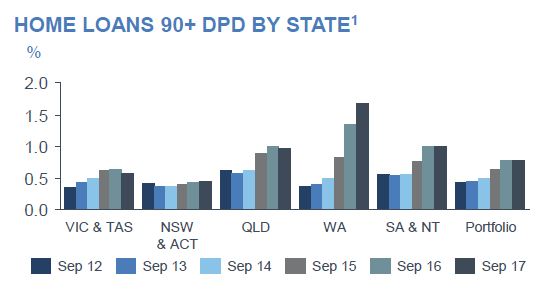
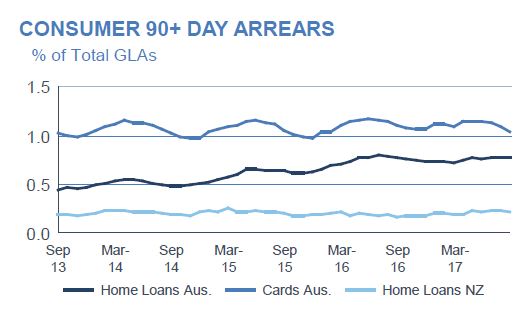
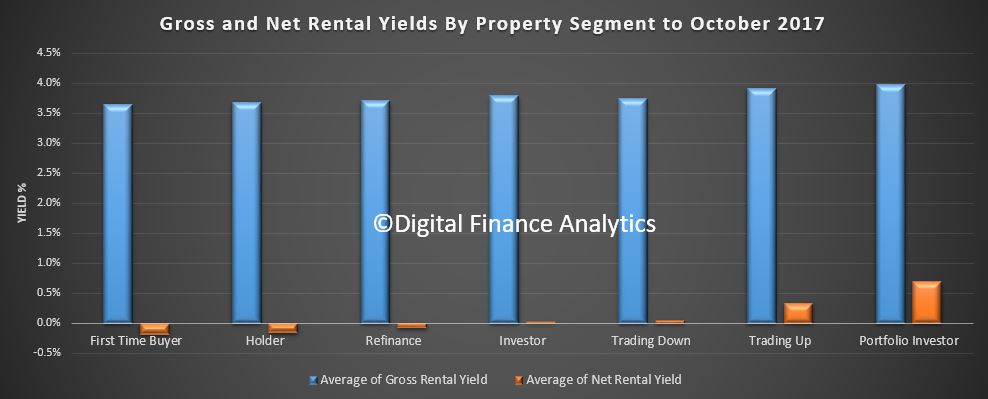 Finally, in the ANZ data today, released as part of their results pack was this slide. It shows a trend which we have been observing too, that is delinquencies are rising faster among property investors (to the point where the same ratio ~0.7% applies to both investors and owner occupiers).
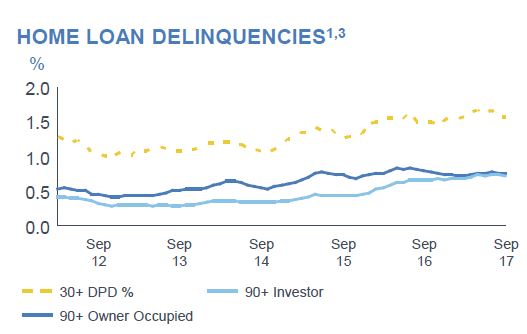 More, concerning, our forward modelling suggests that investors are likely to become a significant higher risk as rates rise, rental returns stall, and occupancy rates fall. Just one more reason why we think the property investment party may be over.