Prospa first Australian fintech to deliver a half billion dollars of small business loans

Prospa, Australia’s number one online lender for small business, has announced the delivery of more than half a billion dollars into the economy, providing loans to over 12,000 small businesses across the country.

Now in its sixth year, Prospa has scaled rapidly, today placing second in the AFR Fast 100 for 2017 thanks a 239 per cent average revenue growth since 2013-14. The AFR’s Fast 100 ranks the fastest growing companies in Australia, and in previous years has included the likes of Atlassian, Lonely Planet, SEEK and WebJet.

2017 has been been a bumper year for Prospa, having secured over $50m in equity and debt funding. The firm announced a $25m equity round led by AirTree and Square Peg in February (the largest deal of its kind in Australia at the time), which was followed by an additional $20m debt funding line from Silicon Valley-based Partners For Growth in July.

Over the past twelve months, the company has doubled the size of its loan book, and also grown its team by more than 50 per cent to 150 people from 33 countries. Recent key hires include Damon Pezaro ex Domain as Prospa’s first Chief Product Officer, and Rebecca James ex ME Bank, as Chief Marketing and Enterprise Officer.

Prospa also became the first fintech to win a Telstra Business Award, being named a New South Wales state winner in 2017, as well as being named Employer of Choice in the AON Hewitt Best Employers Program 2017.

Greg Moshal, co-founder and joint CEO of Prospa, comments, “For over five years, we’ve been transforming the way small business owners experience finance. Before Prospa, small business owners simply couldn’t access finance unless they had an asset to put up as security, and they certainly couldn’t do it in a fast easy way from the convenience of their own workplace. We’ve now provided over half a billion dollars in loans to small businesses, and there’s obviously a real need there. We’re now focusing on finding more ways to provide quick, easy access to capital: how, where and whenever it suits our customers.”

Beau Bertoli, co-founder and joint CEO of Prospa adds, “As we scale up, we’re taking a long term view on our growth plans. Awareness of fintech is at all time high, and the sector is at a tipping point in Australia. Regulatory uncertainty is being addressed through consultation and fast decision-making by Treasury, and we’re confident this will help kickstart the next wave of innovation and growth. We’re genuinely excited about the future.”

As a long term Prospa investor and Board member, Avi Eyal, Partner at UK-based Entrée Capital commented, “Prospa has had exceptional growth over the past four years, led by two of the best CEOs in tech today, Greg Moshal and Beau Bertoli. The team is world class and together they are the clear leaders in the Australian fintech market. We are proud to have Prospa in our portfolio.”

Danielle Szetho, CEO of FinTech Australia, commented: “We congratulate Prospa on this important achievement. Prospa’s incredible growth is a great reflection of our recent results from the EY FinTech Australia Census, which shows that fintech companies have tripled their median revenue since 2016, and that the industry overall is rapidly maturing.

This strong revenue growth is happening because fintech companies such as Prospa are providing new and innovative services that delight their customers, compared to the previous offerings from traditional financial services institutions.”

The world is in economic, political and environmental gridlock – here’s why

From The Conversation.

The crisis of contemporary democracy has become a major subject of political science in recent years. Despite this, the symptoms of this crisis – the vote for Brexit and Trump, among others – were not foreseen. Nor were the underlying causes of this new constellation of politics.

Focusing on the internal development of national polities alone, as has typically been the trend in academia, does not help us unlock the deep drivers of change. It is only at the intersection of the national and international, of the nation-state and the global, that the real reasons can be found for the retreat to nationalism and authoritarianism.

In 2013, we argued that the concept of “gridlock” is the key to understanding why we are at a crossroads in global politics. Gridlock, we contended, threatens the hold and reach of the post-World War II settlement and, alongside it, the principles of the democratic project and global cooperation. Four years on, we have published a new book exploring how we might tackle this situation.

But before we look into this, what exactly is gridlock?

Gridlock

The post-war institutions, put in place to create a peaceful and prosperous world order, established conditions under which a plethora of other social and economic processes associated with globalisation could thrive. This allowed interdependence to deepen as new countries joined the global economy, companies expanded multinationally, and once distant people and places found themselves increasingly — and, on average, beneficially — intertwined.

But the virtuous circle between deepening interdependence and expanding global governance could not last: it set in motion trends that ultimately undermined its effectiveness.

In the first instance, reaching agreement in international negotiations is made more complicated by the rise of new powers like India, China and Brazil, because a more diverse array of interests have to be hammered into agreement for any global deal to be made. On the one hand, multipolarity is a positive sign of development; on the other, it brings both more voices and interests to the table. These are hard to weave into coherent outcomes.

The General Debate of the 71st Session of the General Assembly of the United Nations. Golden Brown / Shutterstock.com

Next, the problems we are facing on a global scale have grown more complex, penetrating deep into domestic policies. Issues like climate change or the cross-border control of personal data deeply affect our daily lives. They are often extremely difficult to resolve. Multipolarity coincides with complexity, making negotiations tougher and harder.

In addition, the core multilateral institutions created 70 years ago, the UN Security Council for example, have proven resistant to adapting to the times. Established interests cling to outmoded decision-making rules that fail to reflect current conditions.

Finally, in many areas, transnational institutions, such as the Global Fund to Fight AIDS, Tuberculosis and Malaria, have proliferated with overlapping and contradictory mandates. This has created a confusing fragmentation of authority.

To manage the global economy, prevent runaway environmental destruction, reign in nuclear proliferation, or confront other global challenges, we must cooperate. But many of our tools for global policy making are breaking down or inadequate – chiefly, state-to-state negotiations over treaties and international institutions – at a time when our fates are acutely interwoven.

Crisis of democracy

Compounding these problems, gridlock today has set in motion a self-reinforcing element, which contributes to the crisis of democracy.

We face a multilateral, gridlocked system, as previously noted, that is less and less able to manage global challenges, even as growing interdependence increases our need for such management.

This has led to real and, in many cases, serious harm to major sectors of the global population, often creating complex and disruptive knock-on effects. Perhaps the most spectacular recent example was the 2008–9 global financial crisis, which wrought havoc on the world economy in general, and on many countries in particular.

These developments have been a major impetus to significant political destabilisation. Rising economic inequality, a long-term trend in many economies, has been made more salient by the financial crisis. A stark political cleavage between those who have benefited from the globalisation, digitisation, and automation of the economy, and those who feel left behind, including many working-class voters in industrialised countries, has been reinforced. This division is particularly acute in spatial terms: in the schism between global cities and their hinterlands.

The financial crisis is only one area where gridlock has undercut the management of global challenges. For example, the failure to manage terrorism, and to bring to an end the wars in the Middle East more generally, have also had a particularly destructive impact on the global governance of migration. With millions of refugees fleeing their homelands, many recipient countries have experienced a potent political backlash from right-wing national groups and disgruntled populations.

This further reduces the ability of countries to generate effective solutions to problems at the regional and global level. The resulting erosion of global cooperation is the fourth and final element of self-reinforcing gridlock, starting the whole cycle anew.

The vicious gridlock cycle. The Conversation

Beyond Gridlock

Modern democracy was supported by the post-World War II institutional breakthroughs that provided the momentum for decades of sustained economic growth and geopolitical stability, even though there were, of course, proxy wars fought out in the Global South. But what worked then does not work now. Gridlock freezes problem-solving capacity in global politics. This has engendered a crisis of democracy, as the politics of compromise and accommodation gives way to populism and authoritarianism.

While this remains a trend which is not yet set in stone, it is a dangerous development.

In our new book, Beyond Gridlock, we explore these dynamics at much greater length as well as how we might begin to move through and beyond gridlock. While there are no easy solutions, this does not mean there are no ways forward. There are some systematic means to avoid or resist these forces and turn them into collective solutions.

Different actors and agencies are devising new ways to solve global challenges, be it philanthropies teaming up with governments to tackle disease, cities teaming up across borders to fight climate change, or local communities taking in migrants. Ambitious agreements like the Paris Agreement or the UN Sustainable Development Goals point toward common projects. And in some countries, politicians are even winning elections by promising greater cooperation on shared challenges.

If we succeed in building a better global governance in the future, we will sap a key impetus behind the new nationalism. If we fail, we fuel the nationalist fire.

Authors: David Held, Professor of Politics and International Relations, Durham University; Thomas Hale, Associate Professor in Public Policy, University of Oxford

Housing Lending – Down the Gurgler?

The latest housing finance data from the ABS confirms what we already knew, lending momentum is on the slide, and first time buyers, after last months peak appear to have cooled. With investors already twitchy, and foreign investors on the slide, the level of buyer support looks anemic. Expect lots of “special” refinance rates from lenders as they attempt to sustain the last gasp of life in the market.

Here is the count of new FTB loans by selected states. Clearly those new incentives (some would say bribes) did not hold up for long, as underwriting standards have tightened partially offsetting the potential benefits. .  Of course these are original numbers, so they are not corrected for seasonal variations, but the direction seems clear across multiple states, even Victoria, which has been driving the demand recently.

So, no surprise that we see the number of new loans to first time buyers down 6.3%, or 630 on last month. The number of non-first home buyer commitments decreased 8.0% so the number of first home buyer commitments as a percentage of total owner occupied housing finance commitments rose to 17.4% in September 2017 from 17.2% in August.

We also see a fall in fixed loans, down 14%.  The DFA sourced investor first time buyers also fell again, down 4%.

Here is the first time buyer tracker, down overall.

More broadly, the flow of new loans was down $19 million or 0.06% to $33.1 billion. Within that, investment lending flows, in trend terms, fell 0.52% or $62.8 million to $12.1 billion, while owner occupied loans rose 0.32% or $47.7 million to $15.0 billion.  So investment flows were still at 44.6% of all flows, excluding refinances.

Refinances comprise 17.9% of all flows, down 0.07% or $3.9 million, to $5.9 billion.

Looking in more detail at the ABS trend categories, OO lending flows for construction of new dwellings rose 0.4%, by $8.3 million to $2 billion, purchase of new dwellings rose $15 million or 1.29% to $1.2 billion; and purchase of OO existing dwellings rose 0.2% or $23 million to $11.8 billion. Investment new construction fell 1.57% or $16.5 million to $1.0 billion, purchase of housing by individuals for investment rose 0.14% or $13.9 million to $10.1 billion and investment property by other borrowers fell 5.9% down $60m to $950 million.

Finally, the original housing stock data shows that total ADI lending for housing rose 0.32%, or $5 billion to $1.57 trillion. Within that owner occupied stock rose rose 0.35% or $3.7 billion to $1.05 trillion and investment property lending rose 0.17% of 0.9 billion to $558 billion.

Citibank refunds $3.3 million to credit card customers and $1m on transactions

ASIC says Citibank has refunded Citibank has refunded around 4,000 current and former customers more than $1 million after misstating the bank’s obligations around unauthorised transactions on customers’ accounts. Separately, Citibank will refund more than $3.3 million to around 39,500 current and former customers for failing to refund customers when credit card accounts were closed with an outstanding credit balance.

Citibank will refund more than $3.3 million to around 39,500 current and former customers for failing to refund customers when credit card accounts were closed with an outstanding credit balance.

Citibank will provide refunds for Citibank, Virgin Money, Bank of Queensland, Suncorp and Card Services branded credit cards and for Citibank Ready Credit loan customers. Citibank is the credit provider for all of these products.

This error occurred on accounts as far back as 1994 but did not happen every time an account was closed.

Citibank is writing to eligible customers to advise that they will receive a refund of the credit balance with interest. Former customers will receive a bank cheque and current customers with an open account will receive a direct credit into their account.

The closed credit card and loan accounts with more than $500 in credit balances, which were not transacted on for seven years (or three years as applicable) have been transferred to ASIC as required under unclaimed money legislation.

Citibank has strengthened its systems so that cheques for credit balances are issued to customers automatically when they close their accounts.

“Customers should be confident that when they close an account, they are refunded any outstanding balance,” ASIC Deputy Chair Peter Kell said.

Mr Kell also said customers may be entitled to claim their balance through ASIC’s MoneySmart website which holds unclaimed money from accounts which have been inactive for a certain period:

“If you think you might be impacted, your money may be with ASIC as unclaimed money. I strongly encourage you to search your name on ASIC’s MoneySmart unclaimed money search.”

Citibank reported the issue to ASIC, and has cooperated with ASIC in resolving the matter.

Background

Citibank (Citigroup Pty Ltd) has commenced writing to all affected customers, and affected customers will be contacted before 30 November 2017.


Citibank has refunded around 4,000 current and former customers more than $1 million after misstating the bank’s obligations around unauthorised transactions on customers’ accounts.

Citibank had refused customers’ requests to investigate unauthorised transactions because it claimed the requests were made outside the time period permitted under the Visa and MasterCard scheme chargeback protections.

Affected customers had made reports to Citibank about ‘card not present’ unauthorised transactions (such as internet transactions), where a payment was made using the credit or debit card number details, rather than the physical card itself.

In letters sent to customers in response to their requests, Citibank incorrectly stated that because the request was made outside the timeframe specified by Visa and MasterCard, it was not required to assess the claim, and that the customer’s only options were to approach the merchant or a fair trading agency.

The letter would likely have misled customers about their protections under the ePayments Code. The ePayments Code provides protections to consumers for unauthorised transactions – these protections are separate to, and not the same as, the protections provided by Visa and MasterCard.

As a result, customers did not have their claims properly considered in accordance with Citibank’s contractual obligations with those customers under the ePayments Code.

To remediate affected consumers:

  • Current customers will have their accounts refunded
  • Former customers who are owed more than $20 will be sent a bank cheque
  • Former customers whose individual amounts were more than $500 and cannot be located will have their funds treated in accordance with unclaimed money requirements
  • For former customers owed less than $20, and those who cannot be located with amounts less than $500, an equivalent amount will be donated to charity

If a donation is made and the customer comes forward, Citibank will honour individual refunds.

Citibank has also reviewed its processes to ensure there are no further miscommunications about its obligations under the ePayments Code.

“If an unauthorised payment has been made on their account, customers should be confident that their bank will appropriately investigate the payment. Customers should never be misled about their rights under the Code.” ASIC Deputy Chair Peter Kell said.

“Banks should ensure in all their communications that they are clear and accurate with customers about their consumer rights.”

Citibank’s remediation program covered consumers who may have received the letter between 1 January 2009 to 22 July 2016, and did not have their claim appropriately assessed.

Broker Boom Outpaces Loan Growth – MFAA

According to the MFAA, the boom in brokers may be unsustainable, given lower mortgage growth.  The snapshot, up to March 2017, shows that the number of brokers is estimated to be 16,009, representing 1 broker for every 1,500 in the population.  Overall brokers rose 3.3% but net lending only 0.1%. As a result the average broker saw a fall in their gross annual income. On these numbers, brokers cost the industry more than $2 billion each year!

Around 53% of new loans come via brokers, they claim.

They call out a mismatch between the number of brokers and new loans settled, and other than in VIC, volumes are down relative to brokers.

Here is their release:

The latest Industry Intelligence Service (IIS) Report has revealed that finance brokers continue to facilitate more than one in two (53.6%) of all mortgages written in Australia.

“This is a strong performance in the context of investor and interest only prudential measures imposed by regulators during the period, however, there are some warning signs that we need to be taking note of,” said Mortgage & Finance Association of Australia (MFAA) CEO Mike Felton.

The IIS Report has revealed the number of finance brokers in Australia has grown by 3.3% to just over 16,000 (in the six-month period October 2016 to March 2017), with more than 500 new brokers joining the industry in the reporting period.

This exceeded the growth in the value of new home loan settlements by brokers nationally (up 0.1% at $94.61 billion) and the number of broker-originated new loan applications which fell 4.5% to 303,300.

“Whilst the improved broker coverage is positive for consumers, these statistics should be seen as grounds for caution and need to be closely monitored. It is not a sustainable trend to have broker numbers continually rising faster than the value of new business written and could be part of the reason why the report shows the average income for brokers is down 6% nationally. When the pie stays the same size and there’s more mouths to feed, the slices inevitably get smaller. The report reveals that, on average, the sum of a broker’s up-front and trail remuneration is $133,500 per annum, before costs, which is down from $142,500 in the previous report,” he said.

“The data shows that on a state level, only Victoria appears to have a clear alignment, or a reasonable equilibrium between the growth in broker numbers and growth in new lending,” he said.

The report also reveals that Australia’s finance brokers are gradually utilising the services of a more diverse range of lenders and diversifying the types of loans they are writing as well.

“This report is showing a shift in the broker use of loan products from majors and regionals aligned to majors to specialist lenders, international lenders and broker white label products,” Mr Felton said.

“Greater diversity is good news in that it strengthens the broker proposition and competition within the mortgage market,” Mr Felton said.

The MFAA’s Industry Intelligence Service (IIS) Report provides reliable, accurate and timely market intelligence for the mortgage broking sector. It is designed, produced and delivered by Comparator, a CoreLogic business and a recognised provider of performance benchmarking, market diagnostics and ad-hoc investigative services to the retail financial services sector in Australia and New Zealand.

Household Financial Security Weakens Again In October

The latest edition of the Digital Finance Analytics Household Financial Security Confidence Index to end October shows households are feeling less secure about their finances than in September. The overall index fell from 97.5 to 96.9, and remains below the 100 neutral setting. We use data from our household surveys to calculate the index.

While households holding property for owner occupation remain on average above the neutral setting, property investors continue to slip further into negative territory, as higher mortgage rates bite, rental returns slide and capital growth in some of the major markets stalls.  Those property inactive households remain the most insecure however, so owning property in still a net positive in terms of financial security.

There are significant variations across the states. VIC households continue to lead the way in terms of financial confidence, and WA households are moving up from a low base score. However, households in NSW see their confidence eroded as prices slide in some post codes (the average small fall as reported does not represent the true variation on on the ground – some western Sydney suburbs have fallen 5-10% in the past few months). Households in QLD and SA on average have held their position this month.

Confidence  continues to vary by age bands, although the average scores have drifted lower again. Younger households are consistently less confident, compared with older households, who tend to have smaller mortgages relative to income, and more equity in property and greater access to savings.

Looking in more detail at the FCI scorecard, 63% of household saw no change in their job prospects last month, while 19% felt less secure, especially in WA and SA.  Those with savings were a little less comfortable, reflecting both a net reduction in the amount saved (more households are raiding their savings to cover their costs of living) and lower interest rates on deposits.  Those with shares and other investments benefited from higher stock prices.

The burden of debt weighed heavy on many households with 42% of households less comfortable with their debt, a rise of 1.4% in the month. Some were concerned about potential interest rate rises, while others, especially those on interest only loans, were exercised by the prospect of having to refinance down the track.

More than half of households say their real incomes have fallen in the past year, and 67% said their costs of living have risen, up 4.1% from last month. Utility bills are higher, as are child care costs and school fees. We see more household relying on multiple part-time jobs to bring in sufficient income to pay the bills, and even then many are having to tap into savings to keep afloat.

We see little evidence of income growth in real terms, while credit growth continues at more than three time income. Given the recent slide in property values, and continued rises in living costs, we do not expect the index to move back into positive territory in the next few months.

By way of background, these results are derived from our household surveys, averaged across Australia. We have 52,000 households in our sample at any one time. We include detailed questions covering various aspects of a household’s financial footprint. The index measures how households are feeling about their financial health. To calculate the index we ask questions which cover a number of different dimensions. We start by asking households how confident they are feeling about their job security, whether their real income has risen or fallen in the past year, their view on their costs of living over the same period, whether they have increased their loans and other outstanding debts including credit cards and whether they are saving more than last year. Finally we ask about their overall change in net worth over the past 12 months – by net worth we mean net assets less outstanding debts.

We will update the results again next month.


How the property boom has pulled the banks into housing market risk

From The New Daily.

Experts warn the increasing dependence of Australian banks on the property boom is putting both the banking system and the wider economy at risk.

Just how important playing the property game has become for the banks was highlighted when Westpac recently released its annual results. The bank’s chief Brian Hartzer, who earned $6.7 million for the year, said lending for mortgages accounted for 62.4 per cent of the bank’s outstanding loan book of $684.9 billion.

Martin North, analyst and principal of Digital Financial Analytics, said that figure would “be closer to 70 per cent” if you add in the lending to property developers and other businesses related to the industry.

Around 20 years ago the banks typically lent almost as much to business as they did to housing, he said.

Source: APRA

The above table details the move to housing lending. However it differs slightly from the figures Westpac quoted as it is gleaned from figures the banks report to APRA rather than the way they report in their shareholders.

Nonetheless, all figures on the chart are calculated in the same way so it tells a story about the shift to mortgage lending over the past 15 years.

What it demonstrates is that the four major banks are lending a greater proportion of their loan assets to the residential property market than they were in 2002 when both owner-occupied and investment lending are added together.

Two of the big four, Westpac and NAB, have reduced their proportional exposure to home loans slightly, but when all residential property lending is added together, all have increased their relative exposures.

The ANZ has seen its home loan exposure jump from 38.7 per cent to 43.4 per cent of its exposures.

As a result, the ANZ, traditionally a business-focused bank, has seen its proportion of corporate lending decline from 33 per cent of the loan book to 26.8 per cent.

This is potentially dangerous.

Mr Hartzer warned on Monday the residential construction cycle had “peaked” with no sign that business investment was growing fast enough to take up the slack.

“It’s hard to see what will take its place,” he said.

Independent economist Saul Eslake told The New Daily the move to property lending has been in train for some time.

“Business has been pretty conservative about borrowing for investment since the last recession in the 1990s,” Mr Eslake said.

“We had a big mining investment boom but most of it was funded by equity because of the degree of risk in those mining projects. And because 80 per cent of the mining industry is foreign-owned most of the money it did borrow came from foreign banks through existing relationships.

“The projects were so big the Australian banks mostly couldn’t have funded them.”

The banks would be more exposed than in the past to the effects of a major house price fall, Mr Eslake said, although he doubted such a disastrous outcome would eventuate.

“I don’t expect that to happen although some people have been talking about it.”

A number of factors have driven the housing boom including population and income growth for the past 25 years, a huge fall in interest rates and increases in the tax advantages to property investment through negative gearing and the halving of the capital gains tax level, he said.

RBNZ Holds Cash Rate At 1.75%

The New Zealand Reserve Bank today left the Official Cash Rate (OCR) unchanged at 1.75 percent. They are projecting higher rates ahead.

Global economic growth continues to improve, although inflation and wage outcomes remain subdued.  Commodity prices are relatively stable.  Bond yields and credit spreads remain low and equity prices are near record levels.  Monetary policy remains easy in the advanced economies but is gradually becoming less stimulatory.

The exchange rate has eased since the August Statement and, if sustained, will increase tradables inflation and promote more balanced growth.

GDP in the June quarter grew broadly in line with expectations, following relative weakness in the previous two quarters.  Employment growth has been strong and GDP growth is projected to strengthen, with a weaker outlook for housing and construction offset by accommodative monetary policy, the continued high terms of trade, and increased fiscal stimulus.

The Bank has incorporated preliminary estimates of the impact of new government policies in four areas: new government spending; the KiwiBuild programme; tighter visa requirements; and increases in the minimum wage. The impact of these policies remains very uncertain.

House price inflation has moderated due to loan-to-value ratio restrictions, affordability constraints, reduced foreign demand, and a tightening in credit conditions.  Low house price inflation is expected to continue, reinforced by new government policies on housing.

Annual CPI inflation was 1.9 percent in September although underlying inflation remains subdued.  Non-tradables inflation is moderate but expected to increase gradually as capacity pressures increase.  Tradables inflation has increased due to the lower New Zealand dollar and higher oil prices, but is expected to soften in line with projected low global inflation.  Overall, CPI inflation is projected to remain near the midpoint of the target range and longer-term inflation expectations are well anchored at 2 percent.

Monetary policy will remain accommodative for a considerable period.  Numerous uncertainties remain and policy may need to adjust accordingly.

700 Years Of Data Suggests The Reversal In Rates Will Be Rapid

From Bank Underground.

A GUEST post on the Bank of England’s “Bank Underground” blog makes the point that most reversals after periods of interest rate declines are rapid. When rate cycles turn, real rates can relatively swiftly accelerate. The current cycle of rate decline is one of the longest in history, but if the analysis is right, the rate of correction to more normal levels may be quicker than people are expecting – and a slow rate of increases designed to allow the economy to acclimatize may not be possible.  Not pretty if you are a sovereign or household sitting on a pile of currently cheap debt!

With core inflation rates remaining low in many advanced economies, proponents of the “secular stagnation” narrative –that markets are trapped in a period of permanently lower equilibrium real rates- have recently doubled down on their pessimistic outlook. Building on an earlier post on nominal rates this post takes a much longer-term view on real rates using a dataset going back over the past 7 centuries, and finds evidence that the trend decline in real rates since the 1980s fits into a pattern of a much deeper trend stretching back 5 centuries. Looking at cyclical dynamics, however, the evidence from eight previous “real rate depressions” is that turnarounds from such environments, when they occur, have typically been both quick and sizeable.

Despite much research into the causes of real rate distortions in recent years, the discussion has arguably suffered from a lack of long-term context. Key additions – such as the  influential BoE staff working paper confirming the role of excess savings and lower investment preferences – typically trace back their observations to the late Bretton Woods period, or at best to Alvin Hansen’s time in the interwar period. Hamilton et al. and Eichengreen are rare exceptions in their inclusion of 19th century data.

Therefore, the majority of work on secular stagnation– and with it the debate regarding bond market valuations  – fails to consider the deeper historical rate trends. In contrast, a  multi-century dataset  offers the opportunity to look at cyclical behavior and the dynamics of reversals from earlier real rate depressions.

Seven centuries of real risk free rates

In this spirit, this post (based on a new Staff Working Paper) provides a real rate dataset for the last 700 years, and identifies a total of nine “real rate depressions” sharing similar traits to the trend observed since the 1980s.

This chart further expands risk-free nominal bond data introduced in a previous post, and adjusts for historical ex-post inflation data provided by Bob Allen, Bank, Bundesbank, archival, and FRED data. We trace the use of the dominant risk-free asset over time, starting with sovereign rates in the Italian city states in the 14th and 15th centuries, later switching to long-term rates in Spain, followed by the Province of Holland, since 1703 the UK, subsequently Germany, and finally the US.

The all-time real rate average stands at 4.78% and the 200-year real rate average stands at 2.6%. Relative to both historical benchmarks, the current market environment thus remains severely depressed.

Upon closer inspection, it can be shown that trend real rates have been following a downward path for close to five hundred years, on a variety of measures. The development since the 1980s does not constitute a fundamental break with these tendencies.

Regressing the 7-year average on a constant time trend (the red line) indicates an average fall of 1.6 basis points per annum. Simple averages tell a similar story of decline. In many ways, therefore, the “secular decline” in real rates since the days of Paul Volcker is but a part of a deeper “millennial decline” tracing back its roots to the days of the late Quattrocento.

The all-time peaks in real yields in the mid-1400s coincide with the geopolitical escalations amid the fall of Constantinople, the seizure of silver mines by the Ottomans, on the Balkans, and evidence of increasing European BoP deficits to the Levant – factors consistent with the narrative of a “Great Bullion Famine”. The “real rate turning point” on our basis thus somewhat precedes the classical dating of the “financial revolution” and the sharp inflows of New World treasure. The falling trend continues unabatedly after other political inflections, such as the Reformation, the Thirty Years War, and into the modern days of Globalization.

The breakdown of real risk-free rates: nominal and inflation components

The real rate, by definition, represents the difference between nominal rates and inflation.

The 700-year average annual ex-post headline inflation for the risk-free issuer stands at 1.09%,, the 200-year average, since 1817, stands at 1.55%, with a further pickup in the 1900s. Three observations stand out: First, the past 60 years, in which the US has been the benchmark bond issuer has been the most inflationary in our whole sample period; second, current inflation rates of slightly below 2% remain fully in-line with the ex-post performance witnessed in modern times, with today’s typical inflation targets already being accommodative if measured against (very) long run trends. Third, never before has a longer period without deflation existed than the ongoing 70-year spell since World War Two.

Economists often view the real-nominal-inflation nexus through the lens of the Fisher equation– where long run nominal rates are the sum of two “structural” variables: real rates, and (expected) inflation.  The chart below presents the real rates and ex post inflation rates in terms of century averages:

The green bars show the fall in real rates, blue bars the contribution of inflation. Evidently, the fall in real rates over successive centuries has been partially muted by the higher inflation in the 20th and 21st centuries. As a result the decline in nominal rates over time has been somewhat less than the underlying fall in real rates.

“Real rate depression cycles”

Focusing on our cyclical precedents, on several previous occasions, rates have exhibited a sustained divergence from long-term averages. Over the seven centuries, nine historical “real rate depression cycles” can be identified, which saw a secular decline of real interest rates, followed by reversals.  The chart below plots the size and duration of these compression episodes:

Our current “secular stagnation” of real rates, at 34 years, is the second longest thus far recorded. Only the years immediately surrounding the discovery of America outstrip the current cycle by length. Measured by total rate compression from peak to trough, the period from 1325 to 1353 – at 1700 basis points in real rates – is the most notable. In our 7-year moving average dataset, the all-time trough within depression episodes is recorded in 1948, at -5.3%.  Turning to how these depressions end, the chart below plots the path of real rates in each reversal period following the trough.

Most reversals to “real rate stagnation” periods have been rapid, non-linear, and took place on average after 26 years. Within 24-months after hitting their troughs in the rate depression cycle, rates gained on average 315 basis points, with two reversals showing real rate appreciations of more than 600 basis points within 2 years. Generally, there is solid historical evidence, therefore, for Alan Greenspan’s recent assertion that real rates will rise “reasonably fast”, once having turned.

Fundamental Stagnations: A closer look at the “Long Depression”

Most of the eight previous cyclical “real rate depressions” were eventually disrupted by geopolitical events or catastrophes, with several – such as the Black Death, the Thirty Years War, or World War Two – combining both demographic, and geopolitical inflections. Most cyclical real rate depressions equally coincided with inflation outperformances. But for a minority of cycles, economic fundamentals were decisive, and exhibited both excess savings and subdued inflation. The prime example – and likely the closest historical analogy to today’s “secular stagnation” – is represented by the global “Long Depression” of the 1880s and 1890s.

Following years of a global railroad investment frenzy, and global overcapacity indicators inflecting in the mid-1860s, the infamous “Panic of 1873” heralded the advent of two decades of low productivity growth, deflationary price dynamics, and a rise in global populism and protectionism.

Following the crash, the UK’s 10-year moving average TFP growth declined from 1.7% in the early 1870s, to flat, and even at times negative levels in the following two decades (Chart below). Labor productivity in particular shrunk, plummeting by around two-thirds in the same timeframe, after reaching new all-time records at the dawn of the crisis. Though recent research has emphasized nominal factors for the period, most contemporaries including Joseph Schumpeter stressed real drivers. Indeed, real GDP trend growth in the UK reached century lows by the 1890s. Despite alleged money scarcity, borrowing rates declined.

What ended the Long Depression? Labor productivity bottomed out in 1892-3, prior to the discovery of gold at the Klondike, and the associated monetary expansion. Wage inflation started outstripping productivity increases as early as 1885, leading the recovery in general inflation. And US equities finally bounced back from their 15-year lows with the Presidential election of William McKinley – a Republican pro-business protectionist – in November 1896. In other words, there is strong evidence suggesting that the last “secular stagnation cycle” started fading relatively autonomously after just over two decades following the key financial shock, not requiring the aid of decisive fiscal or monetary stimulus.

Conclusion

On aggregate, then, the past 30-odd years more than hold their own in the ranks of historically significant rate depressions. But the trend fall seen over this period is a but a part of a much longer ”millennial trend”. It is thus unlikely that current dynamics can be fully rationalized in a “secular stagnation framework”. Meanwhile, looking at past cyclical patterns, the evidence suggests that when rate cycles turn, real rates can relatively swiftly accelerate.

Paul Schmelzing is an academic visitor to the Bank from Harvard University’s History Department.

Note: Bank Underground is a blog for Bank of England staff to share views that challenge – or support – prevailing policy orthodoxies. The views expressed here are those of the authors, and are not necessarily those of the Bank of England or its policy committees.

The RBA may have to lift rates to manage debt risk

From Business Insider.

Financial stability risks have taken on increased importance in monetary policy deliberations of Reserve Bank of Australia (RBA) Governor Philip Lowe – far more than under his predecessor, Glenn Stevens.

The importance of managing those risks, especially in the household sector, were scattered, yet again, through the RBA’s November monetary policy statement this week.

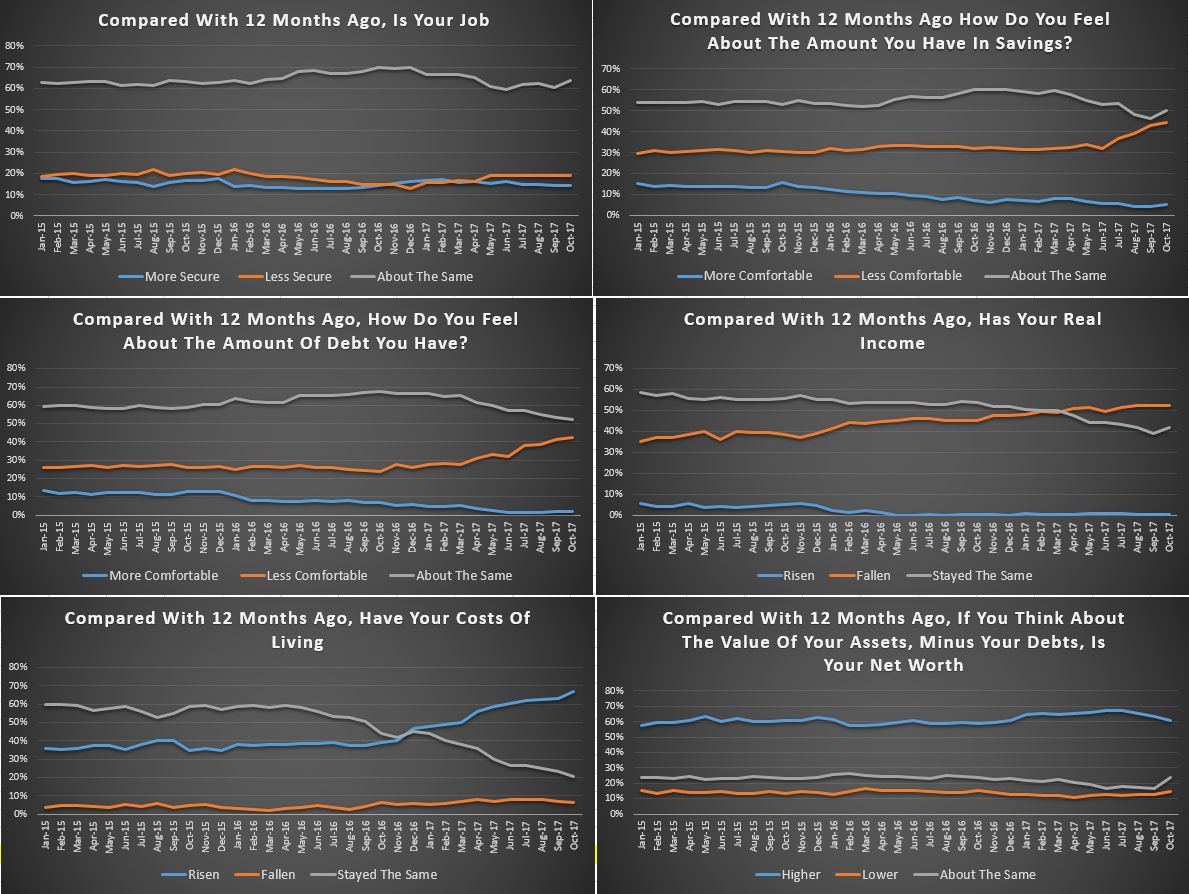
“Household incomes are growing slowly and debt levels are high,” Lowe said, elaborating on the uncertain outlook for household consumption given recent weakness in retail sales.

And, on household debt specifically, he said that “growth in housing debt has been outpacing the slow growth in household income for some time,” repeating the warning he issued in October.

Clearly, managing these risks, in his opinion, are of utmost importance.

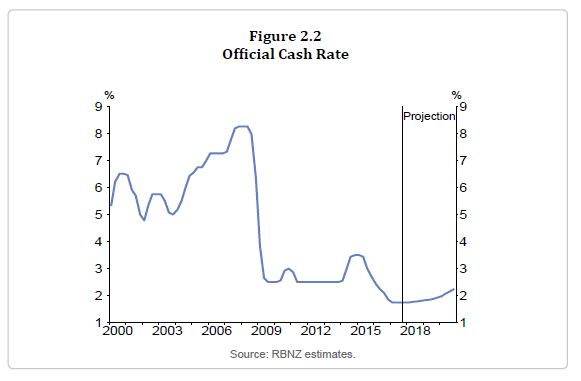
Despite persistently low inflationary pressures, weak economic growth, softening household spending levels and strength in the Australian dollar, Lowe has left interest rates unchanged since his took over as Governor in September last year, a distinct shift in mindset to what was seen in prior years.

Gone are the days of rates moving like clockwork in the month following a quarterly consumer price inflation (CPI) report, replaced instead by a broader focus that appears to place less emphasis on the inflation outlook and more on what could happen in other parts of economy should rates be lowered again, especially the east coast property market.

The era of continually lowering rates to bring inflation back into the bank’s 2-3% target in a more timely manner now appears to be over.

Lowe, as many Australians are acutely aware, knows all too well what happened in 2016 when the RBA cut rates twice in an attempt to boost inflationary pressures.

Property prices in Sydney and Melbourne surged again, thanks largely to a pickup in investor activity. Household debt levels, as a response, rose from already elevated levels, far outpacing growth in household incomes.

Household leverage, therefore, continued to increase, helping to explain why Lowe has been reluctant to cut interest rates further, pouring even more fuel on an already hot east coast property market.

As he told parliamentarians earlier this year, further rate cuts “would probably push up house prices a bit more, because most of the borrowing would be borrowing for housing.”

Instead of hiking rates to mitigate financial stability risks as was usually the case in the past, the RBA, working with other members of Australia’s Council of Financial Regulators — APRA, ASIC and Treasury — decided to go down another path, introducing tougher macroprudential restrictions on interest-only lending earlier this year, building upon the 10% annual cap on investor housing credit growth introduced by APRA in late 2014.

On the early evidence, it’s succeeded in helping to cool the rampant Sydney and Melbourne property markets.

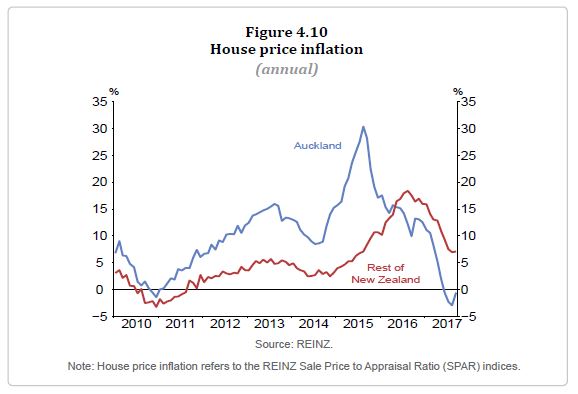
According to data from CoreLogic, Sydney house prices have fallen in each of the past two months, coinciding with auction clearance rates falling to the lowest level since January 2016.

Price growth in Melbourne has also slowed, logging the smallest quarterly increase since mid-2016 in the three months to October. Clearance rates there have also fallen from the highs seen earlier this year.

With prices in Sydney going backwards and those in Melbourne, it saw national house prices, on a weighted basis, remain unchanged last month.

As Lowe said earlier this week, “housing prices have shown little change over recent months”, partially attributing the slowdown to tougher macroprudential measures introduced in late March.

“Credit standards have been tightened in a way that has reduced the risk profile of borrowers,” he said.

However, while this, along with other factors such as affordability constraints and out-of-cycle mortgage rate increases for some borrowers, has undoubtedly helped to slow the housing market without having to resort to rate hikes, Lowe still has a problem that remains unaddressed.

No only is growth in housing debt outpacing household incomes, it’s actually widened further this year despite tighter lending restrictions.

This excellent chart from ANZ shows the quandary facing Lowe.

Source: ANZ


It shows Australia’s household debt to income ratio, expressed as an annual percentage change.

“The most recent RBA data on private sector credit showed that in the year to September housing credit was up 6.6% year-on-year,” says David Plank, Head of Australian Economics at ANZ.

“The annual growth rate has been steady since May, though it has accelerated marginally since this time last year and is still significantly outpacing income growth.”

So even with the slowdown in the housing market and increased scrutiny of borrowers, household leverage has still continued to increase, adding to financial stability risks should an unexpected economic shock occur.

Plank suggests that unless income growth accelerates substantially, or growth in housing credit slows, household leverage will likely increase further.

He doesn’t hold out much hope that an acceleration in income growth will be able to achieve this in isolation.

“We very much doubt that an acceleration of income growth will completely close the gap,” he says.

“For this to happen, we need to see a further slowing in the growth rate of housing debt. “We think it unlikely that the gap can be closed without additional policy action.”

While Plank doesn’t think the RBA or APRA will rush into tighter restrictions on housing lending anytime soon, noting that annual housing credit growth has slowed marginally since APRA changes were introduced earlier this year, he says that other measures will likely be required to slow or reduce household leverage.

And that list includes rate hikes.

“We think the RBA and APRA will wait to see how things unfold, especially with house price inflation continuing to slow,” he says.

“We are sceptical, however, that the gap between debt and income growth will close without more direct policy action.

“This may initially be in the form of further macro-prudential policy, but ultimately we think it will take somewhat higher interest rates, at the very least, to bring household debt growth in line with that of income.”

ANZ is forecasting that the RBA will lift interest rates twice in 2018 — once in May and again in the second half of the year — making it one of the more hawkish forecasters in the market at present.

“We think it will opt to raise rates around the middle of next year, so long as it is confident that inflation is not moving lower and the economy is on track to deliver a falling unemployment rate,” Plank says.

The question, he says, is how will the RBA balance its inflation and financial stability objectives?

Attempting to address financial stability risks while at the same time ensuring the fledgling economic recovery isn’t derailed before it is truly self-sustaining will not be an easy task for the RBA.

Indeed, one could easily argue that higher interest rates or tighter macroprudential measures to reduce household leverage could actually heighten financial instability risks.

Given the pressure on households from high levels of indebtedness, weak wage growth and increased energy costs, along with the slowdown in the housing markets that’s already underway, any further measures could place even further pressure on household balance sheets, creating additional headwinds for household consumption that already exist.

As the most important component in the Australian economy, weaker consumption levels would almost certainly lead to slower economic growth and softer labour market conditions.

For highly indebted households, a slowdown in the both the housing and labour markets — especially at the same time — would do little to mitigate financial stability risks.

One suspects it would be the exact opposite outcome, in fact.

You can see the dilemma facing Lowe, trying to solve one problem without creating an even larger one in response.

Given how influential the property market has become on the Australian economy, a policy misstep now could have significant ramifications, both now or in the future.