With a new futures market, Bitcoin is going mainstream

From The Conversation.

The Chicago Mercantile Exchange will soon begin trading Bitcoin derivatives (futures contracts), signalling the cryptocurrency is now a mainstream asset class. Bitcoin has had limited use in the mainstream economy in part because the volatility of its price. The value of the currency might go up or down significantly between the time a deal is struck and delivery.

The introduction of Bitcoin futures contracts will allow investors to manage this risk, and make it safer to hold and trade in Bitcoin. This will make the cryptocurrency more accessible to individuals and businesses, and encourage developers to build more products and services on top of the technology.

Futures and other derivatives are contracts between two parties to fix the price of an underlying asset (currencies, shares, commodities etc.) over a period of time or for a future transaction. The buyer of these contracts commits to purchase the underlying asset at a set price and at a certain date, and the seller commits to sell.

There are two main uses for these contracts. First, to reduce price risk by freezing future prices. The second use is speculation. For instance, a speculator would commit to buy a commodity/share/currency at a certain time, hoping that the market price at the time of delivery is higher than the price set in the contract.

Airlines commonly buy long term oil future contracts to hedge against the potential increase in fuel price, or to take advantage of what they believe to be a low price.

Similarly, future contracts will enable traders to lock in the value of Bitcoin for a defined period of time. This effectively removes the risk associated with fluctuation in value. In addition, since these contracts will be traded on the Chicago Mercantile Exchange, the exchange effectively guarantees that both buyers and sellers will abide by the agreement.

In 2010, one Bitcoin was worth less than one hundredth of an Australian cent. As of Monday the 6th of November, the price is near A$10,000.

The market capitalisation of Bitcoin is now well over A$160 billion, which is larger than the GDP of most small countries. As the price of Bitcoin has grown, so too have transaction volumes, showing an increasing use of the cryptocurrency.

As a result, Bitcoin is starting to look like a credible investment in any respectable financial portfolio.

Although, this is not the first futures contract for cryptocurrency. Futures contracts already exist for both Ethereum and Monero.

But the Chicago Mercantile Exchange’s futures contract is significant as the CME group manages not only the Chicago Mercantile Exchange, but also the Chicago Board of Trade and New York Mercantile Exchange and Commodity Exchange. Combined, these exchanges represent the largest derivative market in the world.

The decision to issue futures contracts on Bitcoin rather than another derivative is also significant. So far Bitcoin derivatives have mainly been swap agreements. A swap is a commonly used financial tool where two parties agree to swap financial instruments, such as interest or currencies. The key point is that the two parties, the buyer and seller, make a deal directly with each other.

As a swap agreement is not done through an exchange, the risk of a party not delivering on the agreement can be quite high. If one party decides to opt out, the agreement has to be terminated. This leaves the other party exposed.

Futures contracts eliminate this “counterparty” risk, as the exchange clears the transaction and guarantees delivery. And unlike swaps, futures contracts are standardised (in term of size, how much is going to be traded, and maturity date etc.). This means futures contracts can be traded at any time until maturity, making them very liquid and accessible.

The lack of a futures market in Bitcoin was a significant barrier to it becoming a mainstream asset class. You can buy and sell forward contracts on the Fijian dollar, for instance, meaning that institutional funds anywhere in the world can hold Fijian dollars in their portfolio and manage the risks of that asset.

But they cannot yet do that with Bitcoin. Until now, there has been no way to offload the risks associated with fluctuating prices. An investor could always hold the cryptocurrency, but they would do so fully exposed to price volatility.

The introduction of Bitcoin futures contracts will allow traders to hedge against this volatility and eliminate the currency risk. This will make Bitcoin more attractive for both individuals and corporations.

As crypto-assets become a mainstream investment class, other products emerge around them (such as exchange traded funds). It will also have a similar effect to that of mainstreaming share ownership – enabling a much larger fraction of the population to diversify their asset portfolios and income streams.

This will unlock some of the value currently being built on cryptocurrencies and blockchain technology – new products and services – that are currently only accessible to a relatively small number of the early enthusiasts and those helping build the technology.

The increased flow of investment funds into Bitcoin will likely push prices up further, but it will also incentivise more work to build products and services on the technology. Bitcoin just went mainstream.

Authors: Jason Potts, Professor of Economics, RMIT University; Marie-Anne Cam, Senior Lecturer in Finance, RMIT University

RBA Releases FOI Data On Housing Component of CPI

Does the CPI method of calculation accurately reflecting the housing costs facing households? This has been subject of much discussion and RBA has released 98 pages of information under a FOI request – “Documents relating to the removal of mortgage interest rates from the CPI series in September 1998 and documents relating to the housing component of the CPI between September 2016 and September 2017″.

The FOI papers go through from the 1997/8 decision by the ABS to change the housing element of CPI from an “outlay” to “acquisition” approach. Market prices for goods and services are exclusively utilised… Non‐monetary transactions (i.e. imputed prices, such as imputed rent) and interest rate payments are excluded. This is the method the RBA supported.

There was much discussion in the documents as to whether house prices are connected with actual dwelling construction costs, rather than the market rate, which is more to do with sentiment, location etc. [Compare similar property  in Sydney versus Tasmania, for example].

This from 2017:

Papers this morning continue to discuss the ‘massive flaw’ in the consumer price index (CPI). The Daily Telegraph headlines ‘flaw in RBA calculations hits home’, though the article later clarifies that it is referring to the Australian Bureau of Statistics’ ‘premier’ inflation gauge, which guides the Bank in its monetary policy deliberations. Articles say the main problem (revealed in a Commonwealth Bank analysis released yesterday) is the exclusion of a broad measure of property price growth in the CPI calculation. It is argued that including dwelling prices in the CPI would ‘assist’ the Bank in hitting its inflation target. This suggests that the current cash rate setting is too low, which in turn is fuelling the property boom and leading to record high household debt.

Recent media reports have discussed the treatment of housing in the CPI, arguing that due to the exclusion of dwelling prices (including land) the CPI understates cost of living pressures for those looking to purchase property.

The media reports refer to a Commonwealth Bank (CBA) article, which argues that the CPI is considered to be a defacto cost of living index. The author suggests that the cost of a dwelling, including land, is part of the inflation faced by households who aspire to own a home. By adding in a measure of dwelling prices (with a 10 per cent weighting), CBA suggest that CPI inflation would have been much higher over most of the past decade.

This would mean the policy interest rate setting was too low.

The CBA article uses the residential property price index to measure owner-occupied housing costs. This is not suitable for a cost of living measure. A dwelling is an asset that provides a stream of housing services.

The cost of living index should measure the cost of obtaining the housing services, which is the user cost, not the cost of obtaining the dwelling itself. The user cost will be affected by the price of the dwelling, but it will also reflect other considerations, such as the real interest rate. Of course, changes in the prices of existing dwellings are still relevant to debates about intergenerational equity. Changes in dwelling prices, like changes in the prices of financial assets, can affect the relative wealth of different demographic groups.

In response, the ABS said “The Australian CPI is primarily used as a macro‐economic indicator to monitor and evaluate levels of inflation in the Australian economy. The CPI is not designed as a cost of living index.” This is consistent with earlier statements by the ABS”.

Also worth noting in today’s ABS release, they stick to the acquisition approach.

Under the acquisitions approach used in the CPI, the net purchase of housing, the increase in volume of housing due to renovations and extensions, plus other costs (e.g. maintenance costs and council rates) are all included for owner–occupied households. Of note, land is excluded from the calculation of housing in the Australian CPI as it is considered an investment rather than consumption. This approach aligns with international statistical standards and the primary purpose of the CPI as a macro–economic indicator. Changes in rental are measured for that part of the population that resides in rented dwellings. The CPI excludes interest paid on mortgages.


Banks Need To Grow Deposits In Line With Credit

The Reserve Bank New Zealand has published an Analytics Note entitled “Diving in the deep end of domestic deposits“.   They conclude that banks may need to limit credit growth unless they are able to grow retail deposits in line with credit growth.

Deposits are an important part of the New Zealand financial system. Deposits play a large role in funding bank lending – banks try to attract deposits in order to build up funds to lend out to borrowers. Over the past couple of years, lending has been growing faster than deposits, requiring banks to source funding from offshore wholesale funding markets. External funding can increase risks in the financial sector, as deposits are typically a more stable (“core”) source of funding than offshore wholesale funding.

This paper explores deposit growth in New Zealand in order to answer two questions:

1) What factors drive deposit growth in New Zealand, particularly in the past few years?

2) Can banks increase deposits by increasing interest rates?

We use two models to explore the dynamics of household deposits in New Zealand’s banking system in order to answer these questions. The first model uses bank-specific data from New Zealand’s four largest banks, while the second uses aggregate data for the entire banking system.

The paper highlights that the rate of domestic deposit growth has varied significantly since the Global Financial Crisis, and sharply slowed over 2016. We provide evidence that a range of supply and demand factors influence deposit growth, and that the recent slowing was largely driven by a reduction in supply (that is, households wanting to allocate less money to deposit products). We also find that banks increased their demand for deposits in late 2016 in an effort to close the gap between deposit growth and lending.

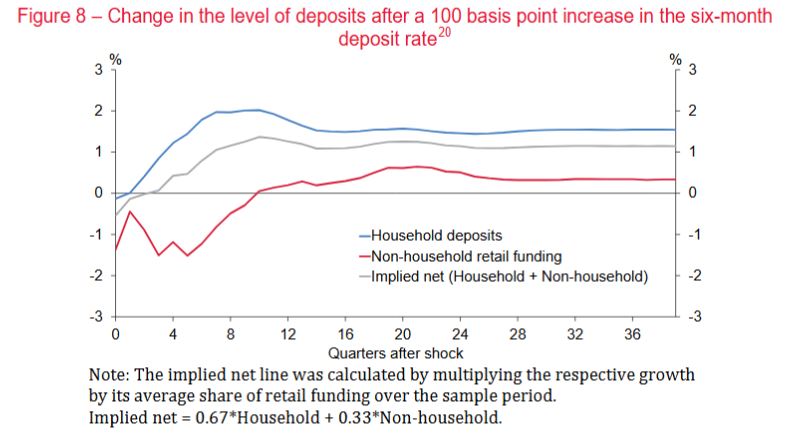
We also consider the degree to which banks are able to increase deposit growth materially by raising interest rates. We find that a 1 percentage point increase in the six-month deposit rate can increase the level of household deposits by about 1 percent after four quarters, and by 1.3 percent in the long-run.

As we find that deposits are not strongly responsive to interest rates, if banks wish to maintain robust funding profiles by not becoming too reliant on offshore wholesale funding, they may need moderate credit growth or use a combination of approaches to bring deposit growth in line with credit growth.

The Analytical Note series encompasses a range of types of background papers prepared by Reserve Bank staff. Unless otherwise stated, views expressed are those of the authors, and do not necessarily represent the views of the Reserve Bank.

CBA and Westpac launch facial recognition on the iPhone X

Commonwealth Bank says it is the first Australian bank to offer customers secure access to their accounts using Face ID, the facial recognition technology built into Apple’s new iPhone X.

iPhone X users will be able to use Face ID to securely log-in to the CommBank App.

“Our customers use secure fingerprint logins on the CommBank App about 30 million times a month,” said Pete Steel, Commonwealth Bank Executive General Manager of Digital.

“Extending that functionality to Face ID is part of our ongoing work to provide a better banking experience to our customers through simple, easy and secure features.”

Face ID is one of the most secure ways to log into an account because it performs in-depth mapping of an individual’s face using more than 30,000 points of reference. These include the spacing between, and shape of, facial features.

“While we strive towards convenience and ease of use, we don’t implement new technology without being able to guarantee security for customers,” he says.

Westpac has subsequently also announced a similar facility.

This despite neither banks offering Apple Pay.

Auction Volumes Fall Across the Combined Capitals

From CoreLogic.

There were significantly fewer homes taken to auction across the combined capital cities this week, after last week saw volumes reach a year-to-date high (3,713). There were a total of 2,019 auctions held returning a preliminary auction clearance rate of 66.8 per cent, increasing on last week’s final clearance rate of 64.5 per cent. Over the corresponding week last year, 73.6 per cent of the 2,517 auction held were successful.

Melbourne saw the most notable decrease in volumes; the lower volumes a likely result of the upcoming Melbourne cup festivities and coming off the back of the busiest week for auctions ever recorded for the city last week, with only 309 held this week and 77.3 per cent clearing. Sydney’s preliminary auction clearance rate rose this week to 67.4 per cent, after last week’s final auction clearance rate fell to its lowest recorded since January 2016 (58.3 per cent), while volumes remained steady week-on-week. Performance across this remaining capital cities was varied this week, with Perth returning the lowest clearance rate of 30 per cent.

2017-11-06--auctionresults_capitalcities

ABS Revises CPI Weightings, Will They Lead the Measure Lower?

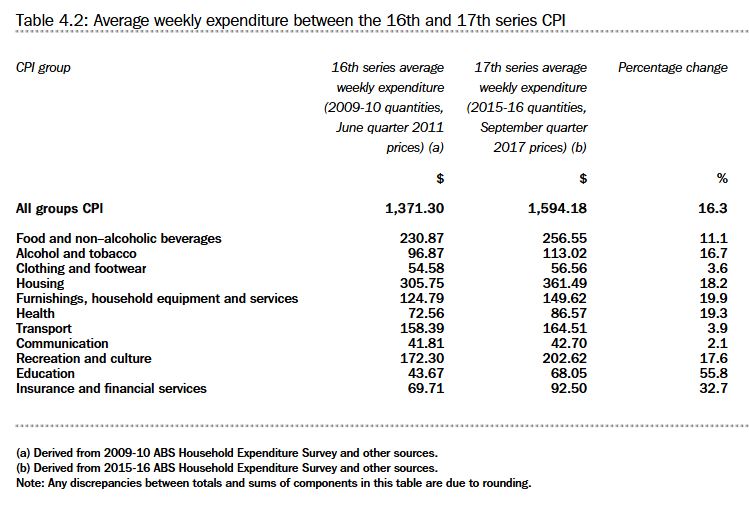
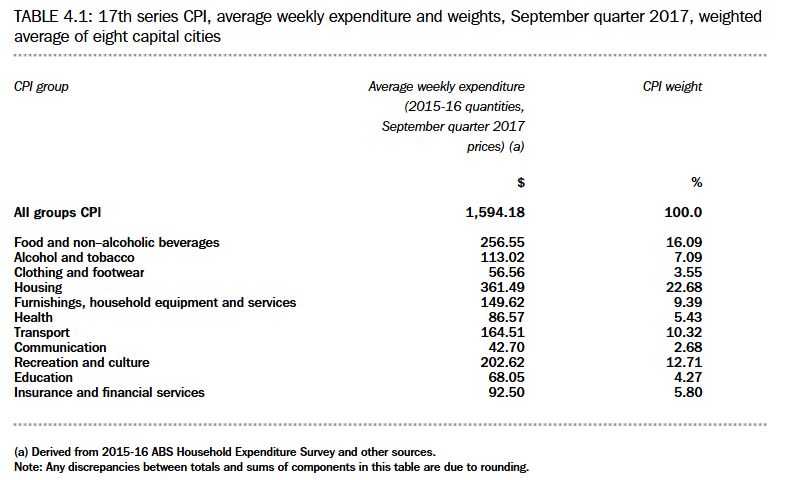
The Australian Bureau of Statistics has now released their paper which describes the changes that will be made to the Consumer Price Index (CPI) and Selected Living Cost Indexes (SLCIs) as a result of the introduction of the 17th series expenditure patterns.

There are quite a number of technical changes, as well as different weights for specific items. Housing and power costs for example will be higher. From 2018, the CPI will be re–weighted annually in December quarters

This is likely to lead to a lower headline CPI rate, perhaps by around 0.25% or more (DFA estimate), though there are various offsetting adjustments, so we cannot be sure.  More noise in the numbers!

The first publications based on the 17th series will be in respect of the December quarter 2017, which are due to be released on 31 January 2018 (CPI) and 7 February 2018 (SLCIs).

Australia has produced indexes of retail price inflation going back as far as 1901. Prior to the introduction of the CPI in 1960, there were five series of retail price indexes compiled by the (then) Commonwealth Bureau of Census and Statistics. Since 1960, the Australian Bureau of Statistics (ABS) has maintained a program of periodic reviews of the CPI to ensure that it continues to meet community needs. The main objective of these reviews is to update the household expenditure information used to set the item weights in the CPI, but they also provide an opportunity to reassess the scope and coverage of the index.

The SLCIs, incorporating the Pensioner and Beneficiary Living Cost Index (PBLCI) and the Analytical Living Cost Indexes (ALCIs) have also been reviewed as part of the 17th series. These indexes are produced as a by-product of the CPI, with weights also derived from the Household Expenditure Survey (HES).

The 17th series review is a minor review of the CPI and SLCIs, consisting of an update of the upper level (expenditure class) weights in line with the latest HES, and a simple examination of structures and methodologies.

This information paper provides an overview of the changes to the CPI and SLCIs that will be introduced with the 17th series from the December quarter 2017. It describes the household expenditure data used to calculate the weights and the ways in which some of the data have been adjusted to align with CPI and SLCI requirements. The paper also presents the updated weighting patterns and some background on the major shifts in weights between the 16th and 17th series. There are no changes to the classification structure or publications in respect of the 17th series.

They also continue to explore options for a more frequent and timely monthly measure.

ANZ Job Ads Up In October

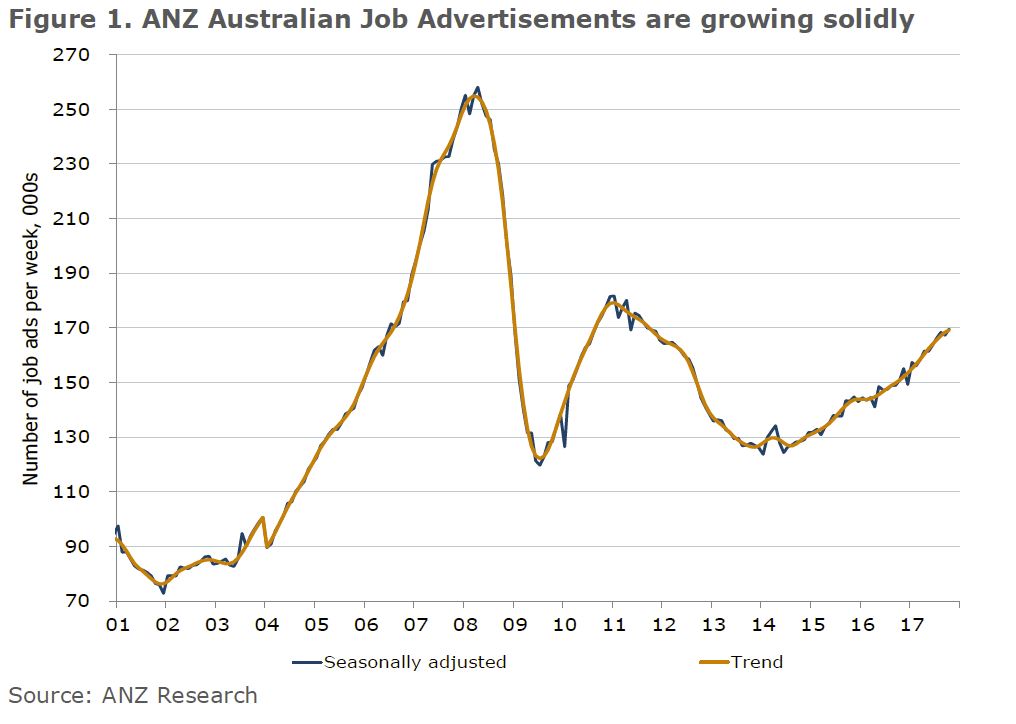
ANZ Job Advertisements rose 1.4% m/m in October, more than reversing the 0.7% decline previously. They now sit 12.5% higher than they did a year ago.

But in trend terms, job ads were up 0.5% m/m in October after a 0.7% rise the previous month. Annual trend growth eased slightly, from 12.4% in September to 12.2%.

ANZ said:

The bounce in ANZ Australian Job Advertisements in October is consistent with elevated business conditions and capacity utilisation. The slight slowing in the month-on-month trend growth since August supports our view that employment growth is likely to moderate a touch after this extraordinary period of strength. We also note that the official employment data appears to overshot the level implied by ANZ Job Advertisements.

Even as the labour market strengthens, with the unemployment rate falling to a four-year low of 5.5% in September, solid growth in nominal wages continues to remain elusive. The experiences of other advanced economies that are at or close to levels of full employment suggest that global factors are keeping nominal wage growth low. Even so, we think it
reasonable to expect some upward pressure on wages as the labour market tightens, given some evidence that sectors experiencing stronger labour demand have stronger growth in average weekly wages. As such, we find the fall in our monthly estimate of underemployment quite encouraging.

We will be closely watching the Q3 Wage Price Index, out next week, for any signs of improvement in underlying conditions, though this may be difficult to discern given the impact of the higher minimum wage.

Westpac FY17 Up 3%; Margin Down – Banking on Property

Westpac has released their FY17 results. They are literally banking on property. They do not expect home prices to fall significantly and they expect mortgage lending to continue to grow.

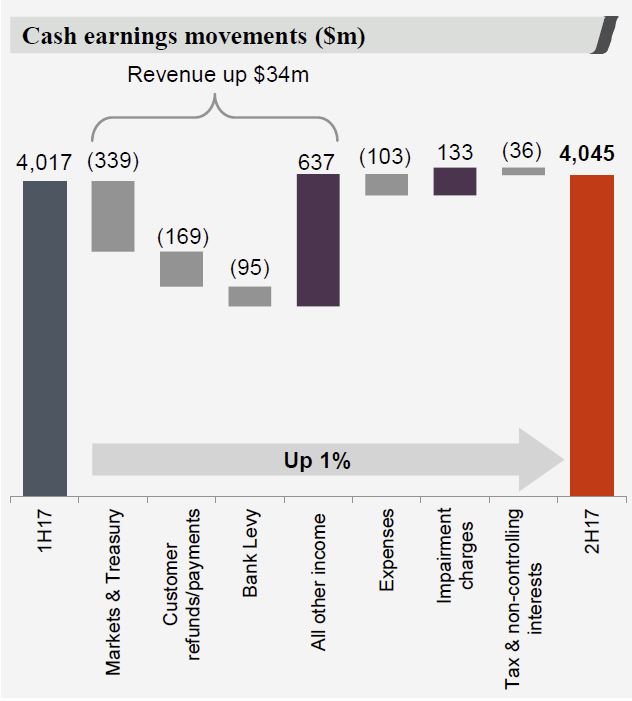
Statuary net profit was $7,990 million, up 7% on 2016, and cash earnings up 3% to $8,062.

This is a bit lower than expected, impacted by lower fees and commission, pressure on margins, the bank levy and a one-off drop to compensate certain customers.  Despite strong migration to digital, driving 59 fewer branches and a net reduction of ~500 staff, expenses were higher than expected. There has been a 23% reduction in branch transactions over the past two years in the consumer bank. Treasury had a weak second half.

Around 70% of the bank’s loan book is one way or another linked to the property sector, so future performance will be determined by how the property market performs.

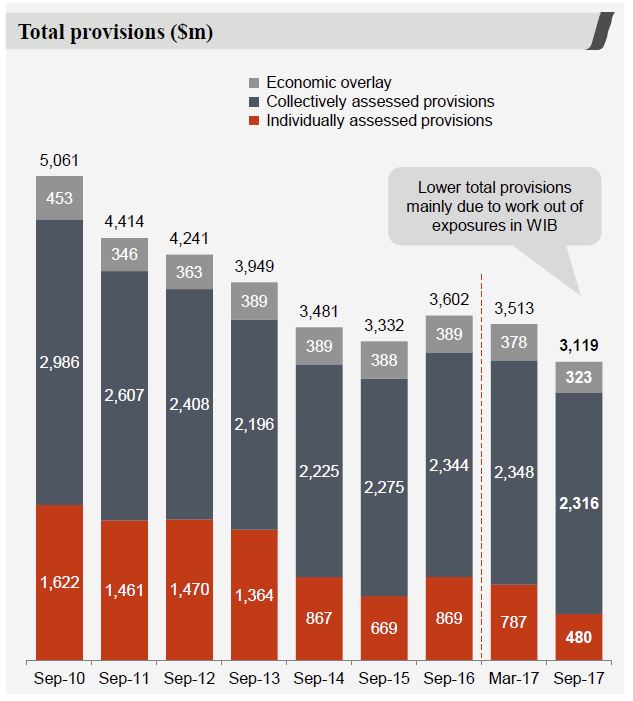
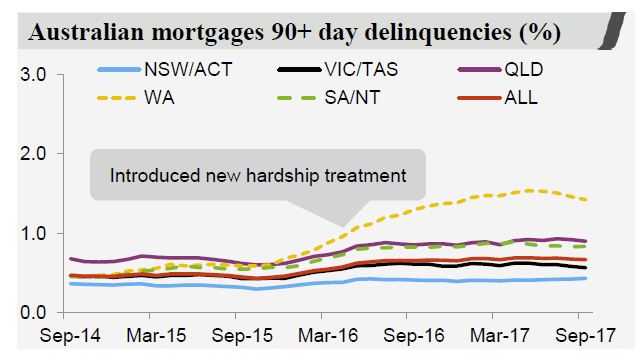
Provisions were lower this cycle, and at lower levels than recent ANZ and NAB results. WA mortgage loans have higher mortgage arrears.

The balance sheet is strong on all the critical ratios. They are “essentially done” they say.

Cash earnings per share is up 2% to 239.7 cents and the cash return on equity is 13.8%. There was no change to the dividend.

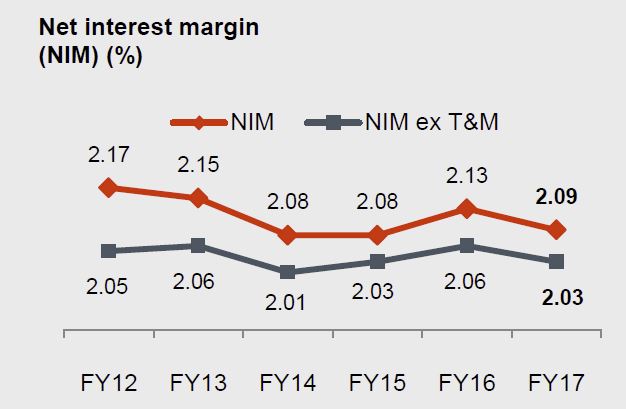
Net interest margin was 2.09%, 4 basis points lower, compared with FY16, reflecting higher wholesale funding costs, bank levy and some asset repricing. The bank levy cost $95m pretax, or 2 basis points, or 2 cents per share.

Margin improved in the second half, thanks to loan repricing and improved wholesale funding. Mortgage repricing contributed 7 basis points in 2H17.

The cost of refunding customers who were entitled to certain product discounts, but may not have been aware that they needed to specifically request them was $118 million this year, equivalent to 1.5% of earnings. This is a one-off hit.

Non-interest income was down 9%, with $209m fall in trading income and $97 million in fees and commissions.

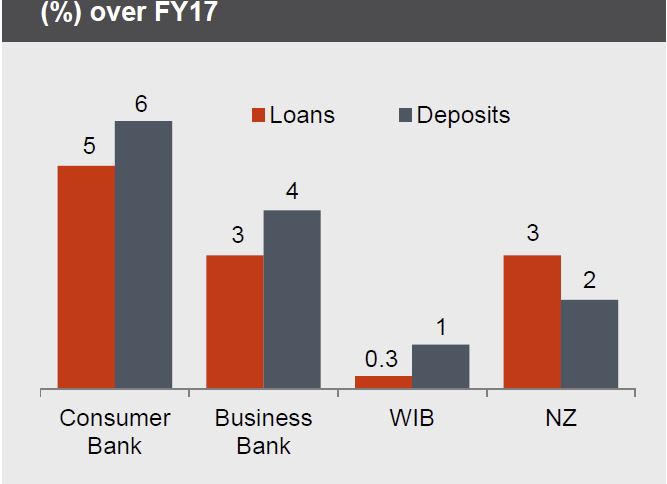
Growth in the consumer bank (mainly mortgages) was the strongest.

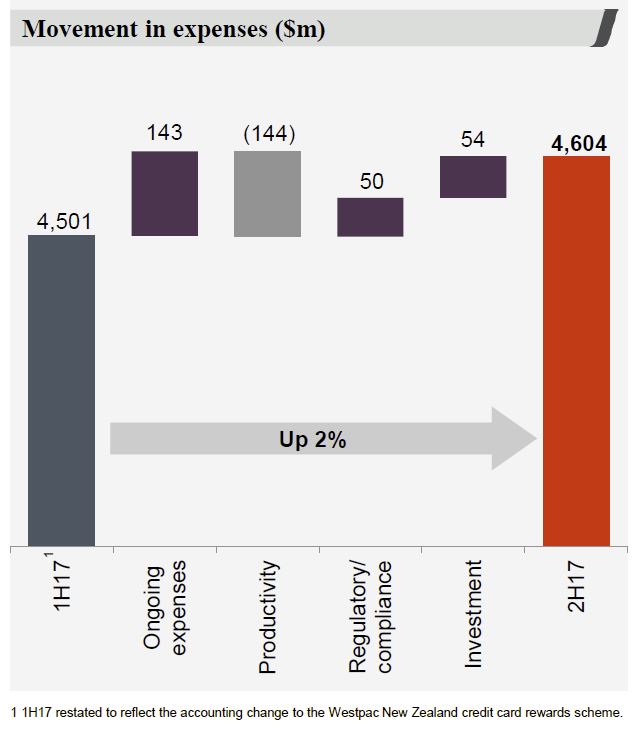
Costs were up 2% to $4,604 million, and the expense ratio 42%, including productivity savings of $262 million. They still want to get below 40%, eventually. Compliance costs rose.

Total provisions fell from $3.6 billion in 2016 to $3.1 billion in FY17.

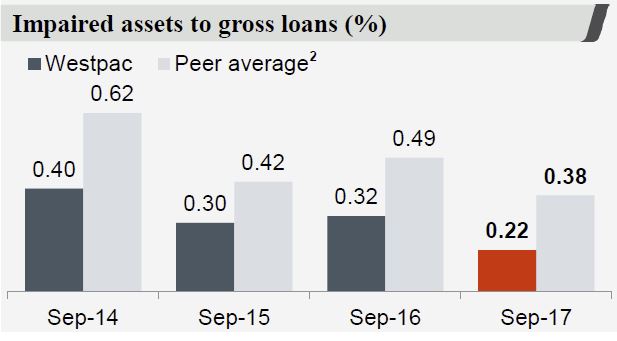
Impaired assets to gross loans were down 10 basis points to 0.22%. Their impairment charge was was down 24% over the year to $853 million, which equates to 13 basis points, down 4 basis points on last year.

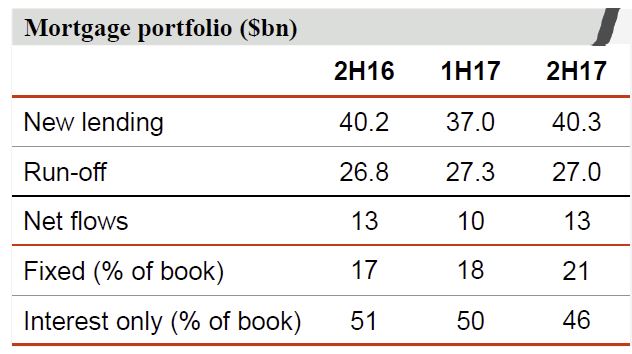
Westpac is a significant property aligned bank with 62% of the loan book related to Australian mortgage lending, which showed strong growth, with net flows of $13 billion in 2H17. There were more fixed rate loans, and less interest only loans. The value of the book was up 3% in the 2H17, to $427.2 billion.  Mortgage offset balances are $38.1 billion.  Commercial property lending is 6.48% of total lending, or $49.6 billion. So overall property exposure is close to 70% of the bank! $6.9 billion are in the residential apartment sector. Inner city consumer mortgages for apartments is $14.1 billion.

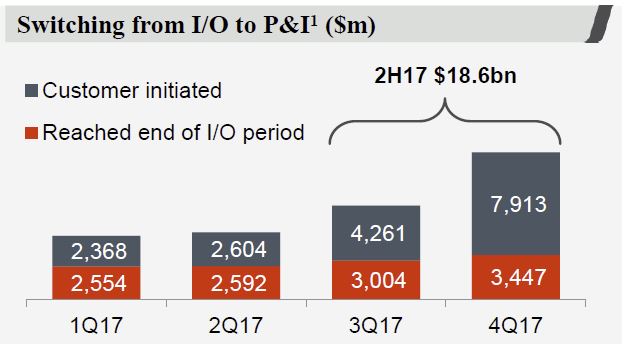
They reported $18.6bn of switching from IO to P&I mortgages in 2H17.

Investor loans lending is growing and is 46.8% of flow, and 39.8% of the portfolio. Around 54% of mortgage flows are via proprietary channels, while the portfolio sits at 57%. So broker flows have lifted to 46%.

WA delinquencies remain higher than other states, but are falling slightly. Westpac says they think delinquencies in WA have peaked.

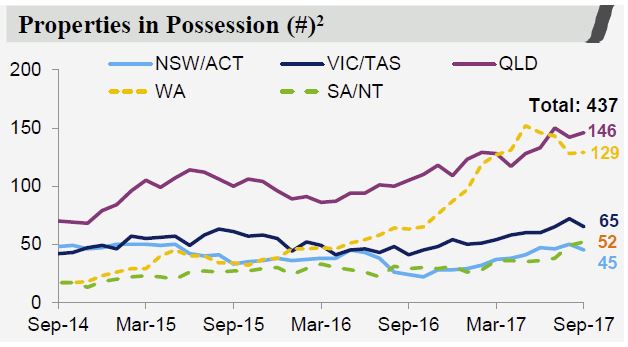
There are more properties in possession in QLD than WA, mostly in regional mining areas.

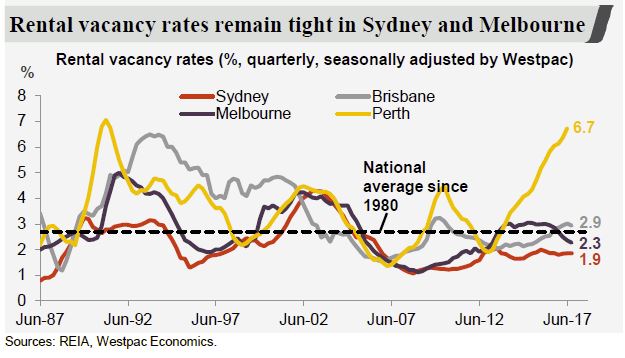
This data on vacancy rates highlights the issue with investment property in WA!

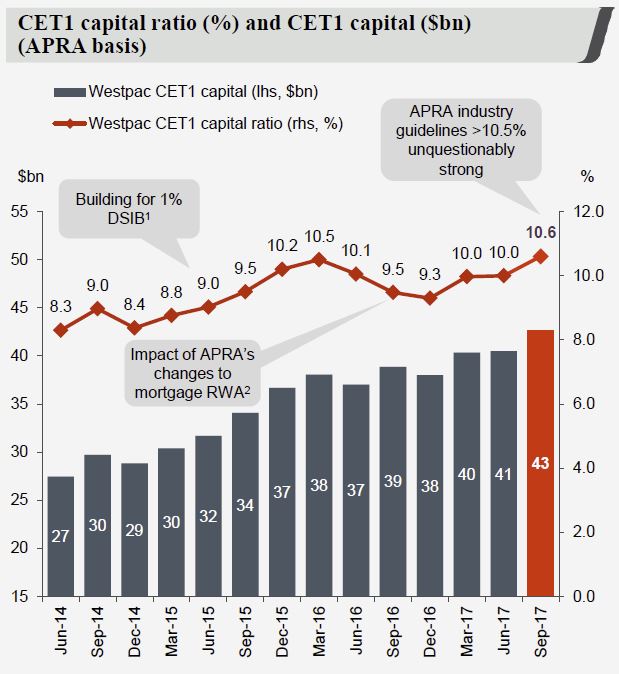
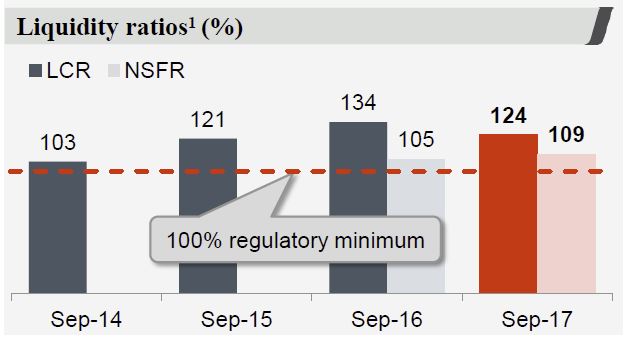
The CET1 ratio is 10.6%, above the APRA target.

In FY18, they expect lower lending growth (but they think mortgages will still grow), margin will be impacted by more mortgage switching from interest only to principal & interest and there will be a $50m headwind from ATM and transaction fees. They will target cost savings of 2-3% and await the final APRA guidance on capital weights and mortgages.

Mapping The Mortgage Stressed Households In Greater Adelaide

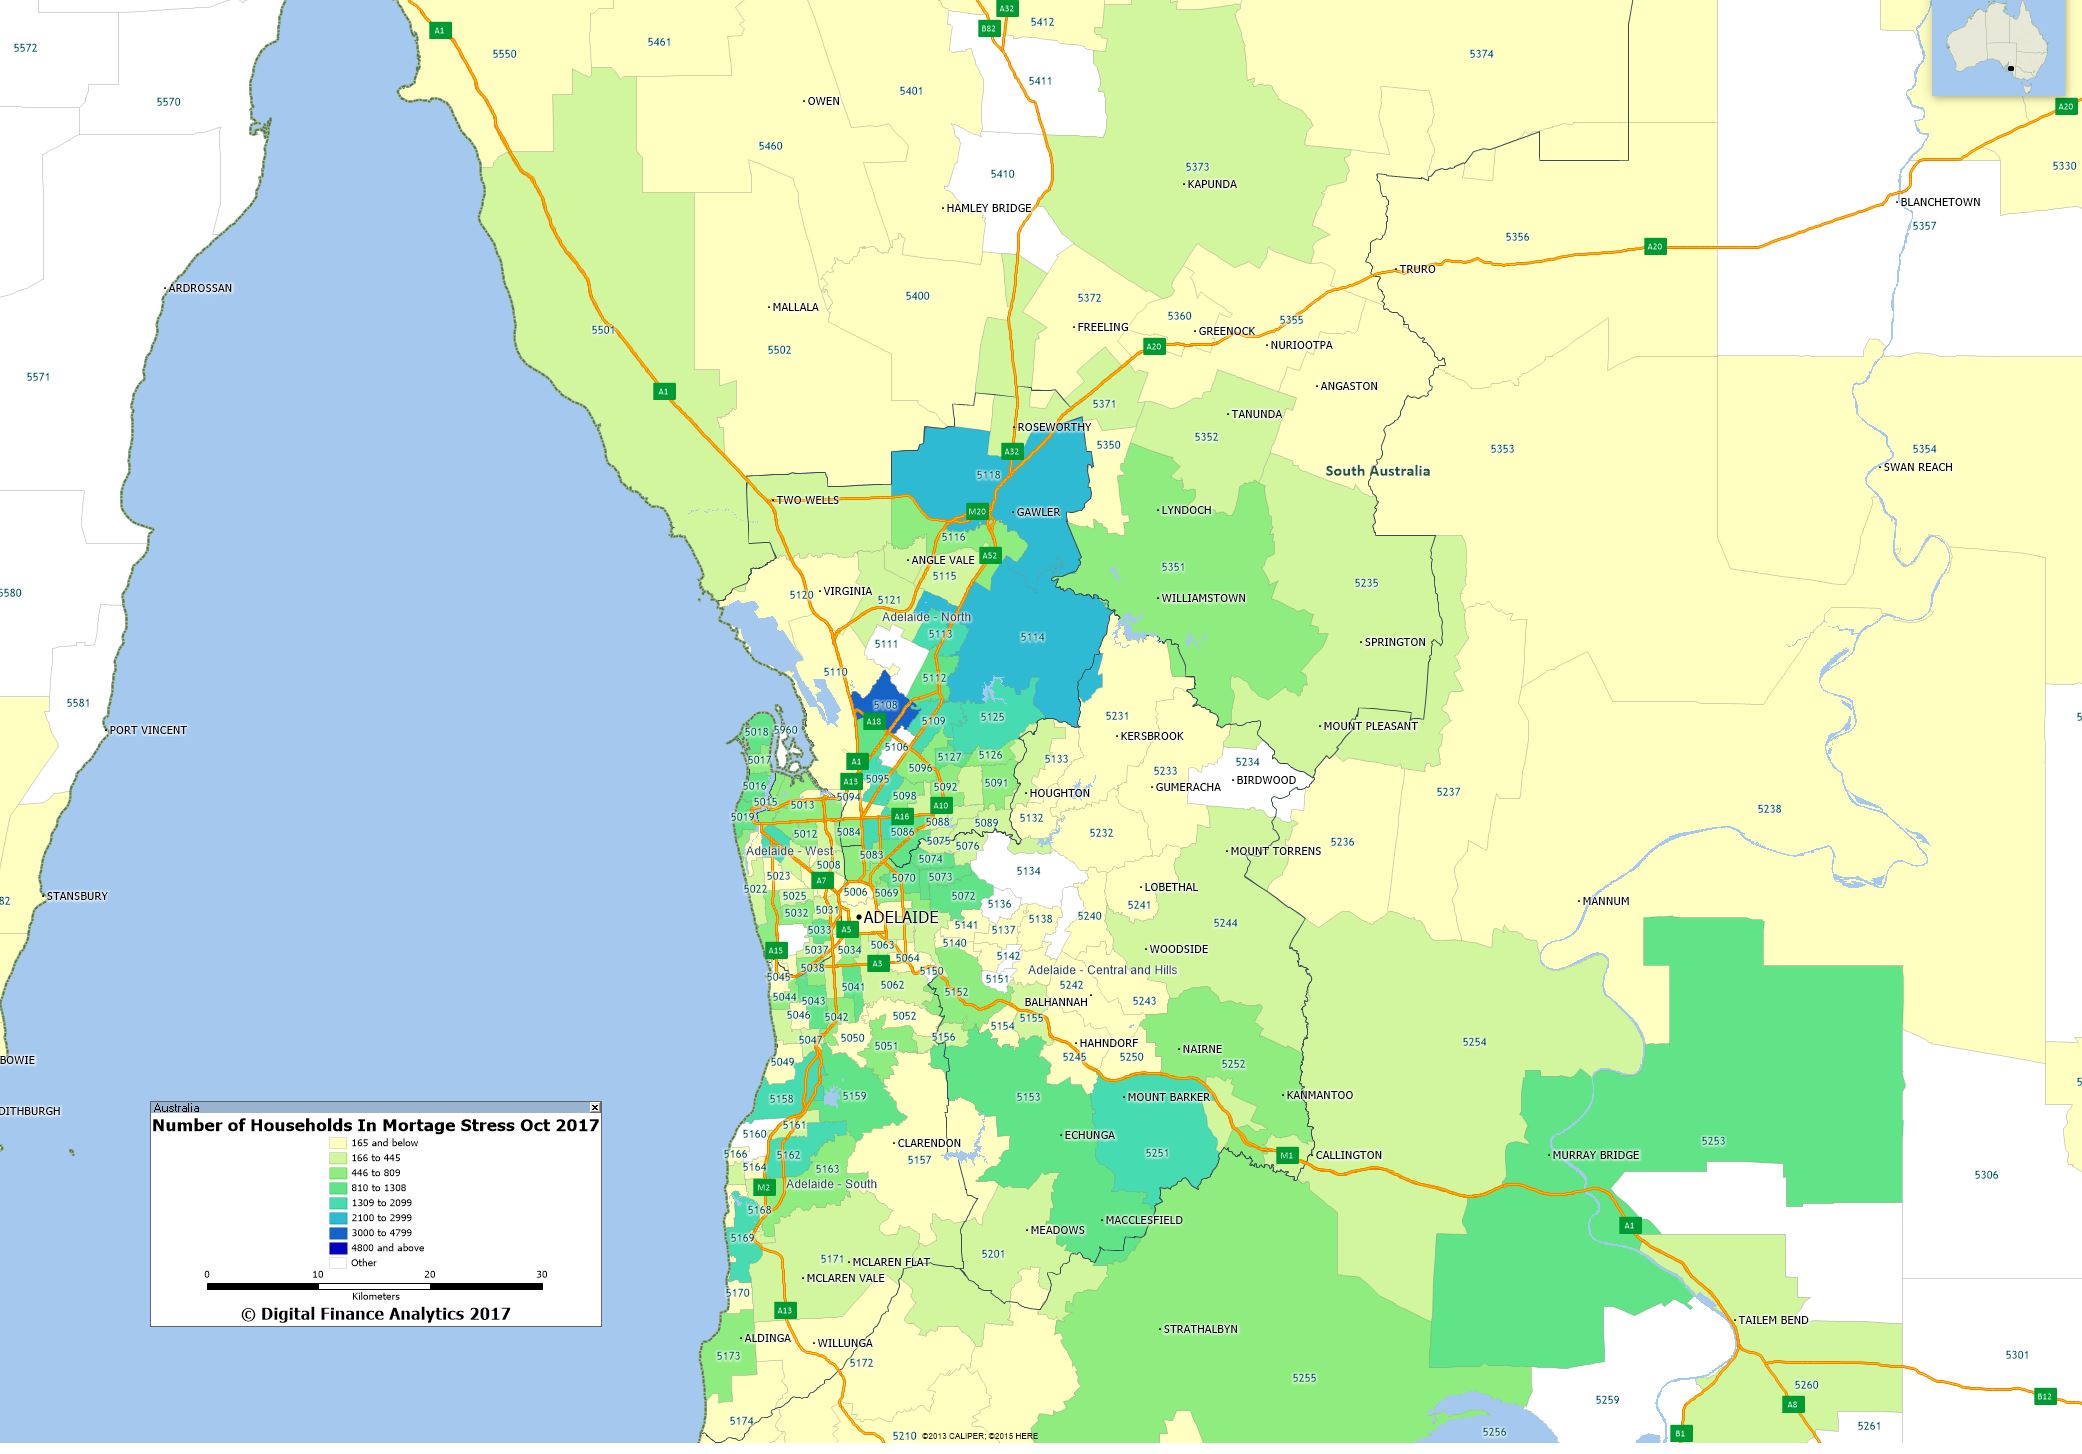
Following our October 2017 Mortgage Stress update, here is a map of the count of households in mortgage stress in Greater Adelaide, using our Core Market Model.

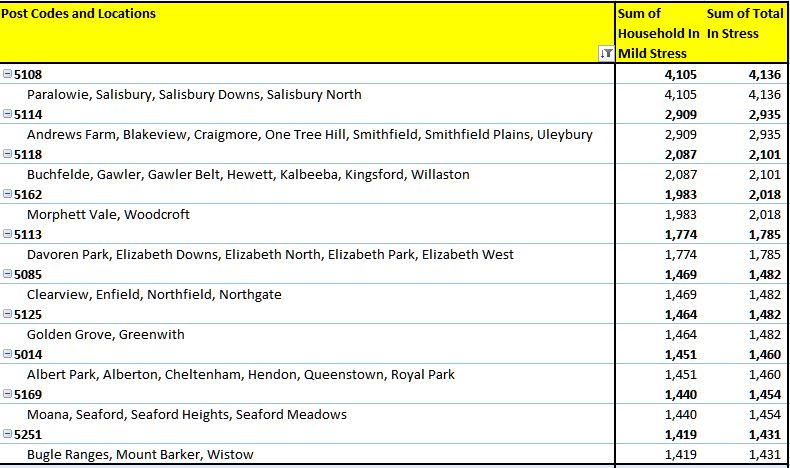
Here is a list of the top 10 most stressed post codes in SA, by the number of households in stress.

Mapping The Mortgage Stressed Households In Greater Perth

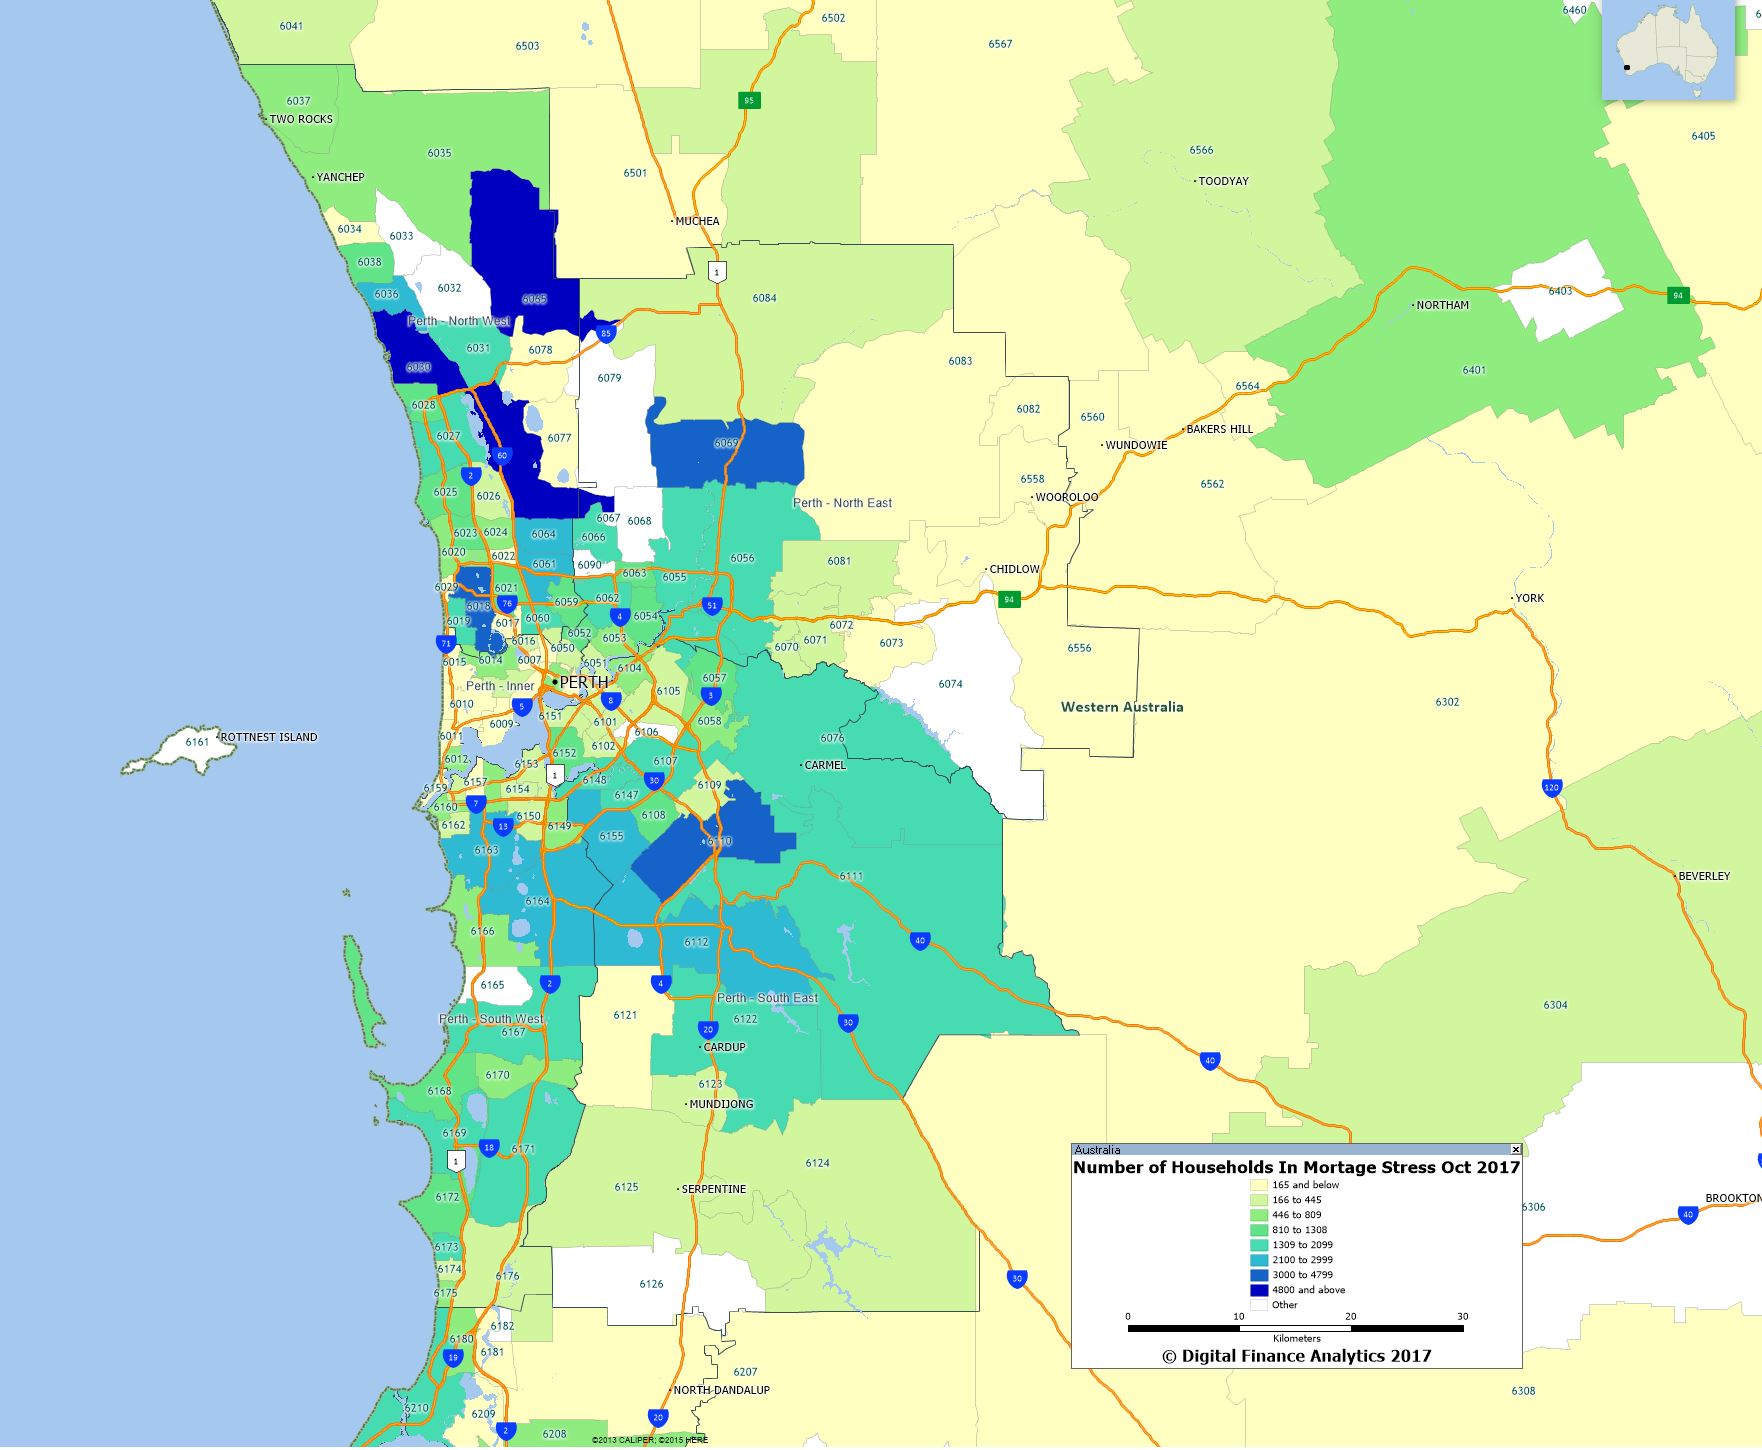
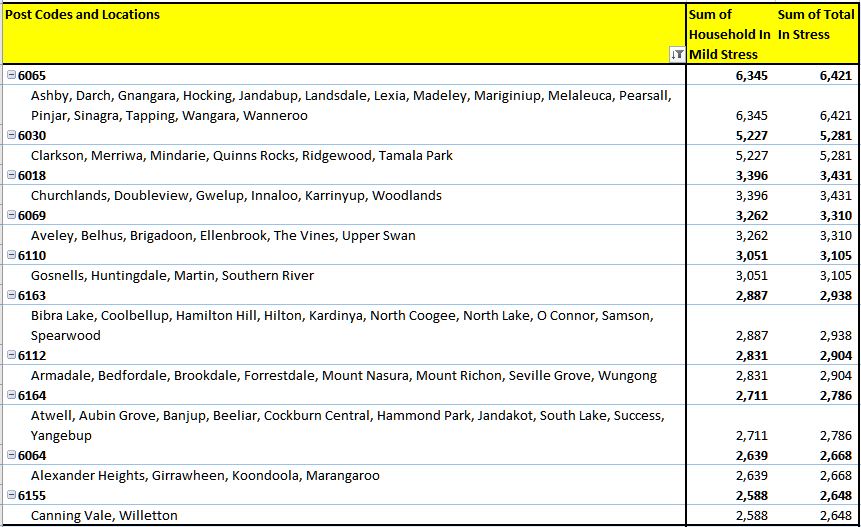
Following our October 2017 Mortgage Stress update, here is a map of the count of households in mortgage stress in Greater Perth, using our Core Market Model.

Here is a list of the top 10 most stressed post codes in the WA, by the number of households in stress.

We will post similar maps and lists across the other states shortly.