Genworth 3Q Update Highlights Regional Risks

Lender Mortgage Insurer, Genworth a bellwether for the broader mortgage industry,  has reported statutory net profit after tax of $32.1 million and underlying NPAT of $40.5 million for the third quarter ended 30 September 2017.

While the volume of new business written was down 9.8% on 3Q16 to $5.5 bn, the gross written premium was down only 3.9% to $88.6 million. Underlying NPAT was down 14.5% to $40.5 million.

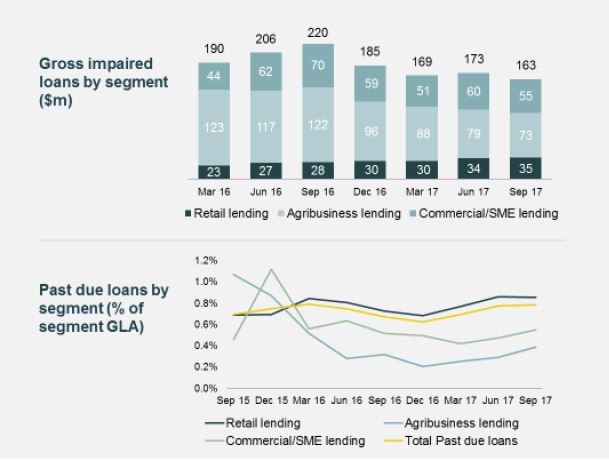
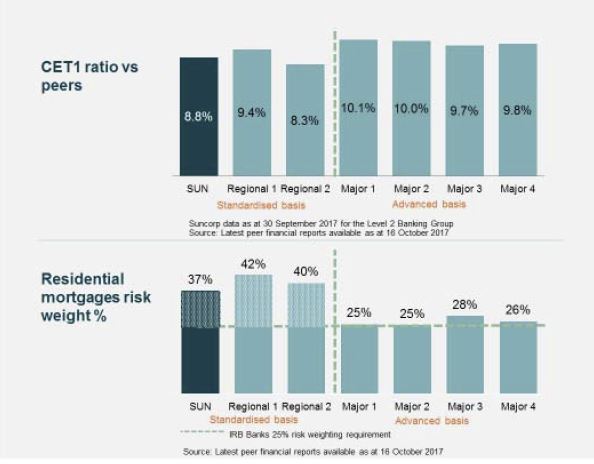
The total portfolio of delinquencies rose 4.4% to 7,146, and the loss rate overall was 3 basis points. The regional variations are stark.

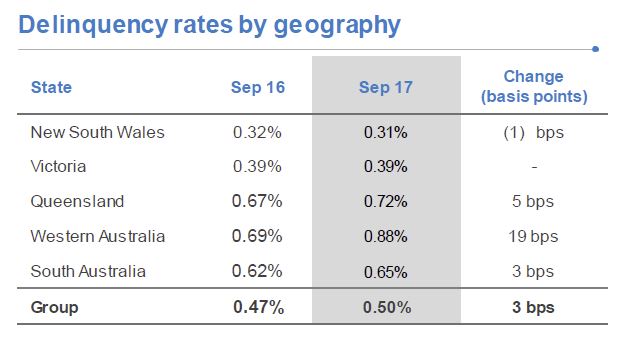
The loss ratio however fell, 8.3 pts to 37%, thanks to (DFA suggests) equity linked to rising home prices. New South Wales and Victoria continue to perform strongly. However, the performance in Queensland and Western Australia remains challenging and delinquencies are elevated due to the slowdown in those regional and metropolitan areas that have previously benefited from the growth in the resources sector.

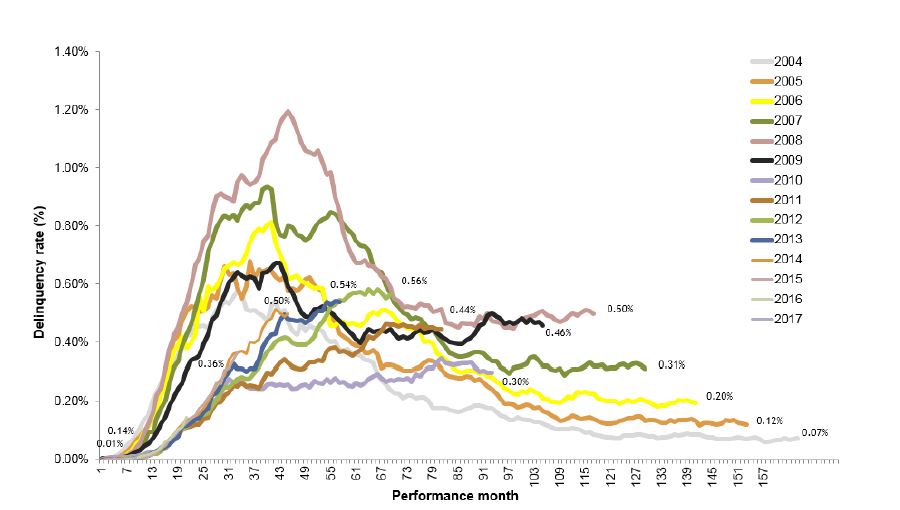
The 2008 book year was affected by the economic downturn experienced across Australia and heightened stress among self-employed borrowers, particularly in Queensland, which was exacerbated by the floods 2011. Post PostPost-GFC book years seasoning at lower levels as a result of credit tightening. Underperformance for 2012-14 books have been predominantly driven by resource reliant states of QLD and WA following the mining sector downturn however has started to show signs of stabilising over recent months.

There is considerable variation in economic activity across the country with continued growth in New South Wales and Victoria offset by weaker activity in Queensland and, in particular, Western Australia.

Investment income of $15.6 million in 3Q17 included a pre-tax mark-to-market unrealised loss of $12.0 million ($8.4 million after-tax). As at 30 September 2017, the value of Genworth’s investment portfolio was $3.4 billion, 89 per cent of which continues to be held in cash and highly rated fixed interest securities.

As at 30 September 2017, the Company had invested $214 million in Australian equities in line with the previously stated strategy to improve investment returns on the portfolio within acceptable risk tolerances. After adjusting for the mark-to-market movements, the 3Q17 investment return was 2.88 per cent per annum, down from 3.51 per cent per annum in 3Q16.

The Company has completed the on-market share buy-back to a value of $45 million and intends to continue the buy-back for shares up to a maximum total value of $100 million, subject to business and market conditions, the prevailing share price, market volumes and other considerations.

Genworth previously advised that its customer, the National Australia Bank Limited, extended its Supply and Service Contract for the provision of Lenders Mortgage Insurance (LMI) for NAB’s broker business. The term of the contract has been extended by one year to 20 November 2018.

Genworth expects 2017 NEP to decline by approximately 10 to 15 per cent. The full year loss ratio guidance has been updated to be between 35 and 40 per cent (based on the current premium earning pattern). Any change to the premium earning pattern may result in a change to these expectations

Australian Fintech Environment On The Up

The EY FinTech Australian Census 2017 has been released. Around 600 Fintechs are operating in Australia, the number has grown quite fast. More are generating revenue, and some are profitable. Australia is ranked 5th on their global analysis.

EY was commissioned by FinTech Australia to conduct a census of fintechs in Australia over the last two years. A broad research program was set in place in collaboration with a FinTech Australia steering committee. The research was conducted between August and September, 2017.

This report presents the key findings based on 166 quantitative online surveys, 10 in-depth interviews and 16 vox-pop style interviews.

They conclude that around 600 Fintechs are operating in Australia, having more than doubled since 2015.  A greater proportion of fintechs have been in business for more than three years. 71% of businesses are now generating revenue.  What falls under the ‘fintech’ banner is now much broader (think RegTech, cyber/digital security, Data Analytics etc.) and firms that would see themselves as ‘fintech’ are stretching far and wide into other tech industries (e.g. Agtech, etc.)

The findings show that 45% are targetting retail consumers, 43% targetting banks and other FSI’s and 35% targetting SME’s or other start-ups.

Wealth management was the largest industry segment at 30%, followed by lending at 20%, then analytics 18%.

The largest number are based in NSW (54%).

Funding remains a challenge, and private funding dominates.

In 2016, most fintechs in Australia have received some private funding (72%). Six in ten (57%) accessed some commercial funding and on average have raised $4.2m in capital; this is greater than the average amount of $2.2m raised by fintechs that exclusively accessed private funding.

One in seven fintechs stated that they are currently profitable. Of those that have not started to realise profit, their current burn rate is on average $115k a month. This is an increase in what was seen last year where the burn rate was $84k month.

Australia ranked 5th with a 37% adoption rating. While in the shadows of the quite different markets of China (69%) and India (52%), Australia is on par with other developed economies with similar financial systems (e.g. US and UK).

The growth rate in Australia is one of the fastest.

Can Gradual Interest-Rate Tightening Prevent a Bust?

From The Mises Institute.

The boom brought about by the banks’ policy of extending credit must necessarily end sooner or later. Unless they are willing to let their policy completely destroy the monetary and credit system, the banks themselves must cut it short before the catastrophe occurs. The longer the period of credit expansion and the longer the banks delay in changing their policy, the worse will be the consequences of the malinvestments and of the inordinate speculation characterizing the boom; and as a result the longer will be the period of depression and the more uncertain the date of recovery and return to normal economic activity

Fed policy makers are of the view that if there is the need to tighten the interest rate stance the tightening should be gradual as to not destabilize the economy.

The gradual approach gives individuals plenty of time to adjust to the tighter monetary stance. This adjustment in turn will neutralize the possible harmful effect that such a tighter stance may have on the economy.

But is it possible by means of a gradual monetary policy to undo the damage inflicted to the economy by previous loose monetary policies? According to mainstream economic thinking, it would appear that this is the case.

In his various writings, the champion of the monetarist school of thinking, Milton Friedman, has argued that there is a variable lag between changes in money supply and its effect on real output and prices. Friedman holds that in the short run changes in money supply will be followed by changes in real output. In the long run, according to Friedman, changes in money will only have an effect on prices.

It follows then that changes in money with respect to real economic activity tend to be neutral in the long run and non-neutral in the short run. Thus according to Friedman,

In the short-run, which may be as much as five or ten years, monetary changes affect primarily output. Over decades, on the other hand, the rate of monetary growth affects primarily prices.1

According to Friedman, the effect of the change in money supply shows up first in output and hardly at all in prices. It is only after a longer time lag that changes in money start to have an effect on prices. This is the reason, according to Friedman, why in the short run money can grow the economy, while in the long run it has no effect on the real output.

According to Friedman, the main reason for the non-neutrality of money in the short run is the variability in the time lag between money and the economy. Consequently, he believes that if the central bank were to follow a constant money rate of growth rule this would eliminate fluctuations caused by variable changes in the money supply rate of growth. The constant money growth rule could also make money neutral in the short run and the only effect that money would have is on general prices.

Thus according to Friedman,

On the average, there is a close relation between changes in the quantity of money and the subsequent course of national income. But economic policy must deal with the individual case, not the average. In any case, there is much slippage. It is precisely this leeway, this looseness in the relation, this lack of mechanical one-to-one correspondence between changes in money and in income that is the primary reason why I have long favoured for the USA a quasi-automatic monetary policy under which the quantity of money would grow at a steady rate of 4 or 5 per cent per year, month-in, month-out.2

In his Nobel lecture, Robert Lucas raised an issue with this. According to Lucas,

If everyone understands that prices will ultimately increase in proportion to the increase in money, what force stops this from happening right away?3

Consequently, Lucas has suggested that the reason why money does generate a real effect in the short run is not so much due to the variability of monetary time lags but more bound up with whether money changes were anticipated or not. If monetary growth anticipated, then people will adjust to it rather quickly and there will not be any real effect on the economy. Only unanticipated monetary expansion can stimulate production.

Moreover, according to Lucas,

Unanticipated monetary expansions, on the other hand, can stimulate production as, symmetrically, unanticipated contractions can induce depression.4

Both Friedman and Lucas are of the view, although for slightly different reasons, that it is desirable to make money neutral in order to avoid unstable and therefore unsustainable economic growth.

The current practice of Fed policy makers seems to incorporate the ideas of Friedman and Lucas into the so-called transparent monetary policy framework. This framework accepts Lucas’s view that anticipated monetary policy could lead to stable economic growth. This framework also accepts that a gradual change in monetary policy in the spirit of Friedman’s constant money growth rule could reinforce the transparency.

If unexpected monetary policies can cause real economic growth, what is wrong with this? Why not constantly surprise people and cause more real wealth?

Money, Expectations and Economic Growth

What is required for economic growth is a growing pool of real savings, which funds various individuals that are engaged in the build-up of capital goods. An increase in money, however, has nothing to do, as such, with this. On the contrary this increase only leads to consumption that is not supported by production of real wealth. Consequently, this leads to a weakening in the real pool of savings, which in turn undermines real economic growth. All that printing money can achieve is a redirection of real savings from wealth generating activities towards non-productive wealth consuming activities. So obviously, there cannot be any economic growth because of this redirection.

Now if unanticipated monetary growth undermines real economic growth via the dilution of the pool of real savings why is it then that one observes that rising money is associated with a rise in economic indicators like real GDP?

We suggest that all that we observe in reality is an increase in monetary spending — this is what GDP depicts. The more money that is printed, the higher GDP will be. So-called real GDP is merely nominal GDP deflated by a meaningless price index. Hence, so-called observed economic growth is just the reflection of monetary expansion and has nothing to do with real economic growth. Incidentally, real economic growth cannot be measured as such — it is not possible to establish a meaningful total by adding potatoes and tomatoes.

While unanticipated monetary growth cannot grow the economy, it definitely produces a real effect by undermining the pool of real savings and thereby weakening the real economy.

Likewise anticipated money growth cannot be harmless to the real economy. Even if the money rate of growth is fully anticipated there is always someone who gets it first. Consequently, also anticipated money growth rate will set in motion an exchange of nothing for something.

For instance, consider the individual who fully expects the future course of monetary policy. This individual now decides to borrow $1000 from a bank. The bank obliges and lends him the $1000, which the bank has created out of “thin air”. Now, since this money is unbacked by any previous production of real wealth it will set in motion an exchange of nothing for something, or a redirection of real savings from wealth generators towards the borrower of the newly created $1000. This redirection and hence real negative effect on the pool of savings cannot be prevented by an individuals’ correct expectation of monetary policies.

Even if the money is pumped in such a way that everybody gets it instantaneously, changes in the demand for money will vary. After all, every individual is different from other individuals. There will always be somebody who will spend the newly received money before somebody else. This of course will lead to the redirection of real wealth to the first spender from the last spender.

We can thus conclude that regardless of expectations, loose monetary policy will always undermine the foundations of the real economy while tight monetary policy will work to arrest this process. Hence monetary policy can never be neutral.

Can a Gradual Tightening Prevent an Economic Bust?

Since monetary growth, whether expected or unexpected, gives rise to the redirection of real savings it means that any monetary tightening slows down this redirection. Various economic activities, which sprang-up on the back of strong monetary pumping, because of a tighter monetary stance get now less real funding. This in turn means that these activities are given less support and run the risk of being liquidated. It is the liquidation of these activities what an economic bust is all about.

Obviously, then, the tighter monetary stance by the Fed must put pressure on various false activities, or various artificial forms of life. Hence, the tighter the Fed gets the slower the pace of redirection of real savings will be, which in turn means that more liquidation of various false activities will take place. In the words of Ludwig von Mises,

The boom brought about by the banks’ policy of extending credit must necessarily end sooner or later. Unless they are willing to let their policy completely destroy the monetary and credit system, the banks themselves must cut it short before the catastrophe occurs. The longer the period of credit expansion and the longer the banks delay in changing their policy, the worse will be the consequences of the malinvestments and of the inordinate speculation characterizing the boom; and as a result the longer will be the period of depression and the more uncertain the date of recovery and return to normal economic activity.5

Consequently, the view that the Fed can lift interest rates without any disruption doesn’t hold water. Obviously if the pool of real savings is still expanding then this may mitigate the severity of the bust. However, given the reckless monetary policies of the US central bank it is quite likely that the US economy may already has a stagnant or perhaps a declining pool of real savings. This in turn runs the risk of the US economy falling into a severe economic slump.

We can thus conclude that the popular view that gradual transparent monetary policies will allow the Fed to tighten its stance without any disruptions is based on erroneous ideas. There is no such thing as a “shock-free” monetary policy any more than a monetary expansion can ever be truly neutral to the market.

Regardless of policy transparency once a tighter monetary stance is introduced, it sets in motion an economic bust. The severity of the bust is conditioned by the length and magnitude of the previous loose monetary stance and the state of the pool of real savings.


1. Milton Friedman The Counter-Revolution in Monetary Theory. Occasional Paper 33, Institute of Economic Affairs for the Wincott Foundation. London: Tonbridge, 1970.

2. Milton Friedman The Counter-Revolution in Monetary Theory

3. Robert E. Lucas, Jr Nobel Lecture:Monetary Neutrality, Journal of Political Economy, 1996, vol. 104,no. 4

4. Ibid.

5. Ludwig von Mises, The “Austrian” Theory of the Trade Cycle. The Ludwig von Mises Institute 1983.


Bank of England Lifts Cash Rate

From the UK Office For National Statistics.

Concerns about “inflation over target” and “limited” slack in the economy have prompted the Bank of England to raise interest rates for the first time in more than a decade.

On 2 November 2017, the Bank’s Monetary Policy Committee (MPC) voted 7-2 in favour of raising the interest rate to 0.5%, from a record low of 0.25%.

The majority of the MPC agreed that now was the right time to raise interest rates “to return inflation sustainably to the target”.

But the Committee acknowledged that “uncertainties associated with Brexit are weighing on domestic activity”. Some economists, including former MPC member David Blanchflower, had warned against an interest rate rise.

After rising to 5.75% in July 2007, the Bank of England base rate was subsequently cut nine times in the next two years as the financial crisis took effect.

It reached a record low of 0.5% in March 2009 and remained at that level, partly because of the long-lasting impact of the crisis, before dropping again to 0.25% in August 2016.

What’s changed since the last interest rate rise?

The last time we saw a rise in the interest rate was 5 July 2007. To put that into context, Tony Blair had recently resigned as Prime Minister and the first iPhone had just been released.

On that day, the Bank voted for a higher interest rate against a backdrop of a “strong global economy”. The rate had risen twice that year already and there was little sign of the impending financial crisis.

But between the last interest rate rise and today, the MPC had met 118 times and decided against raising interest rates on every occasion.

When setting interest rates, the MPC considers many factors including debt, savings, inflation, economic growth, employment and wages. They’ll also look at conditions in economies and financial markets worldwide.

Consumer credit rose by 4.6% compared with the previous year in May 2007, less than half as fast as September 2017 (9.9%). People are increasingly borrowing to finance their purchase of a new car. The Bank estimates that growth of dealership car finance accounts for three-quarters of growth in the total stock of consumer credit since 2012.

Raising the interest rate is expected to increase the size of repayments on loans, and could therefore lead to a reduction in the amount of borrowing.

Households saved 5.4% of their disposable income in April to June this year, compared with 8.8% in the first three months of 2007.
The interest rate dictates your earnings on money saved. Savers, who outnumber borrowers, could get a higher return thanks to today’s rise.

The economy took much longer to recover from this recession compared with previous ones, which kept interest rates low

Previous recessions, number of quarters taken for GDP to reach pre-recession level

But the general downward trend in interest rates goes back further than the last decade. Less than 30 years ago, the base rate was close to 15%.

The interest rate has fallen substantially in the last 30 years

Bank of England base rate, 1975 to 2017

Despite today’s rise, we’re unlikely to see a substantial reversal to that trend – Mr Carney has said that any increases to the rate will be “gradual” and “limited”.

The US economy is outpacing Australia’s

From The Conversation.

Data this week pointed to a continued shakiness in the Australian economy, while the robust US recovery continued.

In Australia, private-sector lending grew at just 0.3%, compared to 0.5% in August. Perhaps more worryingly, business lending dropped 0.1%. It was, again, housing credit growth that propped up the overall figures, growing 0.5% for the month.

Worse still, new home sales fell 6.1% in September, compared to August, according to the Housing Industry Association. So Australians aren’t borrowing much, except to finance the swapping around of each other’s houses at higher and higher prices. Note to picky readers: yes, prices fell a tiny bit in Sydney last month (0.1%), but are still up 10.5% year-on-year.

The US labour market bounced back from the hurricane season, adding 235,000 private sector jobs, according to data from payroll provider ADP. This wasn’t merely a bounce back — it exceeded expectations of a 200,000 gain. This was the biggest gain since March and further evidence of the strong US recovery.

It was not surprising, then, that Conference Board figures showed strong consumer confidence. What was striking, however, was just how strong those figures were. The confidence index rose to 5.3 points to 125.9 – the highest since December 2000. The present conditions measure was also at its highest level since 2001.

The US Federal Reserve kept interest rates on hold at a band of 1.0-1.25% at this week’s meeting, but signalled a fairly high likelihood of a rate rise when they meet in December. As the statement put it:

The Committee expects that economic conditions will evolve in a manner that will warrant gradual increases in the federal funds rate.

Perhaps the only real wrinkle is that inflation remains stubbornly low, despite unemployment being at 4.2%. Some measures of inflation expectations are rising, so the best bet is for a 25 basis point rise in December.

The Fed’s statement made pretty explicit how they think about balance these factors, stating:

the Committee continues to expect that, with gradual adjustments in the stance of monetary policy, economic activity will expand at a moderate pace, and labor market conditions will strengthen somewhat further. Inflation on a 12-month basis is expected to remain somewhat below 2 percent in the near term but to stabilize around the Committee’s 2 percent objective over the medium term.

Of course, current Fed Chair Janet Yellen’s term concludes in February next year, and it is being widely reported that President Trump will not reappoint her. Rather he seems set (to the extent that is possible with him) to appoint Jay Powell as Chair.

I will have more to say about that in future columns, but the main thing to note here is that Powell is extremely likely to continue with the path of monetary policy that Yellen has laid out.

So why is it that the US – which suffered a major downturn – seems to have a stronger economy than Australia – which did not even go into recession in 2008-09?

One view is that the US went through a process of Schumpetarian “creative desctruction”. Homeowners who couldn’t afford their properties got foreclosed on, investment banks that weren’t viable went bust, and the rest of the financial system was recapitalised.

Australian banks, by contrast have made some progress in getting their funding structure to be less short-term and dependent on US capital markets – but only so much. And it seems quite possible that they continue to make questionable loans – particularly interest-only loans – as I wrote about here, and spoke about here.

A second view is that the US economy is better able to adapt to the changing nature of the modern economy. It has much more flexible labour markets – although much harsher and less rewarding for average workers.

Perhaps it is neither of these, but presumably both the Reserve Bank and Treasury are trying to understand what looks like a striking different between the US and Australian experiences.

Author: Richard Holden, Professor of Economics and PLuS Alliance Fellow, UNSW

The Problem of Business Investment

John Fraser, Secretary to the Treasury spoke about Australia’s Business Investment Challenge in his Sir Leslie Melville Lecture.

The bottom line is as the mining investment boom ended, Australia has struggled with weak investment in the non-mining sectors, weighing on the labour market, productivity and ultimately economic growth.

Governments to pursue coordinated reforms that provide businesses with certainty, promote innovation and productivity improvements and support the ongoing transformation of the economy.

But there are no silver bullets!

One thing we know will be vital to our economic prosperity going forward is business investment.

Investment in new productive capacity creates employment opportunities, raises future incomes and supports innovation.

Recent Treasury research indicates that Australia has generally been more reliant on capital deepening than multifactor productivity growth to fuel its aggregate labour productivity growth.

This research is publicly available on the Treasury Research Institute website.

We are doing far more research in Treasury but some necessarily must remain confidential.

Productivity-enhancing policies are vital because of the link between productivity gains and real wage increases.

We know that higher productivity is the best way to increase real wages across the economy and, based on Treasury’s recent analysis of longitudinal business data, it is clear that average real wages are higher for businesses with higher labour productivity.

Both capital deepening and multifactor productivity will be important to support further growth in labour productivity – so business investment is critical to our economic prosperity.

Recent trends

Over the past decade, Australia’s experience with business investment has played out in two starkly different stages.

Chart 1 – This chart shows the unprecedented investment boom to build new supply capacity in the mining sector in response to strong demand for resources and higher commodity prices.

Chart 1: Business investment

Such was the strength of the mining boom that total business investment increased as a per cent of GDP noticeably over this period.

This was one important factor in our economy’s resilience through the GFC, supporting jobs in a whole range of industries and seeing benefits flow on to wages and capital returns throughout the economy.

Of course, it is hard to know precisely why our economy fared so well during the GFC.

The flexibility of the economy, prudent monetary policy and a sound financial system – as well as demand from China – all played their part but it is difficult to single out any individual factor.

While mining investment declined for a time during the GFC, the demand for our resources was such that mining investment increased through to its peak in 2012-13, helping to counteract the global tide of recession through that period.

Since then, mining investment has rapidly receded.

Crucially, business investment outside of the mining sector did not take up the slack as the trend in mining investment reversed.

The share of non-mining business investment as a per cent of GDP began to fall following the GFC, and in recent years has fallen to around its lowest share of GDP in the past 50 years.

In 2016‑17, non-mining business investment was around 9 per cent of GDP.

As is clear from the chart, this is between 2 and 2 ½ percentage points of GDP below the long run average prior to the GFC – so there remains a gap that we would hope non-mining investment could fill.

In an environment of low interest rates and generally positive economic developments the extent of the weakness in non-mining investment was somewhat perplexing.

Australia has not been alone in facing this challenge.

In meetings with my counterparts from the New Zealand, Canada, UK and Ireland Treasuries over recent years weak business investment has been one of the key concerns discussed.

Mortgage stress soars to record highs as borrowers struggle with jumbo loans

From The Australian Financial Review.

The number of Australian families facing mortgage distress has soared by nearly 20 per cent in the past six months to more than 900,000 and is on track to top 1 million by next year, according to new analysis of lending repayments and household incomes.

That means net incomes are not covering ongoing costs in nearly 30 per cent of the nation’s households, up from about 25 per cent in May, the analysis by Digital Finance Analytics, an independent commentator, shows.

Stagnant incomes, rising costs, unemployment, the likelihood that rates are more likely to rise than fall mean the number of families struggling to make ends meet is expected to continue increasing, the analysis shows.

Lenders’ recent attempts to build market share by lowering underwriting standards is also expected to begin appearing in the numbers as households struggle to repay jumbo loans, it shows.

“Risks in the system will continue to rise,” Martin North, DFA principal, said. “The numbers of households impacted are economically significant,” “Mortgage lending is still growing at three times income. This is not sustainable.”

Brendan Coates, a fellow at the Grattan Institute, a public policy think tank, said: “Even a relatively small rise in the interest rates paid by households would crimp their spending.

“If interest rates increase by 2 percentage points,  mortgage payments on a new home will be less affordable than at any time in living memory, apart from a brief period around 1989 — an experience that scarred a generation of home-owners.”

Nearly 22,000 households, of which 11,000 are professionals or young affluent, are facing severe distress, which means they are unable to meet mortgage repayments from current income and are having to manage by cutting back spending, putting more on credit cards, refinance, or sell their home.

About 52,000 households risk 30-day default in the next 12 months, up 3000 from the previous month. A lender, or creditor, can issue a default notice to a borrower behind on debt.

Bank portfolio losses are expected to be around 3 basis points, rising to about 5 basis points in Western Australia.

Mr Coates said: “Growing household debt has made the Australian economy more vulnerable. But the debt situation is not as worrying as the aggregate figures suggest.

“Most debt is held by higher income households and Reserve Bank research shows that relatively few households have high loans-to-total-assets ratios.

“Stagnating house prices — still the most likely scenario over the next couple of years — wouldn’t be enough to significantly trouble the banks.”

Rather than a banking crisis, higher debts could cause a  rapid fall in household spending in the event of a downturn, he said.

“Household consumption accounts for well over half of gross domestic product. Recent Reserve Bank of Australia research shows that households with higher debts are more likely to reduce spending if their incomes fall,” he said.

Economists generally argue mortgage stress, stagnant income growth and low inflation  mean the Reserve Bank will be unlikely to raise interest rates any time soon.

But that could change if there was another disruption to international financial markets, such as the 2008 shock, which sharply increased banks’ funding costs and raised mortgage rates.

COBA welcomes Government move on credit reporting

COBA says consumers stand to benefit from the Turnbull Government’s decision to nudge major banks to participate in comprehensive credit reporting (CCR).

“COBA welcomes Treasurer Scott Morrison’s announcement of a CCR regime from 1 July next year, starting with the four major banks,” said COBA Acting CEO Dominic Dunn.

“As the Treasurer notes, other lenders are likely to follow suit quickly to improve their competitive position and their credit decision making.

“COBA’s position is that participation in CCR should be voluntary for smaller lenders because they have more of an incentive to participate than the largest lenders and should be able to do so according to their own priorities and resources.

“The landmark Financial System Inquiry (FSI) report in 2014 found that the net benefits of participating will differ between different classes of credit provider. For a major institution with a relatively large customer base, early participation may provide, at least initially, relatively larger benefits to smaller participants than for the institution itself.

“But as participation and system-wide data grow, net benefits increase for all CCR participants.

“CCR has the potential to increase competition because lenders will have more information about consumers, which means they will be able to better match credit types and amounts to borrower capacity. Lenders will have capacity to more accurately price credit relative to the risk profile of the borrower.

“The banking market is an oligopoly and regulatory interventions must be designed to give the competitive fringe of smaller players every chance to take on the major banks.

“The Treasurer’s announcement on CCR is consistent with this approach. Regulatory compliance costs have a big impact on the competitive capacity of smaller players.”

Suncorp Update To 30 Sep 2017

Suncorp provided its statutory quarterly update today under Australian Prudential Standard 330.  The bank appears to be travelling well, with a growing loan book across both home and business lending.  Bad debts are low, though there was a rise in past due in the QLD and NSW mortgage books. Capital is under pressure because of the loan growth.

They say that total lending grew 2.4% over the quarter, primarily due to strong home lending supported by improved capability, simplified processes and improved retention. The home lending portfolio grew by $1.1 billion. Year-on-year investor lending grew  7.6% and new interest-only lending of 29% was achieved for the quarter.

More than half of all lending is located within Queensland ($28.9 billion of $54 billion).$44 billion are retail loans and Business Lending, including Agribusiness was $9.8 billion.

Credit quality performance remains strong with impairment losses of $5 million, or 4 basis points of gross loans and advances (annualised). Higher arrears reported in the second half of the 2017 financial year relating to changes in hardship operational practices and processes are stabilising, as the temporary impacts of the revisions have normalised.

They say retail lending past due loans grew by $7 million over the quarter, reflecting slightly higher home lending past due loans in QLD and NSW.

The Bank has maintained its measured approach to managing funding and liquidity risk ensuring a strong and sustainable funding profile that supports balance sheet growth. This includes the successful issuing of a $1.5 billion capital effective Residential Mortgage-Backed Security
(RMBS) transaction, which further supports stability as reflected in the Net Stable Funding Ratio (NSFR) position, estimated to be 113% as at 30 September 2017.

Following the payment of the final 2017 financial year dividend to Suncorp Group, Banking’s Common Equity Tier 1 ratio of 8.77% reflects a sound capital position within the operating range of 8.5% to 9.0%.

The main risks are a declining property market or higher than anticipated cyclone claims.


Dwelling approvals rise 1.8 per cent in September

The latest ASB data shows that the number of dwellings approved rose 1.8 per cent in September 2017, in trend terms, and has risen for eight months.

Dwelling approvals increased in September in the Australian Capital Territory (7.9 per cent), Northern Territory (6.5 per cent), Tasmania (4.5 per cent), New South Wales (3.4 per cent), Western Australia (2.0 per cent), South Australia (1.5 per cent) and Victoria (0.7 per cent), but decreased in Queensland (0.5 per cent) in trend terms.

In trend terms, approvals for private sector houses rose 0.7 per cent in September. Private sector house approvals rose in Queensland (1.8 per cent), South Australia (1.2 per cent), Victoria (0.6 per cent) and New South Wales (0.5 per cent), but fell in Western Australia (0.9 per cent).

In seasonally adjusted terms, dwelling approvals increased by 1.5 per cent in September, driven by a rise in private dwellings excluding houses (2.6 per cent), while private house approvals rose 0.6 per cent.

The value of total building approved rose 1.3 per cent in September, in trend terms, and has risen for nine months. The value of residential building rose 1.5 per cent while non-residential building rose 1.0 per cent.

“The value of non-residential building approvals have risen for the past eight months, in trend terms, reaching a record high in September 2017.” Bill Becker, the Assistant Director of Construction Statistics at the ABS, said.

“The strength in non-residential building has been driven by approvals in Victoria, where a number of office and education buildings have been approved in recent months.”