October Mortgage Stress Higher Again – See The Top 10 Post Codes

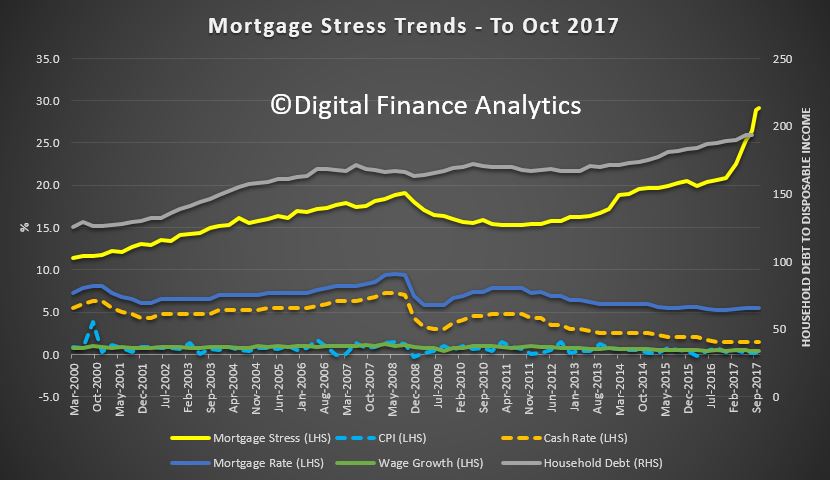
Digital Finance Analytics has released the October 2017 Mortgage Stress and Default Analysis update. Across Australia, more than 910,000 households are estimated to be now in mortgage stress (last month 905,000) and more than 21,000 of these in severe stress, up by 3,000 from last month. This equates to 29.2% of households. We see continued default pressure building in Western Australia, as well as among more affluent household, beyond the traditional mortgage belts across the country.

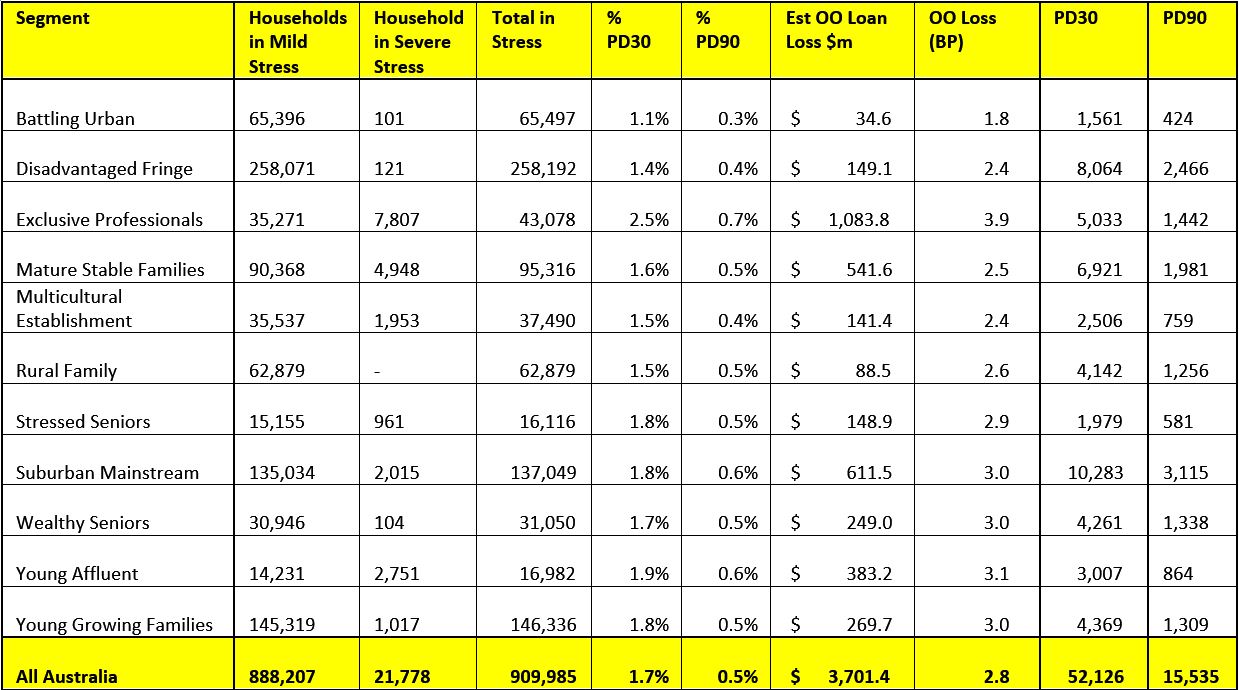
We estimate that more than 52,000 households risk 30-day default in the next 12 months, up 3,000 from last month. We expect bank portfolio losses to be around 2.8 basis points ahead, though with losses in WA rising to 4.9 basis points.

Watch the video to see our countdown of the top-10 postcodes across the country this month.

Risks in the system continue to rise, and while recent strengthening of lending standards will help protect new borrowers, there are many households currently holding loans which would not now be approved. As continued pressure from low wage growth and rising costs bites, those with larger mortgages are having more difficulty balancing the family budget. These stressed households are less likely to spend at the shops, which will act as a further drag anchor on future growth, one reason why retail spending is muted. The number of households impacted are economically significant, especially as household debt continues to climb to new record levels. Mortgage lending is still growing at three times income. This is not sustainable.

Our analysis uses the DFA core market model which combines information from our 52,000 household surveys, public data from the RBA, ABS and APRA; and private data from lenders and aggregators. The data is current to end October 2017. We analyse household cash flow based on real incomes, outgoings and mortgage repayments, rather than using an arbitrary 30% of income.

Households are defined as “stressed” when net income (or cash flow) does not cover ongoing costs. Households in mild stress have little leeway in their cash flows, whereas those in severe stress are unable to meet repayments from current income. In both cases, households manage this deficit by cutting back on spending, putting more on credit cards and seeking to refinance, restructure or sell their home.  Those in severe stress are more likely to be seeking hardship assistance and are often forced to sell.

The forces which are lifting mortgage stress levels remain largely the same. In cash flow terms, we see households having to cope with rising living costs whilst real incomes continue to fall and underemployment remains high. Households have larger mortgages, thanks to the strong rise in home prices, especially in the main eastern state centres. While mortgage rates remain quite low for owner occupied borrowers, those with interest only loans or investment loans have seen significant rises.  We expect some upward pressure on real mortgage rates in the next year as international funding pressures mount, a potential for local rate rises and margin pressure on the banks. We revised our expectation of potential interest rate rises, given the stronger data on the global economy.

Probability of default extends our mortgage stress analysis by overlaying economic indicators such as employment, future wage growth and cpi changes.  We have also extended our Core Market Model to examine the potential of 90-Day defaults (PD90) and portfolio risk of loss in basis point and value terms. Losses (in terms of value) are likely to be higher among more affluent households.

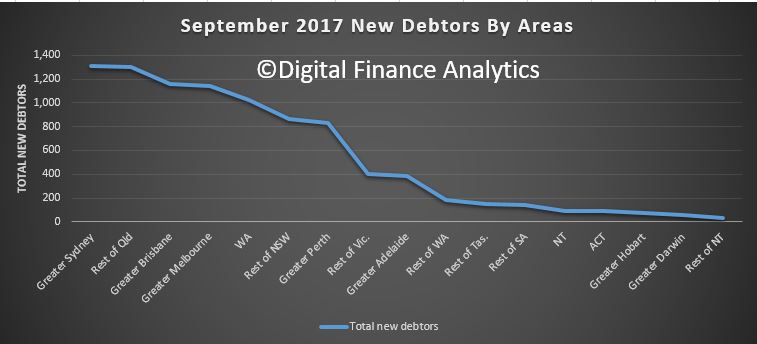
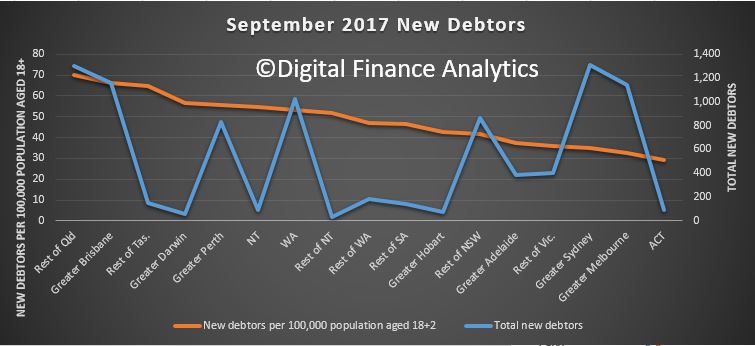
Regional analysis shows that NSW has 242,399 households in stress (238,703 last month), VIC 250,259 (243,752 last month), QLD 162,726 (168,051 last month) and WA 121,393 (124,754 last month). The probability of default rose, with around 9,800 in WA, around 9,600 in QLD, 13,000 in VIC and 13,900 in NSW.

You can request our media release. Note this will NOT automatically send you our research updates, for that register here.

[contact-form to=’mnorth@digitalfinanceanalytics.com’ subject=’Request The Oct 2017 Stress Release’][contact-field label=’Name’ type=’name’ required=’1’/][contact-field label=’Email’ type=’email’ required=’1’/][contact-field label=’Email Me The Oct 2017 Media Release’ type=’radio’ required=’1′ options=’Yes Please’/][contact-field label=”Comment If You Like” type=”textarea”/][/contact-form]

Note that the detailed results from our surveys and analysis are made available to our paying clients.

Virgin Money Cuts Mortgage Rates For New Customers

From The Adviser.

Virgin Money, the Bank of Queensland-owned lender has this week reduced its variable rates for both owner-occupiers and investors and increased the maximum LVR for interest-only mortgages.

Effective from 1 November, Virgin Money will be decreasing variable owner-occupied principal and interest (P&I) and interest-only (IO) rates (for LVRs equal to or under 80 per cent) and variable IO rates for new applications submitted in ApplyOnline.

Also effective this week, the lender’s maximum LVR on owner-occupied IO loans has increased to 80 per cent. The rate changes are as follows:

Owner-occupied – principal and interest (P&I)

Current rate (p.a.) Change New rate (p.a.)
Borrowings $75,000 to $499,999 3.89% -0.21% 3.68%
Borrowings $500,000 to $749,999 3.84% -0.16% 3.68%
Borrowings $750,000 and above 3.79% -0.15% 3.64%


Investment – Interest-only (IO)

Current rate (p.a.) Change New rate (p.a.)
Borrowings $75,000 to $499,999 4.69% -0.16% 4.53%
Borrowings $500,000 to $749,999 4.64% -0.11% 4.53%
Borrowings $750,000 and above 4.59% -0.06% 4.53%


NAB FY17 Result Cash Earnings $6,642 million

National Australia Bank reported its FY17 results today. Cash earnings were up 2.5% to $6,642 million, which was below expectation, and the statutory profit was $5,285m. The cash return on equity was 14%, down 30 basis points on last year. CET1 Capital was 10.1%, up 29 basis points.

NAB now has its main footprint in Australia, (and New Zealand). NIM improved, although the long term trend is down. Wealth performance was soft, and expenses were higher than expected, but lending, both mortgages and to businesses, supported the results.  They made a provision for potential risks in the retail and the mortgage portfolio, with a BDD charge of 15 basis points but new at risk assets were down significantly this last half.

Ahead, they flagged considerable investment in driving digital, and major cost savings later into FY20.

Of the $565.1 billion in loans, 58% of the business is mortgages, 40% business loans and 2% personal loans. 84% of gross loans are in Australia, and 13% in New Zealand. 10.9% of gross loans, or $61.9bn are commercial real estate loans, mainly in Australia.

So, the key risk, or opportunity, depending on your point of view, is the property sector. Currently portfolio losses are low at 2 basis points but WA past 90-day mortgages were up. If property prices start to fall away seriously, new mortgage flows taper down, or households get into more difficulty (especially if rates rise), NAB will find it hard to sustain its current levels of business performance.

Looking in more detail, Group Net operating income was 2.7% higher YOY and 1.8% higher in the second half.

Group net interest margin was 1.88%, up from 1.82% in 1H. They improved their lending margin by 7 basis points. The bank levy cost 3 basis points.

But long term NIM trends are lower.

Operating expenses rose 2.6% YOY

B&DD Charges rose to $416m, and was 0.15% of GLAs.

New impairments were $452m Sep 17, down from $690m in Mar 17.

The collective provisions were up, $2,798m in Sep 17.

NAB CET1 ratio is 10.1% under APRA, but 14.5% under their claimed Internationally Comparable CET1 ratio. It was hit by the move to higher mortgage risk weights in 2H. This added around 17 basis points.

51% of funding is from stable customer deposits.  The Liquidity Coverage Ratio was 123%.

The net stable funding ratio was 108% at Sep 17.

Looking in more detail at the segments:

The net interest margins for Consumer Banking and Wealth is 2.10%.

NIM for Business and Private Banking was higher.

Corporate and Institutional Banking NIM also improved.

NIM in the NZ business was also higher in 2H17.

Turning to the critical Australian Mortgage portfolio we see that housing revenue grew..

.. and NIM improved in 2H17.

They highlight prudent customer behaviour – on average customers are 30 monthly payments in advance; 73% of all customers are at least 1 month in advance but this includes offset accounts.

They said the average LVR at origination was 69% and the dynamic LVR is 43%

NAB uses interest rate buffers and applies a floor rate (7.25%) or buffer (2.25%) to new and existing debt, plus granular expense evaluation across 12 customer expense criteria using the greater of customer expense capture or scaled Household Expenditure Measures.

The strongest growth came from their Broker and Advantedge channels, with 4,637 brokers under NAB owned aggregators. 42% of draw-downs were attributed to brokers in Sep 17.  One third of the portfolio is broker originated.

They reported some switching from interest only loans to principal and interest loans, including contractual conversion.

The proportion of new interest only lending is falling. The 30% Interest Only flow cap includes all new IO loans and net limit increases on existing IO loans. The cap excludes line of credit and internal refinances unless the internal refinance results in an increased credit limit (only the increase is included in the cap).

90-Day past due date are sitting at ~0.6%, but WA is 1.2% (similar to other lenders, WA is were higher risks reside at the moment).  QLD is around 1.0%. 9% of loans are in WA, 17% in QLD. Current loss rates are 2 basis points (12 month rolling Net Write-offs / Spot Drawn Balances).

Looking ahead, the bank is targetting more than $1bn in cost savings by FY20 by driving simplification and automation, with a flatter organisational structure, and savings from procurement and third party costs. However, FY18 expenses are expected to increase by 5-8% due to higher investment spend, then targeting broadly flat expenses to FY20.

They highlight the transition to mobile, with more transactions now via mobile than internet banking.

Further investments will be made here. 6,000 jobs will go in the next 3 years, while 2,000 new digital jobs will be created.

FED Flags Rate Rises; Again, But Holds

The FED held their benchmark rate again, but the latest Federal Reserve FOMC statement contains a firm indication of rises ahead, if but slowly. Meantime, the balance sheet normalization is proceeding.

Information received since the Federal Open Market Committee met in September indicates that the labor market has continued to strengthen and that economic activity has been rising at a solid rate despite hurricane-related disruptions. Although the hurricanes caused a drop in payroll employment in September, the unemployment rate declined further. Household spending has been expanding at a moderate rate, and growth in business fixed investment has picked up in recent quarters. Gasoline prices rose in the aftermath of the hurricanes, boosting overall inflation in September; however, inflation for items other than food and energy remained soft. On a 12-month basis, both inflation measures have declined this year and are running below 2 percent. Market-based measures of inflation compensation remain low; survey-based measures of longer-term inflation expectations are little changed, on balance.

Consistent with its statutory mandate, the Committee seeks to foster maximum employment and price stability. Hurricane-related disruptions and rebuilding will continue to affect economic activity, employment, and inflation in the near term, but past experience suggests that the storms are unlikely to materially alter the course of the national economy over the medium term. Consequently, the Committee continues to expect that, with gradual adjustments in the stance of monetary policy, economic activity will expand at a moderate pace, and labor market conditions will strengthen somewhat further. Inflation on a 12-month basis is expected to remain somewhat below 2 percent in the near term but to stabilize around the Committee’s 2 percent objective over the medium term. Near-term risks to the economic outlook appear roughly balanced, but the Committee is monitoring inflation developments closely.

In view of realized and expected labor market conditions and inflation, the Committee decided to maintain the target range for the federal funds rate at 1 to 1-1/4 percent. The stance of monetary policy remains accommodative, thereby supporting some further strengthening in labor market conditions and a sustained return to 2 percent inflation.

In determining the timing and size of future adjustments to the target range for the federal funds rate, the Committee will assess realized and expected economic conditions relative to its objectives of maximum employment and 2 percent inflation. This assessment will take into account a wide range of information, including measures of labor market conditions, indicators of inflation pressures and inflation expectations, and readings on financial and international developments. The Committee will carefully monitor actual and expected inflation developments relative to its symmetric inflation goal. The Committee expects that economic conditions will evolve in a manner that will warrant gradual increases in the federal funds rate; the federal funds rate is likely to remain, for some time, below levels that are expected to prevail in the longer run. However, the actual path of the federal funds rate will depend on the economic outlook as informed by incoming data.

The balance sheet normalization program initiated in October 2017 is proceeding.

Australia’s property market growth comes to a halt

From The New Daily.

Sydney’s deflating house prices have dragged the property market down across the entire country, in the most conclusive sign yet that the boom is over, figures from CoreLogic have revealed.

For the month of October – traditionally a bumper month for property sales – average house prices across Australia’s capital cities posted no growth at all.

Sydney house prices fell by 0.5 per cent, bringing quarterly losses to 0.6 per cent.

Prices in Canberra and Darwin also fell (by 0.1 per cent and 1.6 per cent respectively), while Adelaide and Perth each posted zero growth.

Of the capital cities, only Melbourne, Brisbane and Hobart saw property prices increase, at 0.5 per cent, 0.2 per cent and 0.9 per cent respectively.

Perth’s flat growth was also an improvement on a long period of falling prices.

The poor results will be a disappointment to sellers who assumed a spring sale would optimise the value of their property.

CoreLogic’s head of research Tim Lawless put the low growth down, primarily, to tighter restrictions on lending.

“Lenders have tightened their servicing tests and reduced their appetite for riskier loans, including those on higher loan-to-valuation ratios or higher loan-to-income multiples,” he said.

He added that more expensive rates on interest-only loans were acting as a disincentive for property investors, particularly those that offered low rental yield.

Commenting on the NSW capital’s poor results, Mr Lawless said: “Seeing Sydney listed alongside Perth and Darwin, where dwelling values have been falling since 2014, is a significant turn of events.”

However, despite the recent depreciation, house prices in Sydney are still 7.7 per cent higher than they were a year ago.

Turning to Melbourne, Mr Lawless put the city’s continued growth down to “record-breaking migration rate”, which he said was creating “unprecedented housing demand”.

Units v Houses

In most capital cities, houses continued to see higher capital growth than units, due to overdevelopment of the latter. A notable exception to this was Sydney.

Over the year, unit values in Sydney grew by 7.9 per cent, compared to 7.7 per cent for houses.

“While Sydney is seeing a large number of new units added to the market, it seems that high levels of investment activity and strained affordability is helping to drive a better performance across this sector,” Mr Lawless.

The report found that rental yields, while they had grown 2.8 per cent over the year, were still extremely low when compared to house prices – which have on average risen 6.6 per cent over the year.

Sydney and Darwin were exceptions to this.

“If the Sydney market continues to see values slip lower while rents gradually rise, yields will repair, however a recovery in rental returns is likely to be a slow process,” Mr Lawless said.

Chinese money dries up

While CoreLogic put the flat growth down to tougher mortgage lending restrictions, a report by Credit Suisse offered a different explanation.

According to the ABC, the report found Chinese capital flows into Australia had fallen in recent months, and this was having a pronounced effect on the domestic property market.

“Over the past few months, the Sydney housing market has not only cooled down, but has arguably turned cold,” ABC quoted Credit Suisse as saying.

“Over the past year, Chinese capital flows have fallen considerably, in part reflecting the impact of stricter capital controls.

“This fall foreshadows weakness in NSW housing demand in the year ahead.”

This, Credit Suisse argued, could see the Reserve Bank forced to cut interest rates even further. Currently the cash rate sits at a record low of 1.5 per cent.

Why the RBA would want to create a digital Australian dollar

From The Conversation.

The Reserve Bank of Australia could join the likes of Estonia and Lebanon in creating a cryptocurrency based on the Australian dollar, to reap the benefits of technology like the blockchain but with more stability than other well known currencies like Bitcoin.

The RBA has already been approached by interested startups to create this new digital currency, known as the “DAD” or Digital Australian Dollar.

In contrast with other cryptocurrencies a state-backed digital currency has the advantage of being backed by the government as in fiat currency, but at the same time has the technological advantages shared by other cryptocurrencies.

A digital Australian dollar could remove the role of middlemen and create a cheaper electronic currency system, while at the same time enabling the government to fully regulate the system.

It would also allow transactions to settle faster (several minutes to an hour) than the traditional banking system (several hours to several days), especially in a situation where an international payment is involved.

The difference between a digital Australian dollar and Bitcoin

We already use the Australian dollar in a digital form, for example paying via your smartphone. But banks are essential in this system, moving money on our behalf.

When using a cryptocurrency, you interact with a system like the blockchain, an online ledger that records transactions, directly. Bitcoin, Litecoin, and Ethereum are examples of cryptocurrency that use the blockchain in this way. These currencies are created by the community that use them and are accepted and trusted within the community.

However, since the community runs the system, the price of the cryptocurrency solely depends on the market mechanism. When the demand increases, the price increases, but when the demand decreases, the price also decreases. While it might create an opportunity for speculators to gain profit from trading, it also creates risk for the cryptocurrency holders.

In comparison to cryptocurrency, the Digital Australian Dollar might be well managed that the price volatility could be reduced significantly. The government holds the capability of increasing or decreasing the money supply in the system. This power can be used to stabilise the market supply of the new digital currency.

The blockchain technology also reduces the fee for every payment made. This is made possible by removing the role of banks or other intermediary parties charging fees for their services. However, a small transaction fee still needs to be introduced to protect the system from being flooded by adversaries with insignificant transactions.

The characteristics of cryptocurrency itself might limit its usage to daily transactions. As the pioneer of cryptocurrency, Bitcoin was created to become a payment system, but the users gain incentive by simply saving their cryptocurrency and not using them to purchase goods or services.

They believe the future price of the cryptocurrency is higher than the current price and thus does not make a good medium of exchange nor a store of value. There is no guarantee that the cryptocurrency will hold any value in the future. Since there is nothing to back up the value, users will lose their wealth when the community no longer acknowledges the value of cryptocurrency.

Cryptocurrency might also jeopardise the local government’s effort of implementing regulations to minimise illegal activities. Perpetrators create cryptocurrency transactions easily without being detected by the government’s financial monitoring system.

The privacy features of cryptocurrency also make it hard for law enforcement agencies to determine the actors behind illegal activities. Although most governments in the world have enforced the coin exchange services to identify their users, the operation of the cryptocurrency is beyond their reach.

There are other state-backed digital currencies

The idea of creating a national cryptocurrency is not new. Estonia has explored ways to create Estcoin, following an initiative on the blockchain-based residency registration called e-Residency. Lebanon’s central bank has also started to examine the possibility of creating one.

Despite the efforts of those central banks, several questions must first be addressed before launching the real product to the public. The user’s financial data could be exposed since the blockchain will make all transactions created in the system transparent.

Consumer protection is also a concern since all transactions made in the blockchain are permanent without the possibility of being reversed. Without firm solutions to those problems, the Digital Australian Dollar will not satisfy all requirements to be the next groundbreaking innovation for the country’s financial system.

Author: Dimaz Wijaya, PhD Student, Monash University

Australia’s housing boom is ‘officially over’ – and that could have a big economic impact

From Business Insider.

Australian house price growth stalled in October, according to data from CoreLogic, thanks largely to a 0.5% decline in Sydney, the nation’s largest and priciest property market.

Prices in Australia’s largest city fell in the two months, leaving the decline since July at 0.6%, the largest over a comparable period since May 2016.

As a result of the weakness in Sydney, prices nationally have grown by just 0.3% since July in weighted terms, seeing the increase on a year earlier slow to 6.6%.

On the recent evidence, a Sydney-led national housing market slowdown is now underway.

Tim Lawless, Head of Research at CoreLogic, called it a “significant turn of events”, acknowledging that if historical patterns are repeated, there’s likely to be further declines to come.

He’s not alone on that front.

To George Tharenou, economist at UBS, the weakness in CoreLogic’s Home Value Index signals that Australia’s housing boom is now “officially over”.

“Australia’s world record housing boom is ‘officially’ over after a large ‘upswing’ of 6556% price growth in 55 years,” he says.

“After dwelling price growth was resilient at a booming 10% [plus annual] pace earlier this year, there is now a persistent and sharp slowdown unfolding.

“Indeed, the weakness in auction clearing rates, and the near flat growth in prices in the last 5 months, suggest the cooling may be happening a bit more quickly than even we expected.”

If the chart below from UBS is anything to go by, the decline in auction clearance rates in recent months points to the likelihood that annual price nationally will continue to decelerate into early 2018.

Source: UBS


“Price growth now seems likely to end 2017 around 5% year-on-year, below our expectation for 7%,” Tharenou says.

Like Lawless at CoreLogic, he says the Sydney-led slowdown is a lagged response to macroprudential tightening from Australia’s banking regulator, APRA, something that has led to out-of-cycle mortgage rate hikes as a result of tougher lending standards.

“This slowdown in house prices has coincided with a sharp slowing of investor housing credit growth to a 5.5% annualised pace in the last three months to September,” Tharenou says.

“This suggests a tightening of financial conditions is unfolding, which we expect to weigh on consumption growth ahead via a fading household wealth effect.”

Source: UBS


Given his expectation that weaker house price growth will soften household consumption, the largest part of the Australian economy, Tharenou says it will prevent the Reserve Bank of Australia from lifting interest rates until the second half of next year.

Should house price growth weaken further in the months ahead, it must surely cloud the outlook for residential construction, another crucial part of the Australian economy and the third-largest employer in the country.

With new home sales and building approvals both rolling over from the record levels reported last year, a bout of price weakness may exacerbate that slowdown, creating negative second-round effects across the broader economy given the sheer size of the residential construction sector.

Latest Insolvency Data Highlights Regional Risks

The latest data from the Australian Financial Security Authority  gives us data for the September 2017 quarter on personal insolvencies across the country. They changed the format of their reports so trending data is not easy. But WA and QLD are where the relative higher proportion of defaults are to be found, especially business related failures.

Lets look at the absolute count of new debtors by areas. The blue line shows the number of new debtors. The most new ones were in Greater Sydney, Regional Queensland, Greater Brisbane and Greater Melbourne. These are areas of relative high populations, so on one level no surprise.

But, a better way to compare the relative impact is to use a relative measure – the number of new debtors per 100,000 population, using the ABS data.

On this basis, the Regional Queensland, Greater Brisbane and Rest of Tasmania have the highest concentration. Queensland is clearly a problem area. Greater Sydney and Melbourne are at the lowest end of the spread.

Finally, we sort the data by proportion of business failures. That shows Greater Perth and Regional WA, then Regional Queensland have the higher business related failure rates.

The largest numbers of debtors entering a business-related personal insolvency in Greater Perth in the September quarter 2017 were in:

  • Wanneroo (20 debtors)
  • Rockingham (19 debtors)
  • Joondalup (14 debtors).

The largest numbers of debtors entering a new business-related personal insolvency in rest of Western Australia in September quarter 2017 were in:

  • Goldfields (8 debtors)
  • Bunbury (7 debtors)
  • Wheat Belt – North (5 debtors).

The largest numbers of debtors entering a new business-related personal insolvency in rest of Queensland in the September quarter 2017 were in:

  • Ormeau – Oxenford (23 debtors)
  • Townsville (17 debtors)
  • Mackay (16 debtors).

We find these data series to be helpful in assessing the risks of default within our Core Market Models.

Westpac tightens up on responsible lending

From Australian Broker.

Westpac has brought in a number of responsible lending changes affecting how brokers enter in requirements and objectives (R&O) questions for clients.

“As a bank, Westpac is committed to responsible lending and meeting our conduct obligations under the National Consumer Credit Protection Act. Requirements and Objectives are a part of our responsible lending obligations,” the bank wrote in a note to brokers on Monday (30 October).

Effective from 14 November, brokers will be required to complete additional R&O questions and declarations for clients taking out certain loan types including but not limited to:

  • Fixed interest loans
  • Loans requiring lenders’ mortgage insurance
  • Loans with interest only repayments
  • Line of credit loans
  • Loans for refinancing or debt consolidation

The questions are designed to help brokers understand their client motivations, align the products to their needs, and prompt brokers to explain consequences around each choice of product to the client.

Additional R&O questions will also apply for each applicant of the loan, including for clients with foreseeable changes, special circumstances, current financial hardship, or those approaching retirement age.

“Westpac Group takes its responsible lending obligations seriously and is committed to ensuring good outcomes for our customers across first and third party lending,” Tony MacRae, general manager of third party distribution at Westpac, told Australian Broker.

“We’ll be working closely with all brokers over the coming months to support them with this new way of working – many had already adopted this approach and have been working this way for some time.”

From 8 January 2018, changes to submitted loan applications will no longer be accepted by email and will instead have to be completed through ApplyOnline.

“This will ensure that the correct R&O are captured accurately for all applications submitted and resubmitted and there is a central location that incorporates all the R&O information that has been discussed between yourself and the client with documented evidence of any loan changes,” the bank said.

Top 20 Fund Managers By Country

Following this mornings data on the top 500 Fund Managers, which has passed US$80 trillion under management in 2016 (contained in the 2017 report) and which helps to explain the inflated asset prices of property and the stock market; it is worth looking at the country break down by percentage of funds under management, all stated in US$.

More than half of assets are held by managers in the USA, followed in descending order by UK, France, Germany, Canada and Japan. Australia has 1.39% of assets, but that may be overstated as this includes Macquarie who has more business off shore than on shore.

Here are the top 20 globally, by manager. Black Rock is by far the largest.

Here are the top 20 from the USA.

Here are the top 20 from the UK.

Switzerland is dominated by funds managed by UBS.

Here are the Australian top 20.

Finally, here is the China footprint – given the wealth accumulation there, I have little doubt they will be overtaking Australia, and moving well up the rankings in the years ahead.