Low Inflation, A Mystery Says The FED

In a speech by FED Chair Yellen, at the Group of 30 International Banking Seminar, she discussed the problem of low inflation, and admitted that their understanding of why it remains so low is imperfect and low inflation may persist.  Perhaps the labour market is really softer than reported; perhaps long term trends will remain lower; perhaps technological and sectorial changes may be impacting. Despite this, she expects the FED rate to rise in the months ahead.

The biggest surprise in the U.S. economy this year has been inflation. Earlier this year, the 12-month change in the price index for personal consumption expenditures (PCE) reached 2 percent, and core PCE inflation reached 1.9 percent. These readings seemed consistent with the view that inflation had been held down by both the sizable fall in oil prices and the appreciation of the dollar starting around mid-2014, and that these influences have diminished significantly by this year. Accordingly, inflation seemed well on its way to the FOMC’s 2 percent inflation objective on a sustainable basis.

Inflation readings over the past several months have been surprisingly soft, however, and the 12-month change in core PCE prices has fallen to 1.3 percent. The recent softness seems to have been exaggerated by what look like one-off reductions in some categories of prices, especially a large decline in quality-adjusted prices for wireless telephone services. More generally, it is common to see movements in inflation of a few tenths of a percentage point that are hard to explain, and such “surprises” should not really be surprising. My best guess is that these soft readings will not persist, and with the ongoing strengthening of labor markets, I expect inflation to move higher next year. Most of my colleagues on the FOMC agree. In the latest Summary of Economic Projections, my colleagues and I project inflation to move higher next year and to reach 2 percent by 2019.

To be sure, our understanding of the forces that drive inflation is imperfect, and we recognize that this year’s low inflation could reflect something more persistent than is reflected in our baseline projections. The fact that a number of other advanced economies are also experiencing persistently low inflation understandably adds to the sense among many analysts that something more structural may be going on. Let me mention a few possibilities of more fundamental influences.

First, given that estimates of the natural rate of unemployment are so uncertain, it is possible that there is more slack in U.S. labor markets than is commonly recognized, which may be true for some other advanced economies as well. If so, some further tightening in the labor market might be needed to lift inflation back to 2 percent.

Second, some measures of longer-term inflation expectations have edged lower over the past few years in several major economies, and it remains an open question whether these measures might be reflecting a true decline in expectations that is broad enough to be affecting actual inflation outcomes.

Third, our framework for understanding inflation dynamics could be misspecified in some way. For example, global developments–perhaps technological in nature, such as the tremendous growth of online shopping–could be helping to hold down inflation in a persistent way in many countries. Or there could be sector-specific developments–such as the subdued rise in medical prices in the United States in recent years–that are not typically included in aggregate inflation equations but which have contributed to lower inflation. Such global and sectoral developments could continue to be important restraining influences on inflation. Of course, there are also risks that could unexpectedly boost inflation more rapidly than expected, such as resource utilization having a stronger influence when the economy is running closer to full capacity.

In this economic environment, with ongoing improvements in labor market conditions and softness in inflation that is expected to be temporary, the FOMC has continued its policy of gradual policy normalization. As the Committee announced after our September meeting, we are initiating our balance sheet normalization program this month. That program, which was described in the June Addendum to the Policy Normalization Principles and Plans, will gradually scale back our reinvestments of proceeds from maturing Treasury securities and principal payments from agency securities. As a result, our balance sheet will decline gradually and predictably.2 By limiting the volume of securities that private investors will have to absorb as we reduce our holdings, the caps should guard against outsized moves in interest rates and other potential market strains.

Changing the target range for the federal funds rate is our primary means of adjusting the stance of monetary policy. Our balance sheet is not intended to be an active tool for monetary policy in normal times. We therefore do not plan on making adjustments to our balance sheet normalization program. But, of course, as we stated in June, the Committee would be prepared to resume reinvestments if a material deterioration in the economic outlook were to warrant a sizable reduction in the federal funds rate.

Also at our September meeting, the Committee decided to maintain its target for the federal funds rate. We continue to expect that the ongoing strength of the economy will warrant gradual increases in that rate to sustain a healthy labor market and stabilize inflation around our 2 percent longer-run objective. That expectation is based on our view that the federal funds rate remains somewhat below its neutral level–that is, the level that is neither expansionary nor contractionary and keeps the economy operating on an even keel. The neutral rate currently appears to be quite low by historical standards, implying that the federal funds rate would not have to rise much further to get to a neutral policy stance. But we expect the neutral level of the federal funds rate to rise somewhat over time, and, as a result, additional gradual rate hikes are likely to be appropriate over the next few years to sustain the economic expansion. Indeed, FOMC participants have built such a gradual path of rate hikes into their projections for the next couple of years.

ACCC Electricity report details affordability, competition issues

We know from our surveys that many households are under intense pressure thanks to rising costings of living and flat wages. Higher electricity prices are one of the main causes.

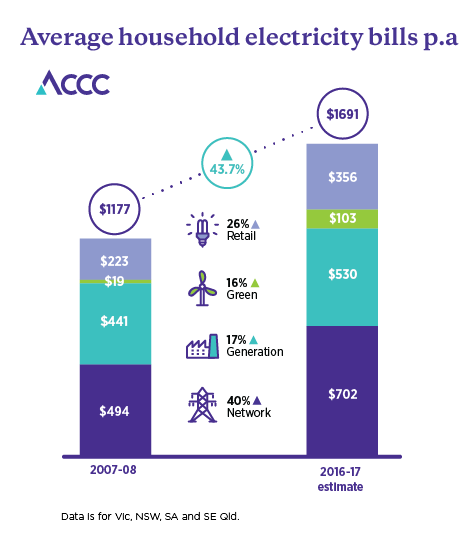
Now the ACCC has published a preliminary report into the electricity market highlighting significant concerns about the operation of the National Electricity Market, which is leading to serious problems with affordability for consumers and businesses. They say residential prices have increased by 63 per cent on top of inflation since 2007-08. The main reason customers’ electricity bills have gone up is due to higher network costs. Higher wholesale costs during 2016-17 contributed to a smaller $167 increase in bills.

Consumers and businesses are faced with a multitude of complex offers that cannot be compared easily. Many of these issues arise from unnecessarily complex and confusing behaviour by electricity retailers.

This suggests the current Government focus on supply related issues is myopic, and this alone cannot solve the issues in the system, many of which are simply stemming from poor company behaviour.  And, by the way, this mirrors the issues in the UK, where similar behaviour also exists!

The Retail Electricity Pricing Inquiry preliminary report details the ACCC’s initial assessment of information it has gathered including documents and data from industry, consumers, businesses, representative groups and other government and non-government organisations.

The inquiry received over 150 submissions since it began in April. The ACCC heard directly from consumers, businesses and other stakeholders at public forums in Adelaide, Brisbane, Melbourne, Sydney, and Townsville.

“It’s no great secret that Australia has an electricity affordability problem. What’s clear from our report is that price increases over the past ten years are putting Australian businesses and consumers under unacceptable pressure,” ACCC Chairman Rod Sims said.

“Consumers have been faced with increasing pressures to their household budgets as electricity prices have skyrocketed in recent years. Residential prices have increased by 63 per cent on top of inflation since 2007-08.”

The main cause of higher customer bills was the significant increase in network costs for all states other than South Australia. In South Australia, generation costs represented the highest increase. There was a much larger increase in the effect of retail costs in Victoria than in other states. Retail margins increased significantly in NSW, but decreased in others.

“The main reason customers’ electricity bills have gone up is due to higher network costs, a fact which is not widely recognised. To a lesser extent, increasing green costs and retailer costs also contributed,” Mr Sims said.

“We estimate that higher wholesale costs during 2016-17 contributed to a $167 increase in bills. The wholesale (generation) market is highly concentrated and this is likely to be contributing to higher wholesale electricity prices,” Mr Sims said.

The ACCC estimates that in 2016-17, Queenslanders will be paying the most for their electricity, followed by South Australians and people living in NSW. Victorians will have the lowest electricity bills. This is due to a range of factors including usage patterns in various states, including the prevalence of gas usage in Victoria in particular.

The closure of large baseload coal generation plants has seen gas-powered generation becoming the marginal source of generation more frequently, particularly in South Australia. Higher gas prices have contributed to increasing electricity prices.

The ‘big three’ vertically integrated gentailers, AGL, Origin, and EnergyAustralia, continue to hold large retail market shares in most regions, and control in excess of 60 per cent of generation capacity in NSW, South Australia, and Victoria making it difficult for smaller retailers to compete.

The ACCC has heard many examples of the difficulties that consumers and small businesses face in engaging with the retail electricity market and the particular difficulties faced by vulnerable consumers.

“Consumers and businesses are faced with a multitude of complex offers that cannot be compared easily. There is little awareness of the tools available to help consumers make informed choices or seek assistance if they are struggling to pay their electricity bills,” Mr Sims said.

“Many of these issues arise from unnecessarily complex and confusing behaviour by electricity retailers, and in some cases this appears to be designed to circumvent existing regulation.”

“There is much ill-informed commentary about the drivers of Australia’s electricity affordability problem. The ACCC believes you cannot address the problem unless you have a clear idea about what caused it.”

“Armed with the clear findings on the causes of the problem, the ACCC will now focus on making recommendations that will improve electricity affordability across the National Electricity Market,” Mr Sims said.

Increased generation capacity (particularly from non-vertically integrated generators), preventing further consolidation of existing generation assets, and improving the availability and affordability of gas for gas fired generation, could all help to take the pressure off retail electricity bills.

The ACCC will also seek to identify ways to mitigate the effect of past decisions around network investments on retail electricity prices, noting that many past decisions  are ‘locked-in’ and will burden electricity users for many years to come.

The ACCC will consider steps that can be taken to reduce complexity and improve consumers’ ability to engage with the retail electricity market and switch suppliers.

“We will provide recommendations for reform in our final report, which will be provided to the Treasurer in June 2018,” Mr Sims said.

In part based on our findings, the Federal Government has already taken some steps towards improving electricity affordability, including obtaining commitments from some retailers to move consumers off high standing offers or expired benefit offers, and the proposed removal of limited merits review of AER decisions.

In addition, the ACCC’s preliminary report contains some recommendations that could be immediately implemented by governments:

  • Provide additional resourcing to the AER’s Energy Made Easy price comparison website as a tool to assist consumers in comparing energy offers
  • State and territory governments should review concessions policy to ensure that consumers are aware of their entitlements and that concessions are well targeted and structured to benefit those most in need.
  • Improvements to the AER’s ability to effectively investigate possible breaches of existing regulation, for example the power to require individuals to appear before it and give evidence. Consideration should also be given to the adequacy of existing infringement notices and civil pecuniary penalties to deter market participants from breaching existing regulations.


Background

The ACCC’s preliminary findings are that, on average across the NEM, a 2015-16 residential bill was $1,524 (excluding GST). This average residential bill was made up of:

  • network costs (48 per cent)
  • wholesale costs (22 per cent)
  • environmental costs (7 per cent)
  • retail and other costs (16 per cent)
  • retail margins (8 per cent).

In real terms, average residential bills increased by around 30 per cent (on a dollars per customer basis) between 2007-08 and 2015-16. Average residential prices (as measured by cents per kWh measure) have increased by 47 per cent in real terms during the same period.

After considering wholesale price increases in 2016-17, the ACCC estimates that average bills in dollars per customer increased in real terms by 44 per cent since 2007-08, while prices in cents per kWh have increased in real terms by 63 per cent.

See report: Retail Electricity Pricing Inquiry preliminary report

For more information: Electricity supply prices inquiry

How marketers use algorithms to (try to) read your mind

From The Conversation.

Have you ever you looked for a product online and then been recommended the exact thing you need to complement it? Or have you been thinking about a particular purchase, only to receive an email with that product on sale?

All of this may give you a slightly spooky feeling, but what you’re really experiencing is the result of complex algorithms used to predict, and in some cases, even influence your behaviour.

Companies now have access to an unprecedented amount of data on your present and past shopping and browsing preferences. This ranges from transactional data, to website traffic and even social media posts. Predictive algorithms use this data to make inferences about what is likely to happen in the future.

For example, after a few times visiting a coffee shop, the barista might notice that you always order a latte with one sugar. They could then use this “data” to predict that tomorrow you will order the same thing, and have it ready for you before you get there.

Predictive algorithms work the same way, just on a much bigger scale.

How are big data and predictive algorithms used?

My colleagues and I recently conducted a study using online browsing data to show there are five reasons consumers use retail websites, ranging from simply “touching base” to planning a specific purchase.

Using historical data, we were able to see that customers who browse a wide variety of different product categories are less likely to make a purchase than those that are focused on specific products. Meanwhile consumers were more likely to purchase if they reached the website through a search engine, compared to a link in an email.

With information like this websites can be personalised based on the most likely motivation of each visitor. The next time a consumer clicks through from a search engine they can be led straight to checkout, while those wanting to browse can be given time and inspiration.

Somewhat similar to this are the predictive algorithms used to make recommendations on websites like Amazon and Netflix. Analysts estimate that 35% of what people buy on Amazon, and 75% of what they watch on Netflix, is driven by these algorithms.

These algorithms also work by analysing both your past behaviour (e.g. what you have bought or watched), as well as the behaviour of others (e.g. what people who bought or watched the same thing also bought or watched). The key to the success of these algorithms is the scope of data available. By analysing the past behaviour of similar consumers, these algorithms are able to make recommendations that are more likely to be accurate, rather than relying on guess work.

For the curious, part of Amazon’s famous recommendation algorithm was recently released as an open source project for others to build upon.

But of course, there are innumerable other data points for algorithms to analyse than just behaviour. US retailer Walmart famously stocked up on strawberry pop-tarts in the lead up to a major storm. This was the result of simple analysis of past weather data and how that influenced demand.

It is also possible to predict how purchase behaviour is likely to evolve in the future. Algorithms can predict whether a consumer is likely to change purchase channel (e.g. from in-store to online), or even if certain customers are likely to stop shopping.

Prior studies that have applied these algorithms have found companies can influence a consumer’s choice of purchase channel and even purchase value by changing the way they communicate with them, and can use promotional campaigns to decrease customer churn.

Should I be concerned?

While these predictive algorithms undoubtedly provide benefits, there are also serious issues about privacy. In the past there have been claims that companies have predicted consumers are pregnant before they know themselves.

These privacy concerns are critical and require careful consideration from both businesses and government.

However, it is important to remember that companies are not truly interested in any one consumer. While many of these algorithms are designed to mimic “personal” recommendations, in fact they are based on behaviour across the whole customer base. Additionally, the recommendations or promotions that are given to each individual are automated from the database, so the chances of any staff actually knowing about an individual customer is extremely low.

Consumers can also benefit from companies using these predictive algorithms. For example, if you search for a product online, chances are you will be targeted with ads for that product over the next few days. Depending on the company, these ads may include discount codes to encourage you to purchase. By waiting a few days after browsing, you may be able to get a discount for a product you were intending to buy anyway.

Alternatively, look for companies who adjust their price based on forecasted demand. By learning when the low-demand periods are, you can pick yourself up a bargain at lower prices. So while companies are turning to predictive analytics to try to read consumers’ minds, some smart shopping behaviours can make it a two-way street.

Author: Jason Pallant, Lecturer of Marketing, Swinburne University of Technology

Too Little Too Late? – The Property Imperative Weekly 14th October 2017

Another massive week of finance and property news, much of it centred on households and their finances, as the regulators home in on the risks in the mortgage market. But is it too little too late?

Welcome to the Property Imperative weekly to the 14th October 2017. Watch the video, or read the transcript.

We start our review of this week’s finance and property news with the RBA’s Financial Stability report.  This quarterly report, which ran to 62 pages said that International economic conditions, and local business confidence are on the improve while banks now hold more capital, have tightened lending standards, and shadow banking is under control. But, they say, Australian household balance sheets and the housing market remain a core area of interest, and from a financial stability perspective, this is the key risk. They showed that one third of mortgage holders have less than one months’ buffer, and their key concern is the negative impact on future growth as households hunker down;  so nothing new really, apart from some new “Top Down” stress testing.

And nothing to answer the IMF’s downgraded Australian growth forecast. Given the first half result in 2017 was 1.2% a second half forecast at circa 1% is hardly stellar; and the sudden rebound to 3% next year, some might say, appears courageous. The IMF also revised up the unemployment rate, suggesting it will remain at 5.6%, rather than falling to 5.3% as estimated last time. This plus slow wage growth highlights the issues underlying the economy. They also warned about risks from high debt saying growth in household debt relative to GDP is associated with a greater probability of a banking crisis. And Australia is right up there!

On the same day, the ABS released their latest Housing and Occupancy Costs data. The average household with an owner occupied mortgage is paying around $450 a week, slightly lower than the peak a couple of years ago.  This equates to around 16% of gross household income. But of course, the true story is interest rates have fallen to all-time lows, allowing people to borrow more, as prices rise. As a result, should interest rates start to bite, this will cause real pain. Plus, we have recent flat wage growth, in real terms, in the past couple of years. Finally, households have a bigger mortgage held for longer, which is great for the banks, but not helpful from a household perspective, as it erodes savings into retirement and means that more older Australians are still borrowing as they transition from the work force.

Earlier in the week, the ABS also released their latest housing finance data which showed that ADI lending rose 0.6% in trend terms in August, or 2.1% seasonally adjusted. Within that, lending for owner occupied housing rose 0.9%, or 2.1% seasonally adjusted and investor loans rose 0.2% in trend terms, or a massive 4.3% in seasonally adjusted terms. So lending growth is apparent, and signals more household debt ahead. First time buyers continue to extend their reach, despite the fact we are seeing “Peak Price” for property at the moment. In original terms, the number of first home buyer commitments as a percentage of total owner occupied housing finance commitments rose to 17.2% in August 2017 from 16.6% in July.

AFG’s latest mortgage index, shows that property investor appetite is falling, while first time buyers, and property upgraders are more active. First time buyers are reacting to the recent incentives put in place in VIC and NSW, they said.

Citi published a 54-page report on the highly topical subject of interest only (IO) loans, and we provided data from our Core Market Model to assist their research. Even after recent regulatory tightening, they say that underwriting standards in Australia are still more generous than some other countries, at 5.3 times income, compared with 3.7 times in the UK, 4.4 times in Canada and 4.9 times in New Zealand. They conclude that there are vulnerabilities in the IO sector, both from property investors and owner occupied IO loan holders. Overall this is, we estimate, more than $680 billion of the $1.6 trillion mortgage book. They say that tighter lending criteria and rising house prices has meant investors increasingly face net negative cash flows and investors face a growing household cash flow gap and reducing capital gains expectations. The large levels of debt outstanding by borrowers aged in their 50’s and 60’s means many investors will need to sell property to discharge their debts. Owner Occupied IO borrowers are more susceptible to interest rate rises given higher average borrowing levels and higher average loan to value ratios. They concluded “Given the widespread use of IO finance and the reduced prospects of discharging debt via means other than liquidation of portfolio holdings, banks must face an increased risk of mis-selling claims in future years. Mining towns serve as a microcosm of this threat”.

ASIC updated their work on IO loans finding that Australia’s major banks have cut back their interest-only lending by $4.5 billion over the past year. However, other lenders have partially offset this decline by increasing their share of interest-only lending. They say that borrowers who used brokers were more likely to obtain an interest-only loan compared to those who went directly to a lender and borrowers approaching retirement age continue to be provided with a significant number of interest-only owner-occupier loans. Now ASIC will examine individual loan files to ensure that lenders are providing interest-only home loans in appropriate circumstances, to ensure that consumers are not paying for more expensive products that are unsuitable, under the responsible lending provisions.

In this light, it was interesting to listen to some of the Big Bank’s CEO’s in front of the House of Representatives Standing Committee on Economics. Westpac CEO said half of his $400 billion mortgage portfolio was interest only. The other banks were closer to 40%. While both Westpac and ANZ said “we don’t lend to people who can’t pay it back. It doesn’t make sense for us to do so”, the underwriting standards are, we think, way too lose, as the recent regulatory tightening highlights, but it’s probably too late, especially for IO loans which now would fail even the current still generous standards. In an excellent The Conversation article, Richard Holden, Professor of Economics, UNSW rightly highlighted the “Spooky” parallels between our current situation, and the US mortgage market prior to the GFC.  “Australia’s large proportion of five-year interest-only loans – turbocharged by an out-of-control negative-gearing regime – looks spookily similar. It’s one thing for borrowers to do silly things. When it becomes dangerous is when lenders not only facilitate that stupidity, but encourage it. That seems to be what has happened in Australia”.

Smaller lenders are still feeling the pressure, as illustrated by the Bank of Queensland results, which came out this week. While the headline profit was up, underlying growth was lower, and mortgage lending was the key. Net interest margin fell to 1.87%, but was better in 2H. Interest only loans were 40% in 2H16, and 39% in 1H17, but trending down, they say! 8% of loans are higher than 90% LVR on a portfolio basis, and 19% in the 81-90% band.

During their hearing, the big banks also confirmed they had repriced their mortgage back book, especially for interest only and investment loans, but weirdly denied this was to increase profitability.  The quote of the week for me was one CEO saying that people should switch from IO loans to P&I loans “because they were cheaper” – which may be true from a headline interest rate perspective, but the monthly repayments when switching are significantly higher, so in reality, it is not cheaper in cash flow terms!

There was conflicting data relating to Foreign Property Investors, especially from China, with Credit Suisse saying they estimate, based on stamp duty records, that foreign buyers are acquiring the equivalent of 25% of new housing supply in NSW, 17% in Victoria and 8% in Queensland.  If they are correct, this may put a floor on home prices, and they suggest that crackdowns on capital outflows by Chinese authorities appear not have slowed China’s appetite for Australian property.

On the other hand, while the NAB Residential Property Index rose 6 points in Q3, they highlighted lower foreign buying activity in new property markets, VIC saw the share fall to 14.4% (from 20.8% in Q2) and NSW down to 7.8% from 12% in Q2. In contrast, QLD saw a rise to 11.4%, up from 8.6% last quarter. NAB also revised its national house price forecasts, predicting an increase of 3.4% in 2018 (previously 4.3%) and easing to 2.5% in 2019. Unit prices are forecast to rise 0.5% in 2018 (-0.3% previously), with a modest fall expected in 2019.

Our data suggests that Chinese buyers are indeed still active, with a focus on certain postcodes where high-rise units are being built, and often offered direct to overseas buyers. We also see evidence of some high rollers buying larger houses. But overall this is not enough to support home prices into next year.

We published the September update of the Digital Finance Analytics Household Finance Security Index, which underscored the growing gap between employment, which remains relatively strong, and the Financial Security of households. The Index fell from 98.6 in August to 97.5 in September. The state by state view highlights a fall in NSW, while VIC holds higher, and there was a rise in WA from February 2017 lows. This highlights the fact the households across the national are under different levels of pressure. Tracking by age bands we find younger households are significantly less confident, compared with those aged 50-60 years.  But across the board, the general trend is lower.

Similar findings were contained in the latest AlphaWise survey conducted by Morgan Stanley. Income growth has not recovered, ‘cost of living’ inflation is re-accelerating and ‘macro-prudential’-related tightening of credit conditions is extending from housing into consumer finance. They say Australian households are in a vulnerable financial position, especially those who have taken out a mortgage. And in an era of weak incomes growth, soaring energy prices and high levels of indebtedness, with the prospect of higher interest rates on the way, many intend to cut discretionary spending in anticipation of even tighter household budgets. That’s bad news, not only Australia’s retail sector, but also the broader economy. They forecast discretionary consumption volumes will slow to just 0.2% in 2018, dragging overall consumption growth down to 1.1% and well below consensus of 2.5%.

So, in summary the evidence is building that we are entering a concerning episode where growth is likely to be lower, households will remain under pressure, and risks in the system are considerably higher than the RBA is willing to concede. The mystery though is why the regulators are still allowing mortgage lending to grow way faster than inflation, and wages. This surely must be slowed, and soon. Once again, too little too late.

So that’s the Property Imperative Weekly to 14th October. If you found this useful, do leave a comment below, subscribe to receive future updates and check back next week.

Auction Results 14 Oct 2017

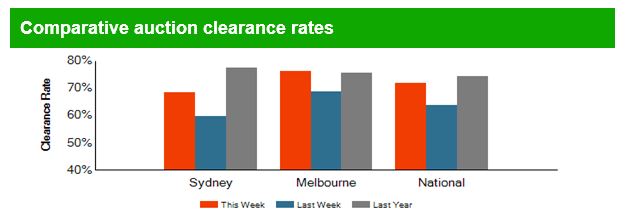
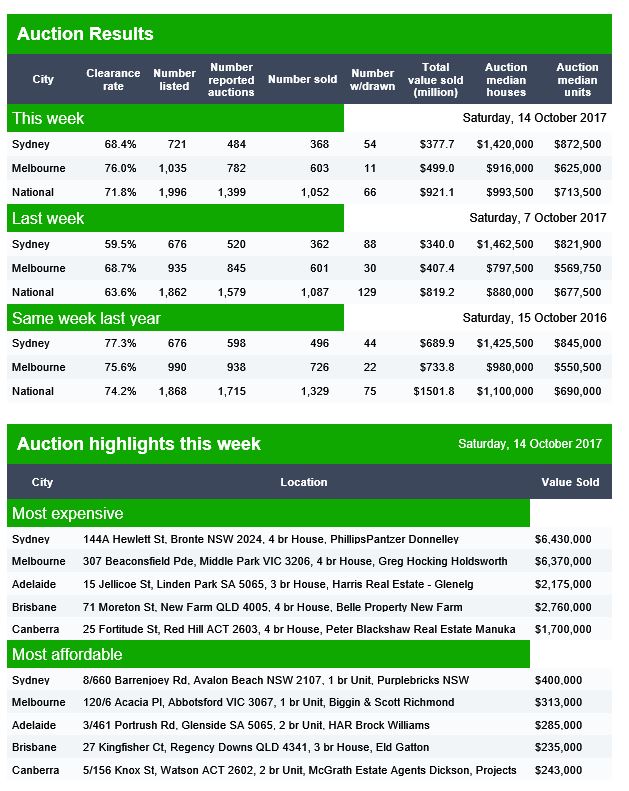
The preliminary auction results are in from Domain. The trend continues with lower volumes but still strong clearance rates in the main centres, and with Melbourne leading the charge.

Away from the Sydney/Melbourne axis, Brisbane cleared 48% of 121 scheduled auctions, Adelaide achieved a 79% result on 72 scheduled auctions and Canberra 68% of 47 scheduled.

Australian investors may be heading towards the ‘cliff edge’ on loan repayments

From Business Insider.

Recent restrictions on interest-only lending have increased concerns around Australian housing stability, if investors are forced to start paying down principal in addition to the interest on their loan.

In a note titled “Cliff edge”, housing expert Pete Wargent said those stricter lending standards have led to speculation an increasing number of borrowers could topple over a “principal and interest cliff” when their interest-only loan expires and they’re unable to roll it over.

Most interest-only loans have a five-year term, at which point it’s rolled over or converts to principal & interest repayments.

“The repayments might be up to 40% or more higher when the principal payments kick in, so household cashflows need to be carefully managed,” Wargent said.

Interest-only lending peaked in 2015 before APRA’s first round of macro-prudential restrictions. In view of that, Wargent expects the highest number of interest-only loan terms will be due to roll over in 2020.

This chart shows Wargent’s estimate of the dollar value of interest-only loans for which borrowers will be forced to convert to principal & interest repayments:

Source: Pete Wargent Daily Blog


As part of macro-prudential measures introduced in March to try and curb property market speculation, APRA put a cap on interest-only lending at 30% of all new loans.

Australian banks also offered no-cost switches into principal & interest repayment plans, and enforced stricter loan to value (LVR) requirements for interest-only borrowers.

Based on those changes, “it’s possible to make a rough assessment or estimate of the value of IO loans falling due approved under conditions that would likely fail today’s underwriting standards”, Wargent said.

The estimates suggest that around $40-55 billion in interest-only loans will come up for renewal between 2018 and 2020.

“By 2016, the share of new interest-only loans in the market had been pared back, and therefore the P&I cliff will also begin to taper off by 2021,” he added.

This chart from Citi provides a good measures of how rampant interest-only lending was in 2015, to borrowers now facing revised loan-terms in 2020.

In the March quarter of 2015, interest-only lending made up almost half of new loan flow:

In a research report released this morning, Citi also calculated that the total value of interest-only loans in Australia currently amounts to approximately $643 billion.

The bulk of interest-only loans are taken up by investment professional for tax benefits. However, Citi also reported a sharp rise in interest only loans taken out between 2011 and 2017 by the “suburban mainstream” — middle income workers and younger families.

Based on those figures, if income growth remains low a number of Australian households could be facing increased pressure from a sharp rise in mortgage costs over the next three years as interest-only loan terms expire.

Wargent expects the changes to suck some “hot air” out of Australia’s property market. “I don’t know if it’s a doomsday scenario, but it will most likely make property less attractive as an asset class”, he told Business Insider.

“In the wash-up, one can’t help but feel that investors that opted for quantity over quality of investment properties might be left staring down the barrel of some unenviable decisions.”

Rising US Rates Will Clip Home Prices Here

Interesting research is contained in a BIS Working Paper “Interest rates and house prices in the United States and around the world“.

They show that home prices are indeed connected to interest rates, and changes in rates do have a flow on effect to prices, and that there are spillover effects, especially relating to interest rates in the USA.

This means that as the FED lifts rates, as is now well signalled, we should expect prices to fall here and in other countries. There may be some delay, the modelling is complex, and the relationships are not straight forward. But it is is worth remembering that in the US real house prices fell by as much as 31% over the course of 2007–09!

This paper estimates the response of house prices in 47 advanced and emerging market economies (EMEs) to changes in short- and long-term interest rates. Our study has four novel aspects. First, we analyse in some detail the impact of short-term interest rates on house prices. Second, we look at the responsiveness of house prices around the world to US interest rates. Third, we use a unique data set on house prices compiled by the BIS in cooperation with national statistical and monetary authorities. And fourth, our empirical framework tries to capture the important role of inertia in house prices.

One striking feature of house price growth is its persistence. With the exception of Germany, Portugal and Switzerland, advanced economies have seen real house prices growing by an average of at least 6% per year for 40 years or longer. In the United States, for instance, this resulted in a 13-fold increase in real house prices over a period of 47 years; in Norway, in a 77-fold increase over 66 years. And in South Africa, real house prices increased nearly 150 times over half a century.

Another way to appreciate the persistence of house prices is to contrast the length of their upswings and downswings. We define an upswing (downswing) as a period of house price increases (decreases) sustained in an individual country for three years or more. Based on this definition, periods of upswing accounted for nearly 80% of the advanced economy sample. The upswings lasted on average 13 years; with the longest one, in Australia, still continuing after half a century. By contrast, downswings accounted for only 8% of the advanced economy sample; they lasted on average five years, and the longest one, in Japan, lasted 13 years. In EMEs, upswings accounted for two thirds of the sample. They lasted on average eight years, and the downswings four years.

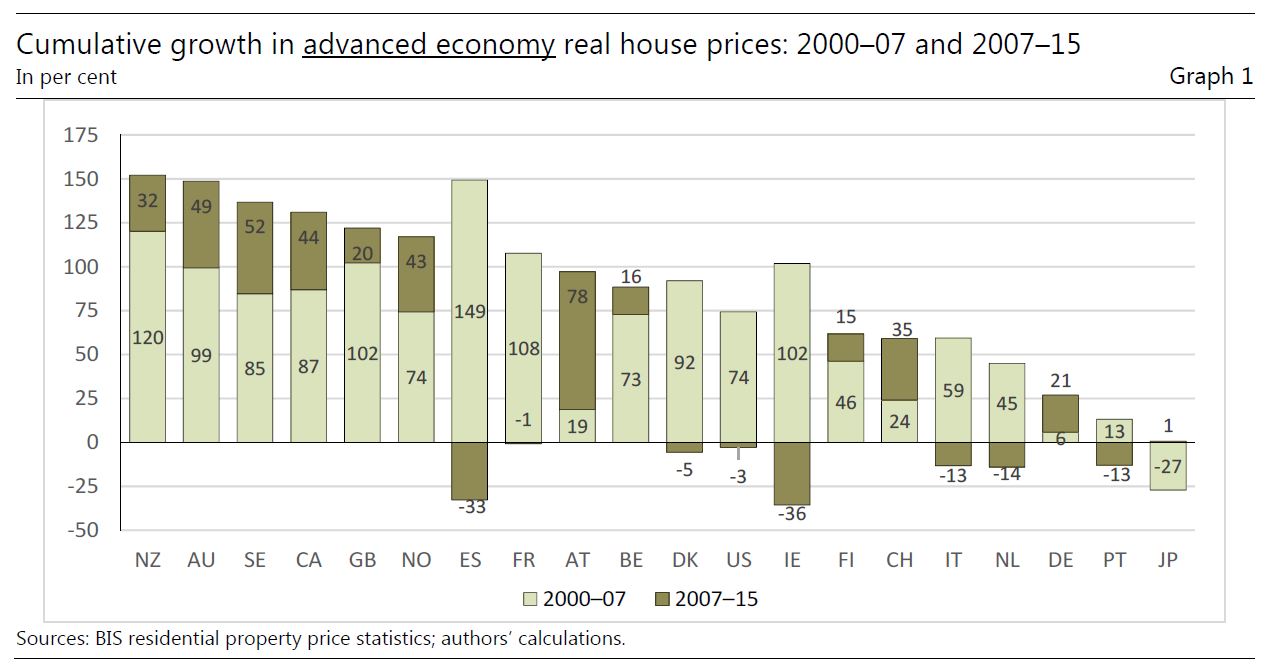
The surge in house prices has been particularly pronounced since the turn of the millennium. Between 2000 and 2015, real house prices increased by 100% or more in half the economies in our sample.  Most countries experienced a housing boom before 2007 (light bar segments). But many have also seen very rapid house price growth since 2007 (dark bar segments). These included Australia, Austria, Canada, the Netherlands, Norway, Sweden and Switzerland among advanced economies; and Brazil, Hong Kong SAR, Israel, Malaysia and Peru among EMEs.

Our focus on short-term interest rates is motivated by their link to monetary policy. As a house is a long-lived asset, the interest rate appropriate for relating the service flow from a house to its price is arguably a long-term rate. However, house prices also depend importantly on ease of access to credit, which is in turn significantly affected by the monetary policy stance. Bernanke and Blinder (1992), for instance, showed that changes in the US federal funds rate were associated with changes in lending by US banks, an effect that has become known as the bank lending channel of monetary policy. Short-term interest rates, which are more closely related to the stance of monetary policy, might therefore be just as important a “fundamental” for house prices as longer-term rates. Indeed, we find a surprisingly important role for short-term interest rates as drivers of house prices, especially outside the United States. Our interpretation is that this reflects an important role for the bank lending channel of monetary policy, especially in countries where securitisation of home mortgages is less prevalent.

The motivation for looking at the responsiveness of house prices around the world to not only domestic but also US interest rates is that the latter have become a key measure of the global cost of financing. We do find spillover effects from US interest rates, both short and long ones, on house prices outside the United States.

Our study draws on the BIS residential property price statistics and, in particular, the “preferred” house price series as identified by national statistical offices or central banks. We compiled over 1,000 annual observations on house prices for the non-US countries in our sample from these series and about a half century of quarterly house prices for the United States. We use these data to estimate the dynamic impact of changes in interest rates and other explanatory variables on real house prices around the world.

Most empirical studies assume that short-term interest rates do not influence house price growth other than through the domestic cost of borrowing, ie by their influence on long-term interest rates. The findings in this paper suggest that this view might be mistaken: changes in short-term interest rates seem to have a strong and persistent impact on house price growth.

Moreover, global, ie US short-term interest rates – not just domestic ones – seem to matter, both in advanced economies and EMEs. We interpret the relative importance of short-term interest rates in driving house prices as indicating an important role for the bank lending channel of monetary policy in determining housing financing conditions, especially outside the United States, where securitisation of home mortgages is less prevalent.

The larger effect of interest rates on house prices we find reflects in part the use in our regressions of a long distributed lag of interest rate changes. For the United States, our estimates for the period from 1970 to the end of 1999 suggest that a 100 basis-point fall in the nominal short-term rate, accompanied by an equivalent fall in the real short-term rate, generated a 5 percentage point rise in real house prices, relative to baseline, after three years. We find an even larger effect if we include the data through end-2015. For other advanced economies and EMEs, we estimate that a 100 basis-point fall in domestic short-term interest rates, combined with an equivalent fall in the US real rate, generates an increase in house prices of up to 3½ percentage points, relative to baseline, after three years. Another reason we find larger interest rate effects is by allowing for inertia in house price movements. We find strong evidence against the random walk hypothesis: real house prices around the world tend to move in the same direction for about a year after being hit by a disturbance, then exhibit a modest reversal.

We think that this inertia in house prices reflects the large search and transaction costs associated with trading residential real estate and shifting between owner-occupied and rental housing. These costs are ignored in the user cost model, which predicts a fairly high interest rate sensitivity for house prices.

Our findings also suggest a potentially important role for monetary policy in countering financial instability. While higher short-term interest rates alone cannot significantly dampen the demand for housing, slower house price growth can give supervisors more time to implement measures to strengthen the financial system. At the same time, the finding that house prices adjust to interest rate changes gradually over time suggests that modest cuts in policy rates are not likely to rapidly fuel house
price bubbles.


Note: BIS Working Papers are written by members of the Monetary and Economic Department of the Bank for International Settlements, and from time to time by other economists, and are published by the Bank. The papers are on subjects of topical interest and are technical in character. The views expressed in them are those of their authors and not necessarily the views of the BIS.

RBA Financial Stability – Move Along, Nothing To See Here….

The latest 62 page edition of the RBA Financial Stability Review has been released, and it continues their line “of some risks, but no worries”. International economic conditions, and business confidence are, they say, on the improve while Australian household balance sheets and the housing market remain a core area of interest. The potential impact of rising rates and flat income are discussed, once again, but little new is added into the mix.

From a financial stability perspective, banks hold more capital, have tightened lending standards, and shadow banking is under control.

The key domestic risks in the Australian financial system continue to stem from household borrowing. Household indebtedness, most of which is mortgage borrowing, is high and gradually rising against a backdrop of low interest rates and weak income growth. While some households have taken advantage of low interest rates to make excess mortgage payments, others have increased their borrowing. Higher interest rates, or falls in income, could see some highly indebted households struggle to service their debt and so curtail their spending.

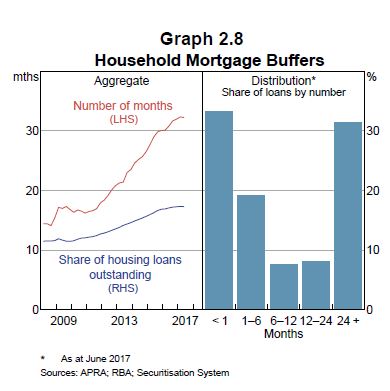
Prepayments are an important dynamic in the Australian mortgage market as they allow households to build a financial buffer to cushion mortgage rate rises or income falls. Aggregate mortgage buffers – balances in offset accounts and redraw facilities – remain around 17 per cent of outstanding loan balances, or over 2½ years of scheduled repayments at current interest rates.

These aggregates, however, mask substantial variation; about one-third of mortgages have less than one months’ buffer Not all of these are vulnerable given some borrowers have fixed rate mortgages that restrict prepayments, and some are investor mortgages where there are incentives to not pay down tax deductible debt. This leaves a smaller share of potentially vulnerable borrowers with new mortgages who have yet to accumulate prepayments, and borrowers who may not be able to afford prepayments. Partial data suggest that the share of households with only small buffers has declined in recent years, in part due to declines in mortgage rates. Households with small buffers also tend to be lower-income or lower-wealth households, which could make them more vulnerable to financial stress.

Household indebtedness is high and, against a backdrop of low interest rates and weak income growth, debt levels relative to income have continued to edge higher. Steps taken by regulators in the past few years to strengthen the resilience of balance sheets, including limiting the pace of growth of investor lending, discouraging loans with high loan-to-valuation ratios (LVRs) and strengthening serviceability metrics, have seen the growth in riskier types of lending moderate. The most recent focus has been on limiting interest-only lending, and banks have responded by further reducing lending with high LVRs for interest-only loans, increasing interest rates for some types of mortgages and significantly reducing interest-only lending.

The tightening of banks’ lending standards for property loans is constraining some households and developers but, in doing so, making the balance sheets of both borrowers and lenders more resilient. Conditions are relatively weak in the Brisbane apartment market, with a large increase in supply reflected in declines in prices and rents. There are, however, few signs of significant settlement difficulties to date. More generally, while housing market conditions vary across the country, there are signs of easing of late, particularly in Sydney and Melbourne where conditions have been strongest.

With the tightening of lending standards, there is a potential that riskier lending migrates into the non-bank sector. To date, non-bank financial institutions’ residential mortgage lending has remained small though their lending for property development has picked up recently. While the banking system has minimal exposure to the non-bank financial sector, growth in finance outside the regulated sector is an area to watch.

Here are some of the other nuggets:

Very low interest rates have also contributed to strong growth in property prices internationally as investors search for yield. To the extent that prices have moved beyond what their underlying determinants suggest, this increases the risk of sharp price falls if interest rates were to rise suddenly or if risk sentiment were to deteriorate.

While household debt levels are high, and rising, to date the impact on households’ ability to service their debt has been muted by falls in interest rates to historically low levels. Nonetheless, highly indebted households are more likely to struggle to repay their debts, or substantially reduce their consumption, in response to a negative shock, such as a rise in unemployment, an unexpectedly large increase in interest rates or a sharp fall in housing prices.

The distribution of debt is also important in identifying where risks lie as typically it is not the ‘average’ household that gets into financial In Canada and Sweden, for example, the risks from high household debt may be heightened since the debt is concentrated among younger and low‑to-middle-income households, who are likely to be more vulnerable
to negative shocks.

Further, interest-only (IO) lending has been identified as increasing risks in some jurisdictions.4 Households with IO loans remain more indebted throughout the life of the loan than if they had been paying down the loan principal, making them more vulnerable to higher interest rates, reduced income, or lower housing prices. Such households are also more vulnerable to ‘payment shock’ due to the increase in repayments following the end of the interest-only period of the loan.

Global experience is that the culture within banks can have a major bearing on how a wide range of risks are identified and managed. There have been a number of examples where the absence of strong positive culture has given rise to a deterioration in asset performance, misconduct and loss of public trust. In Australia, there have also been examples of weak internal controls causing difficulties for some banks. These include in the areas of life insurance, wealth management and, more recently, retail banking. In August, AUSTRAC (the Australian Transaction Reports and Analysis Centre) initiated civil proceedings against the Commonwealth Bank of Australia for breaches of the Anti-Money Laundering and Counter-Terrorism Financing Act 2006. In the current environment where investors still expect high rates of return, despite regulatory and other changes that have reduced bank ROE, banks need to be careful of taking on more risk to boost returns.

A central element to address this issue is to ensure that banks build strong risk cultures and governance frameworks. Regulators have therefore heightened their focus on culture and the industry is taking steps to improve in this area.

Households Spending Less On Housing…But

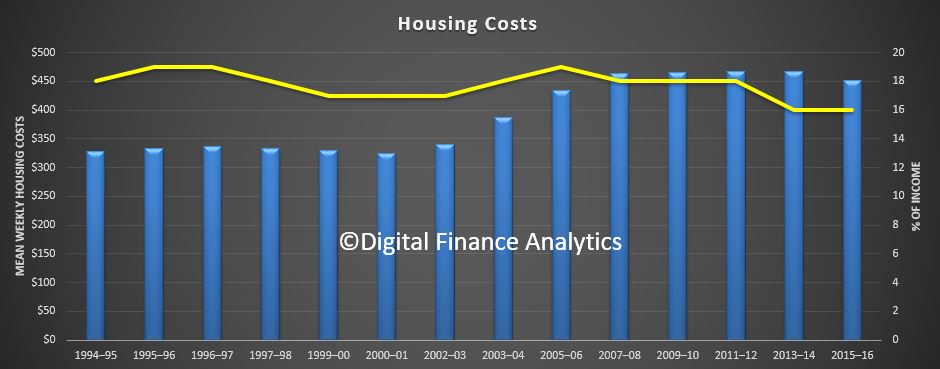
Data from the ABS today – Housing Occupancy and Costs – highlights the average household with an owner occupied mortgage is paying around $450 a week, slightly lower than the peak a couple of years ago.  This equates to around 16% of gross household income, on average.

This does not include repayments on investment properties of course (and many households have multiple properties as investing in property rises).

But of course, the true story is interest rates have fallen to all time lows, allowing people to borrow more, as prices rise. As a result, should interest rates start to bite, this will cause real pain. Then of course we have recent flat wage growth, in real terms, in the past couple of years.

Also, households have a bigger mortgage for longer, which is great for the banks, but not helpful from a household perspective, as it erodes savings into retirement and more older Australians are still borrowing. And of course the current high home prices show a paper profit, but that could be eroded if prices slide.

Thus, the ABS data should not be interpreted as everything is fine, it is not! In fact, underwriting standards should be much tighter now, as we highlighted this morning, Australian Banks are willing to go up to around 6 times income, higher than many other countries, with similar home price bubbles.

The proportion of income mortgagees are using for housing has declined over the last decade, according to new figures released today by the Australian Bureau of Statistics (ABS).

“In 2005-06, owners with a mortgage paid 19 per cent of their total household income on housing costs. By 2015-16 this had fallen to 16 per cent. This is likely driven by lower interest rates coupled with growth in household incomes over the last decade, ” Dean Adams, Director of Household Characteristics and Social Reporting, said.

In 2005-06, owners with a mortgage paid $434 per week in housing costs, similar to the $452 paid in 2015-16 in real terms. But over the same period, average total household incomes for mortgagees rose from $2,272 to $2,759 per week.

“Mortgage and property values have also increased in the last decade. Ten years ago, the real median mortgage value was $171,000 which rose to $230,000 in 2015-16. Meanwhile, the real median dwelling value increased from $449,000 to $520,000,” Mr Adams explained.

Going back another decade, the results also reveal that households are entering into a mortgage at older ages. The proportion of younger households (with a reference person aged under 35 years) represented 69 per cent of first home buyers in 1995-96 which dropped to 63 per cent by 2015-16.

“Having a mortgage is now the most common form of ownership for households whose reference person was aged between 35 and 54 years. Among this group, ownership with a mortgage increased by 15 percentage points over the last two decades, from 41 per cent to 56 per cent. Meanwhile, the rate of outright ownership in 2015-16 (12 per cent) was one-third the 1995-96 rate (36 per cent),” Mr Adams said.

The rate of older households (with a reference person aged 55 years and over) who were still paying off a mortgage has tripled between 1995-96 and 2015-16 (from 7 per cent to 21 per cent). Older households are spending more of their income on housing costs than two decades ago, increasing from 8 per cent to 14 per cent for those aged between 55 and 64, and from 5 per cent to 9 per cent for those aged 65 and over.