CBA goes into damage control over claims of primary school ‘kickbacks’

From The New Daily.

The Commonwealth Bank of Australia has promised to scrap a controversial practice that sees it pay primary schools a commission for every student that signs up to its Dollarmites program.

The decision came just hours after consumer advocacy group CHOICE launched a scathing attack on school banking programs, saying banks should be banned from “flogging their products” in schools.

CHOICE was particularly critical of what it called “kickbacks” paid to participating schools.

But within hours of CHOICE’s attack, CBA – in an effort to fend off yet more bad press – had issued a statement of its own vowing to abolish these so-called “kickbacks”.

“We have heard CHOICE’s concerns about these payments and will engage with the schools, P&Cs [parent and citizens associations] and consumer groups to introduce a change to the way payments are structured from 1 January 2018 that no longer links the payment to the value of students’ deposits,” the statement read.

The bank stopped short of scrapping payments to schools altogether, arguing some sort of payment was necessary to cover the costs to schools of offering the program.

How the Dollarmites program works

CBA’s School Banking program allows primary school children to set up bank accounts through their schools.

The program appeals to children using colourful branding, including a gang of cartoon school kids called the ‘Dollarmites’, gifts, and games aimed at improving financial literacy.

It also incentivises schools to participate by paying them a 5 per cent commission on every deposit up to $10.

Around 4000 schools and 320,000 school kids across Australia are signed up to the program.

The bank sells it as a “fun, interactive and engaging way for young Australians to learn about money and develop good saving habits”.

But in a statement on Thursday, CHOICE chief executive Alan Kirkland painted the program in a more critical light, saying it was a way for the bank to gain “unfettered access” to “flog their products” in schools.

“Rewarding children for saving with cheap toys easily transitions to rewarding young adults with ‘special’ offers of high-interest personal loans and credit cards,” he said.

“It is time to take banks out of financial literacy education, and to stop them from paying schools commissions to flog their products.”

The call was part of a submission to the Productivity Commission’s ongoing inquiry into competition in the Australian financial system.

Of the big four banks, Westpac is the only other that operates a schools program.

A spokesperson for Westpac told The New Daily it does not pay commissions to schools.

ANZ and NAB both said they had no presence in schools.

CBA desperate to avoid more bad press

The Commonwealth Bank’s lightning-quick response comes two months after the bank was embroiled in a money-laundering scandal – its third major scandal of the decade – and reflects the CBA’s growing eagerness to avoid any bad press.

In August, anti-money laundering regulator AUSTRAC launched civil proceedings against CBA in the Federal Court for an alleged 53,700 “serious and systemic” breaches of money laundering and counter-terrorism legislation.

The allegations came on top of similarly high-profile scandals in the bank’s financial advice and life insurance businesses, all of which occurred under the watch of chief executive Ian Narev.

Since the AUSTRAC revelations, CBA has taken a number of bold steps to improve its public image – including announcing the deferred departure of Mr Narev next year, and scrapping ATM fees for non-customers.

Labor’s plan to hold a royal commission into the banking system if it wins the next election – which current polls suggest it will – is putting additional pressure on the banks.

Retail Turnover On The Slide

More evidence of strained household budgets with the release today of the August 2017 ABS data on Retail Turnover.

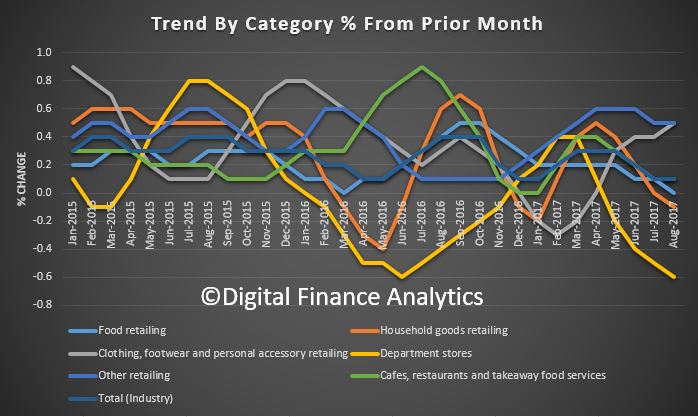
Australian retail turnover fell 0.6 per cent in August 2017, seasonally adjusted, according to the latest Australian Bureau of Statistics (ABS) Retail Trade figures. This follows a fall of 0.2 per cent in July 2017.

In seasonally adjusted terms, there were falls in food retailing (-0.6 per cent), cafes, restaurants and takeaway food services (-1.3 per cent), household goods retailing (-1.0 per cent) and clothing, footwear and personal accessory retailing (-0.2 per cent). There were rises in department stores (0.7 per cent) and other retailing (0.1 per cent) in August 2017.

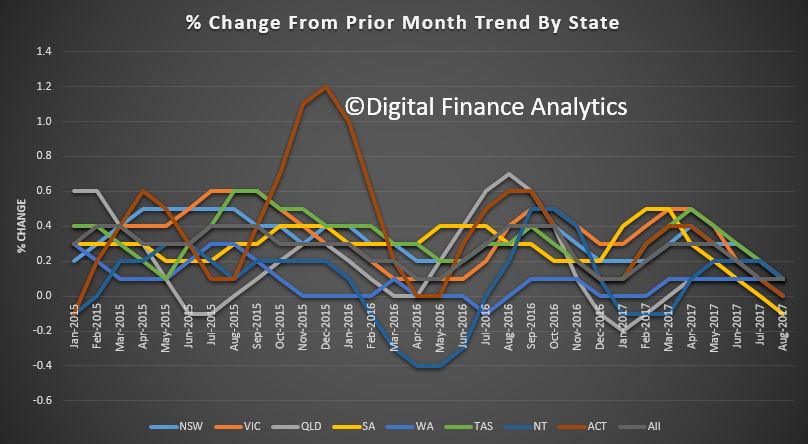
In seasonally adjusted terms, there were falls in all states and territories. “Victoria (-0.8 per cent) and Queensland (-0.8 per cent) led the falls,” said Ben James, Director of Quarterly Economy Wide surveys.

“There were also falls in New South Wales (-0.2 per cent), Western Australia (-0.6 per cent), South Australia (-0.6 per cent), the Australian Capital Territory (-0.8 per cent), Tasmania (-0.7 per cent) and the Northern Territory (-0.7 per cent).”

The trend estimate which irons out the bumps was a little more sanguine, with retail turnover rising 0.1 per cent in August 2017 following a 0.1 per cent rise in July 2017. Compared to August 2016, the trend estimate rose 2.8 per cent.

Some significant state variations, but overall direction is clearly down.

Online retail turnover contributed 4.6 per cent to total retail turnover in original terms.

More evidence of stressed household budgets, which is no surprise given the current economic settings.

Are IO Households Aware They Have IO Loans?

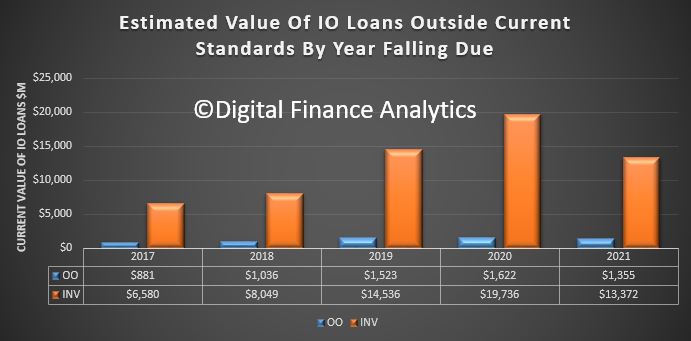
DFA analysis shows that over the next few years a considerable number of interest only loans (IO) which come up for review, will fail current underwriting standards.  So households will be forced to switch to more expensive P&I loans, assuming they find a lender, or even sell. The same drama played out in the UK a couple of years ago when they brought in tighter restrictions on IO loans.  The value of loans is significant. And may be understated, according to new research.

A few observations. ASIC in 2015, released a report that found lenders providing interest-only mortgages needed to lift their standards to meet important consumer protection laws. They identified a number of issues relating to bank underwriting practices. We would also make the point that despite the low losses on interest-only loans to date in Australia, in a downturn they are more vulnerable to credit loss.

In April this year we addressed the problem of IO loans.

Lenders need to throttle back new interest only loans. But this raises an important question. What happens when existing IO loans are refinanced?

Less than half of current borrowers have complete plans as to how to repay the principle amount.

Interest-only loans may seem like a convenient way to reduce monthly repayments, (and keep the interest charges as high as possible as a tax hedge), but at some time the chickens have to come home to roost, and the capital amount will need to be repaid.

Many loans are set on an interest-only basis for a set 5 year term, at which point the lender is required to reassess the loan and to determine whether it should be rolled on the same basis. Indeed the recent APRA guidelines contained some explicit guidance:

For interest-only loans, APRA expects ADIs to assess the ability of the borrower to meet future repayments on a principal and interest basis for the specific term over which the principal and interest repayments apply, excluding the interest-only period

We concluded:

This is important because the number of interest-only loans is rising again. Here is APRA data showing that about one quarter of all loans on the books of the banks are interest-only, and that recently, after a fall, the number of new interest-only loans is on the rise – around 35% – from a peak of 40% in mid 2015. There is a strong correlation between interest-only and investment mortgages, so they tend to grow together. Worth reading the recent ASIC commentary on broker originated interest-only loans.

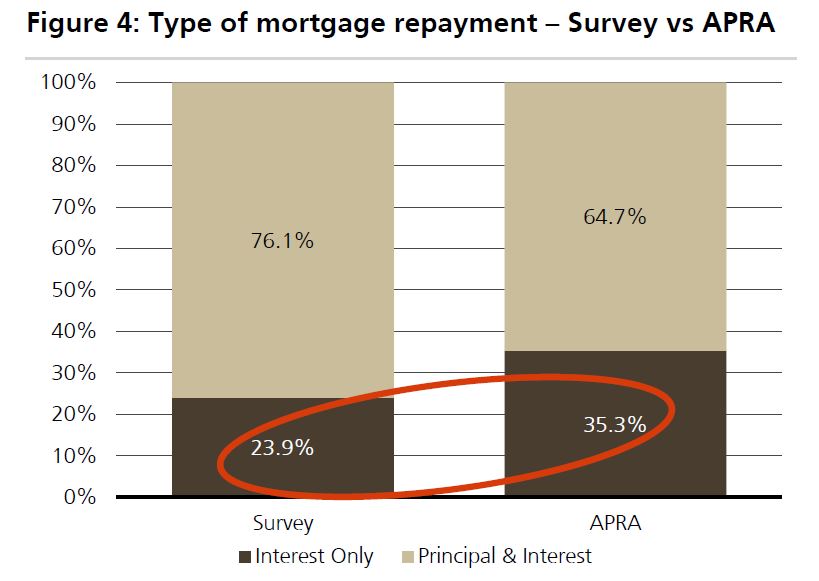
But if households are not aware they have IO loans in the first place, then this raises the systemic risks to a whole new level. The findings from the follow-up study by UBS, after their “Liar-Loans” report (using their online survey of 907 Australians who recently took out a mortgage – they claim a sampling error of just +/-3.18% at a 95% confidence level) are significant.

They say their survey showed that only 23.9% of respondents (by value) took out an interest only loan in the last twelve months. This compares to APRA statistics which showed that 35.3% of loan approvals in the year to June were interest only.

They believe the most likely explanation for the lack of respondents
indicating they have IO mortgages is that many customers may be
unaware that they have taken out an interest only mortgage. In fact, around 1/3 of interest only borrowers do not know that they have this style of mortgage.

Source: UBS

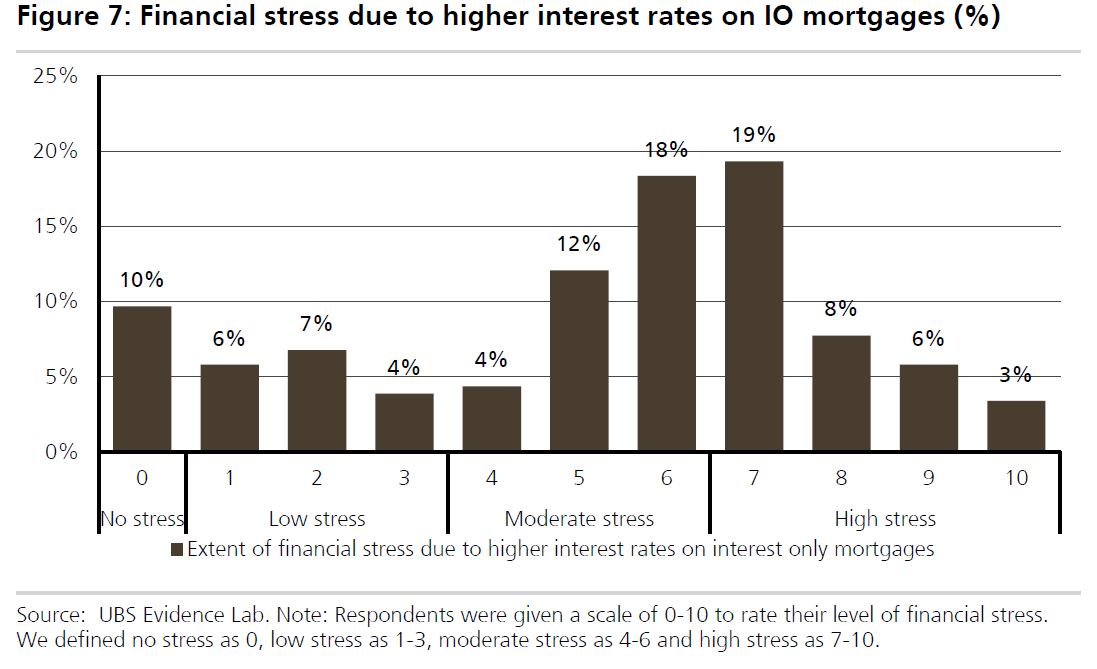
They also says 71% of respondents who took out an interest only mortgage during the last 12 months indicated they are already under moderate to high levels of financial stress.

Source: UBS

Finally, they found that Interest Only borrowers via the broker channel are more likely to be under high financial stress from recent rate rises.


The black swan turns pale

From Capital and Conflict.

For a few months we’ve been following the story of Australia’s housing bubble with new interest. It’s the potential crisis on no European’s screen. Which is concerning given the level of funding which Europe supplies to some of the world’s largest banks Down Under.

The issue in Australia is surprisingly similar to the sub-prime story in the US. And everyone agrees it’s all about land prices at the core.

Which is odd given the amount of land Australia has. But even that is up for debate if you read the papers.

Let’s turn to a more interesting angle in this Capital & Conflict.

How big is the Australian housing bubble? Capital Economics calculated that, based on a median house price to income ratio, Australian houses are about 38% overvalued. Which happens to be far worse than the US’s 30% in 2006.

ABC News reassured its readers that this time is different and Australia is special:

However, he noted that this measure does not take into account the long-term lower level of interest rates and therefore the bigger amount people can comfortably borrow and the lower rental returns investors demand.

This is morbidly hilarious. Rising interest rates happen, which increases the risk, not decreases it. Something that will only temporarily be affordable is not affordable and won’t benefit the buyer in the end.

Not only that, but rising rates are precisely what popped the sub-prime bubble, so it should be obvious that low rates are dangerous.

The latest development is a remarkable survey from Finder.com.au on just this issue. Australian Broker reports:

A staggering 57% of mortgage holders could not handle a $100 increase in their [monthly] loan repayments, according to new research by Finder.com.au.

This additional $100 is equivalent to an interest rate rise of just 0.45% based on the national average mortgage of $360,600. This means the average standard variable rate of 4.83% would only have to rise to 5.28% to put more than half of mortgage holders in stress.

Not only are Australians walking a tightrope on their repayments, but 39% of mortgages are interest only. A hit to house prices could spell disaster.

Surprisingly, it’s the wealthy that are in trouble. Martin North of Digital Finance Analytics tracks mortgage stress by suburb. And it’s the famously wealthy ones that are showing signs of distress.

Never forget how small a problem the US’s sub-prime bubble looked in 2007. Australia’s house price bubble is brewing trouble for you.

Auction Activity Takes a Back Seat to Grand Finals and Long Weekend Festivities

From CoreLogic.

The combined capital cities saw significantly fewer auctions this week, with a total of 953 auctions held; the lower activity a result of most states being host to a long weekend as well as both the AFL and NRL grand finals taking place. Despite lower auction volumes, clearance rates held firm, returning a preliminary result of 69.4 per cent, rising from the 66.2 per cent last week when final results saw volumes reach their highest level since May this year (2,782).

Melbourne was the main driver of the strong clearance, with a preliminary result just under 90 per cent.  Over the same week last year, activity was equally subdued, with 872 auctions held and 75.8 per cent successful.  Brisbane was the only capital city to see a rise in volumes week-on-week.

2017-10-01--auctionresultscapitalcities

An Interesting Perspective On Financial Inclusion

Interesting speech from Frank Elderson, Executive Director of the Netherlands Bank, highlighting some of the risks attached to the digital revolution and the impact on potentially excluded households. For example, losing access to bank branches, or ATMs, the impact of big data and the complexity of banking products. This perspective is important.

We still face challenges here in the Netherlands. Although these challenges are of a very different order to those in many other parts of the world. That’s because in the Netherlands, a lot is already very well arranged. For example, we have a stable system of payments, and everyone has access to financial products and services, such as bank accounts, insurance and pensions. Over 99% of Dutch citizens have a bank account.

Plus, in the Netherlands, we also devote a lot of attention to financial education, another important aspect of financial inclusion. You also play a big role in this respect. These initiatives include the Money Week project for primary school pupils, the Money Wise platform, as well as the activities of Child and Youth Finance International.

Yet there’s another aspect of financial inclusion I’d like to see us pay more attention to in this country: resilience. We strive for financially resilient consumers in society. Consumers should, in order to be resilient, make prudent and sound decisions. That’s one aspect on which we still have much work to do in the Netherlands. It is apparent in several areas. Let me give you a few examples:

National issue #1: vulnerable groups

For one, the impact of innovation, and the widespread digitization of financial products and services. This development means that many more people are now able to gain access to, for instance, insurance and banking services for the very first time. It’s fantastic to see what innovation can deliver in this respect.

However, in the Netherlands we have seen how innovation has also led to certain sections of society becoming more financially vulnerable. This is due to banks closing more of their branches and reducing the number of ATMs. At the same time, the new products and services that FinTech companies offer are sometimes still inaccessible for certain groups. These include the elderly, the handicapped, and people with low digital literacy.
These days, innovative firms focus on specific or younger target groups.

The early adopters. This is a logical business strategy. However, during this transition we must also consider the needs of more vulnerable groups. After all, access to these products and services should be available to everyone. While we are dismantling old systems and introducing new ones, the vulnerable among us may not always be able to keep up.

They run a risk of becoming disenfranchised – a risk of being left out in the cold.

National issue #2: exclusion

The second development I’d like to call your attention to under the aegis of ‘financial resilience’ is the use of data analysis to make services more personalised. Again, we can see how this has had a very positive impact internationally. For example, if a financial service provider, based on data analysis, can see a customer is reliable, then such service provider is more likely to grant that person a loan to set up a small business.

But there is also another darker to this coin, also in The Netherlands. In addition to the potential violation of privacy, data analysis can also lead to the exclusion of some customers. They may, for example, be excluded from certain financial services, if, by shrewdly combining various databases, it becomes clear that they have a high risk profile, or low profit expectations.

National issue #3: understanding

The third and final aspect of financial resilience I’d like to discuss concerns people’s understanding of financial products. Getting a mortgage or choosing a pension is not an easy process. The information provided is often highly complex. If someone takes out a mortgage they can’t afford, or chooses the wrong pension, it can lead to serious financial problems.

The combination of honest communication and understandable products is an important concern in this respect.

‘Consider the vulnerable people’

I’m sure you’re familiar with these examples. But I’ve mentioned them for a very good reason. When you’re designing a product or a service, I urge you, as representatives of the financial sector, to please always stop and ask yourself the question: “have I considered the more vulnerable people
among us?”

Rising Household Debt: What It Means for Growth and Stability

From The IMFBlog.

Whilst increased household debt gives an economy a boost in the short term, the IMF has found it creates greater risk 3-5 years later, lifting the potential for a financial crisis, as household struggle to repay.  Given the ultra-high debt levels in Australia, this is an important observation.

Debt greases the wheels of the economy. It allows individuals to make big investments today–like buying a house or going to college – by pledging some of their future earnings.

That’s all fine in theory. But as the global financial crisis showed, rapid growth in household debt – especially mortgages – can be dangerous.

A new IMF study takes a close look at the likely consequences of growth in household debt for different types of economies, as well as steps that policy makers can take to mitigate these consequences and to keep debt within reasonable limits. The overall message: there is a tradeoff between the short-term benefits and the medium-term costs of rising debt, but there is plenty that policymakers can do to ease this tradeoff, according to Chapter Two of the IMF’s October 2017 Global Financial Stability Report.

Given the widespread misery the crisis caused, you might think people have become skittish about borrowing more. Surprisingly, that’s not the case. Since 2008, household debt as a proportion of gross domestic product has grown significantly in a sample of 80 countries. Among advanced economies, the median debt ratio rose to 63 percent last year from 52 percent in 2008. Among emerging economies, it increased to 21 percent from 15 percent.

Reversal of fortune

In the short term, an increase in the ratio of household debt is likely to boost economic growth and employment, our study finds. But in three to five years, those effects are reversed; growth is slower than it would have been otherwise, and the odds of a financial crisis increase. These effects are stronger at the higher levels of debt typical of advanced economies, and weaker at lower levels prevailing in emerging markets.

What’s the reason for the tradeoff? At first, households take on more debt to buy things like new homes and cars. That gives the economy a short-term boost as automakers and home builders hire more workers. But later, highly indebted households may need to cut back on spending to repay their loans. That’s a drag on growth. And as the 2008 crisis demonstrated, a sudden economic shock – such as a decline in home prices–can trigger a spiral of credit defaults that shakes the foundations of the financial system.

More specifically, our study found that a 5 percentage-point increase in the ratio of household debt to GDP over a three-year period forecasts a 1.25 percentage-point decline in inflation-adjusted growth three years in the future. Higher debt is associated with significantly higher unemployment up to four years ahead. And a 1 percentage point increase in debt raises the odds of a future banking crisis by about 1 percentage point. That’s a significant increase, when you consider that the probability of a crisis is 3.5 percent, even without any increase in debt.

The good news is that policy makers have ways to reduce risks. Countries with less external debt and floating exchange rates, and which are financially more developed, are better placed to weather the consequences.

Mitigating risks

Better financial-sector regulations and lower income inequality also help. But this is not the end of the story. Countries can also mitigate the risks by taking measures that moderate the growth of household debt, such as modifying the down payment required to purchase a house or the fraction of a household income that can be devoted to debt repayments. So, good policies, institutions, and regulations make a difference – even in countries with high ratios of household debt to GDP. And countries with poor policies are more vulnerable – even if their initial levels of household debt are low.

Australian household electricity prices may be 25% higher than official reports

From The Conversation.

The International Energy Agency (IEA) may be underestimating Australian household energy bills by 25% because of a lack of accurate data from the federal government.

The Paris-based IEA produces official quarterly energy statistics for the 30 member nations of the Organisation for Economic Cooperation and Development (OECD), on which policymakers and researchers rely heavily. But to provide this service, the IEA relies on member countries to provide it with good-quality data.

Last month, the agency published its annual summary report, Key World Statistics, which reported that Australian households have the 11th most expensive electricity prices in the OECD.

But other studies – notably the Thwaites report into Victorian energy prices – have reported that households are typically paying significantly more than the official estimates. In fact, if South Australia were a country it would have the highest energy prices in the OECD, and typical households in New South Wales, Queensland or Victoria would be in the top five.

A spokesperson for the federal Department of Environment and Energy, the agency responsible for providing electricity price data to the IEA, told The Conversation:

Household electricity prices data for Australia are sourced from the Australian Energy Market Commission annual Residential electricity price trends report. The national average price is used, with GST added. It is a weighted average based on the number of household connections in each jurisdiction.

The Australian energy statistics are the basis for the Australia data reported by the IEA in their Key world energy statistics. The Department of the Environment and Energy submits the data to the IEA each September. Some adjustments are made to the AES data to conform with IEA reporting requirements.

But it is clear that the electricity price data for Australia published by the IEA is at least occasionally of poor quality.

The Australian household electricity series in the IEA’s authoritative Energy Prices and Taxes quarterly statistical report stopped in 2004, and only resumed again again in 2012.

Between 2012 and 2016, the IEA’s reported residential price series data for Australia showed no change in prices.

Yet the Australian Bureau of Statistics’ electricity price index, which is based on customer surveys, showed a roughly 20% increase in the All Australia electricity price index over this period.

Australia is also the only OECD nation not to report electricity prices paid by industry.

Current prices

This year’s reported household average electricity prices are almost certainly wrong too. The IEA reports that household electricity prices in Australia for the first quarter of 2017 were US20.2c per kWh.

At a market exchange rate of US79c to the Australian dollar, this puts Australian household electricity prices at AU28c per kWh. Adjusted for the purchasing power of each currency, the comparable price is AU29c per kWh.

By contrast, the independent review of the Victorian energy sector chaired by John Thwaites surveyed the real energy prices paid by customers, as evidenced by their bills. In a sample of 686 Victorian households, those with energy consumption close to the median value were paying an average of AU35c per kWh in the first quarter of 2017. This is 25% more than the IEA’s official estimate. At least part of this difference is explained by the AEMC’s assumption that all customers in a competitive retail market are supplied on their retailers’ cheapest offers. But this is not the case in reality.

Surveying real electricity and gas bills drastically reduces the range of assumptions that need to be made to estimate the price paid by a representative customer. Indeed, as long as the sample of bills is representative of the population, a survey based on actual bills produces a reliable estimate of representative prices in retail markets characterised by high levels of price dispersion, as Australia’s retail electricity markets are.

Pointing to a reliable estimate of Victoria’s representative residential price is, of course, not enough to prove that the IEA’s estimate is wrong. It could just as easily mean that Victorians are paying way more than the national average for their electricity.

But the idea that Victorians are paying more than average does not stack up when we look at the state-by-state data, which suggests that Victoria is actually somewhere in the middle. Judging by the prices charged by the three largest retailers in each state and territory, Victorian householders are paying about the same as those in New South Wales and Queensland, less than those in South Australia, and more than those in Tasmania, the Northern Territory, Western Australia and the Australian Capital Territory.

Residential electricity prices. Author provided

The IEA can not reasonably be blamed for the inadequate residential data for Australia that they report, and the nonexistent data on electricity prices paid by Australia’s industrial customers. The IEA does not do its own calculation of prices in each country, but rather it relies on price estimates from official sources in those countries.

An obvious question that arises from this is where Australia really ranks internationally if we used prices that reflect what households are actually paying.

This is contentious, not least because prices in New South Wales, Queensland and South Australia increased – typically around 15% or more – from July this year. We do not know how prices have changed in other OECD member countries since the IEA’s recent publication (which covered prices for the first quarter of 2017). But we do know that prices in Australia have been far more volatile than in any other OECD country.

Assuming that other countries’ prices are roughly the same as they were in the first quarter of 2017, our estimate using the IEA’s data is that the typical household in South Australia is paying more than the typical household in any other OECD country. The typical household in New South Wales, Queensland or Victoria is paying a price that ranks in the top five.

It should also be remembered that these prices are after excise and sale tax. Taxes on electricity supply in Australia are low by OECD standards – so if we use pre-tax prices, Australian households move even higher up the list.

There are serious question marks over Australia’s official electricity price reporting. Policy makers, consumers and the public have a right to expect better.

Author: Bruce Mountain, Director, Carbon and Energy Markets., Victoria University 

RBA Holds Cash Rate (14th Month)

At its meeting today, the Board decided to leave the cash rate unchanged at 1.50 per cent.

Conditions in the global economy have improved. Labour markets have tightened and above-trend growth is expected in a number of advanced economies, although uncertainties remain. Growth in the Chinese economy is being supported by increased spending on infrastructure and property construction, with the high level of debt continuing to present a medium-term risk. Australia’s terms of trade are expected to decline in the period ahead but remain at relatively high levels.

Wage growth remains low in most countries, as does core inflation. Headline inflation rates are generally lower than at the start of the year, largely reflecting the earlier decline in oil prices. In the United States, the Federal Reserve has indicated that it will begin the process of balance sheet normalisation in October and that it expects to increase interest rates further. In the other major economies, there is no longer an expectation of additional monetary easing. Financial markets have been functioning effectively and volatility remains low.

The Australian economy expanded by 0.8 per cent in the June quarter. This outcome and other recent data are consistent with the Bank’s expectation that growth in the Australian economy will gradually pick up over the coming year.

Over recent months there have been more consistent signs that non-mining business investment is picking up. A consolidation of this trend would be a welcome development. Business conditions as reported in surveys are at a high level and capacity utilisation has risen. A large pipeline of infrastructure investment is also supporting the outlook. Against this, slow growth in real wages and high levels of household debt are likely to constrain growth in household spending.

Employment has continued to grow strongly over recent months. Employment has increased in all states and has been accompanied by a rise in labour force participation. The various forward-looking indicators point to solid growth in employment over the period ahead, although the unemployment rate is expected to decline only gradually over the next couple of years.

Wage growth remains low. This is likely to continue for a while yet, although the stronger conditions in the labour market should see some lift in wage growth over time. Inflation also remains low and is expected to pick up gradually as the economy strengthens.

The Australian dollar has appreciated since mid year, partly reflecting a lower US dollar. The higher exchange rate is expected to contribute to continued subdued price pressures in the economy. It is also weighing on the outlook for output and employment. An appreciating exchange rate would be expected to result in a slower pick-up in economic activity and inflation than currently forecast.

Growth in housing debt has been outpacing the slow growth in household incomes for some time. To address the medium-term risks associated with high and rising household indebtedness, APRA has introduced a number of supervisory measures. Following some tightening in credit conditions, growth in borrowing by investors has slowed a little recently. In the housing market, conditions continue to vary considerably around the country. Housing prices have been rising briskly in some markets, while in others they have been declining. In Sydney, where prices have increased significantly, there have been further signs that conditions are easing. In the eastern capital cities, a considerable additional supply of apartments is scheduled to come on stream over the next couple of years. Rent increases remain low in most cities.

The low level of interest rates is continuing to support the Australian economy. Taking account of the available information, the Board judged that holding the stance of monetary policy unchanged at this meeting would be consistent with sustainable growth in the economy and achieving the inflation target over time.

Trend dwelling approvals rise 1.1 per cent in August

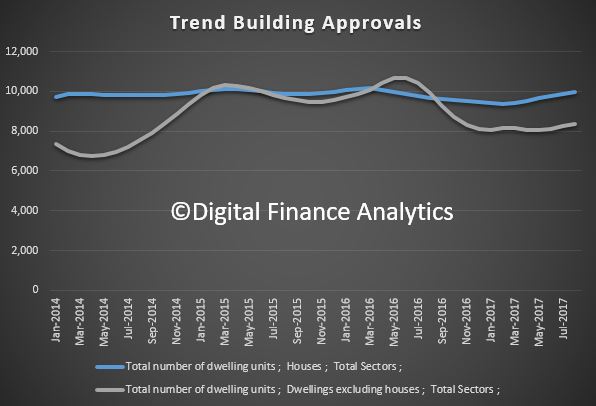
The number of dwellings approved rose 1.1 per cent in August 2017, in trend terms, and has risen for seven months, according to data released by the Australian Bureau of Statistics (ABS) today.

In trend terms, approvals for private sector houses rose 0.9 per cent in August. Private sector house approvals rose in Queensland (2.0 per cent), South Australia (1.4 per cent), Victoria (1.1 per cent) and Western Australia (0.3 per cent), but fell in New South Wales (0.3 per cent).


Dwelling approvals increased in August in the Australian Capital Territory (8.9 per cent), Northern Territory (8.3 per cent), Victoria (1.5 per cent), Tasmania (1.2 per cent), Queensland (1.0 per cent), South Australia (0.9 per cent) and New South Wales (0.7 per cent), but decreased in Western Australia (0.8 per cent) in trend terms.

“Dwelling approvals have shown signs of strength in recent months, although are still below the record high in 2016,” said Bill Becker, Assistant Director of Construction Statistics at the ABS. “The August 2017 data showed that the number of dwellings approved is now 6.5 per cent lower than in the same month last year, in trend terms.”

In seasonally adjusted terms, dwelling approvals increased by 0.4 per cent in August, driven by a rise in private dwellings excluding houses (4.8 per cent), while private house approvals fell 0.6 per cent.

The value of total building approved fell 0.3 per cent in August, in trend terms, after rising for six months. The value of residential building rose 0.7 per cent while non-residential building fell 1.8 per cent.