Data Shows Mortgage Rates Vary Within The Same Post Code

New research from HashChing and Digital Finance Analytics shows a
massive discrepancy in home loan interest rates across NSW, with vast differences in rates even within the same suburbs.

Data shows that in some cases, neighbours are paying up to $87,027 more for new owner occupied loans (105 basis point disparity), and $201,704 more for refinanced owner occupied loans (235 basis point disparity). The calculation is based on an average home loan of $500,000 over 25 years.

Those borrowers paying higher rates are essentially adding an extra three years of mortgage repayments (34 months) compared to those on a lower rate.

According to Mandeep Sodhi, CEO of online mortgage marketplace HashChing, borrowers are more empowered to take control of their finances than ever, but need to be more proactive when it comes to their home loan.

“The data shows that the highest and lowest rates are not confined to single suburbs, suggesting location is not the be all and end all when it comes to interest rates. In fact, at the time that the data was recorded, the lowest rate, 3.49 per cent, was available all over Sydney, including the Eastern Suburbs, Sydney CBD, North Shore, Inner-West, Northern
Beaches and South Sydney.

Multiple suburbs were also found to have both the lowest and highest interest rates on the same type of loans for their region. For example, homeowners in Artarmon had the lowest and the highest rates on the North Shore for refinanced investment loans, and new owner occupied
loans.

The lowest new owner-occupied rate in Artarmon was 3.94 per cent, on a loan amount of $950,000. While the highest was a rate of 4.45 per cent, for a lower loan amount of $600,000. And, although the loan size for both the highest and lowest rates for refinanced investment loans was the same ($420,000), the lowest rate was 3.85 per cent and the highest was 5.79 per cent, that is a leap of 1.94 per cent.

According to Martin North, Principal of Digital Finance Analytics, the amount that households pay is determined by a range of factors: whether it is a new loan or a refinanced loan, where the property is located, the type of loan, the loan to value ratio, and how the loan is negotiated.

“Borrowers shouldn’t necessarily take the first rate they are offered. It is not in a lender’s interest to automatically offer the golden egg. Rather, a negotiation has to take place, and borrowers have to have an appetite for it.

“The lender is providing a service for you, so be prepared to negotiate, or use a broker to help get the best deal,” said Mr North.

Those who have already settled on a home loan were also called to be more proactive in reviewing their rate and situation frequently.

“Too often borrowers have a ‘set and forget’ mentality when it comes to their mortgage. What they don’t realise is you can actually renegotiate a better rate with your current lender, or switch providers entirely which can save thousands, often completely outweighing any switching costs that may be involved,” said Mr North.

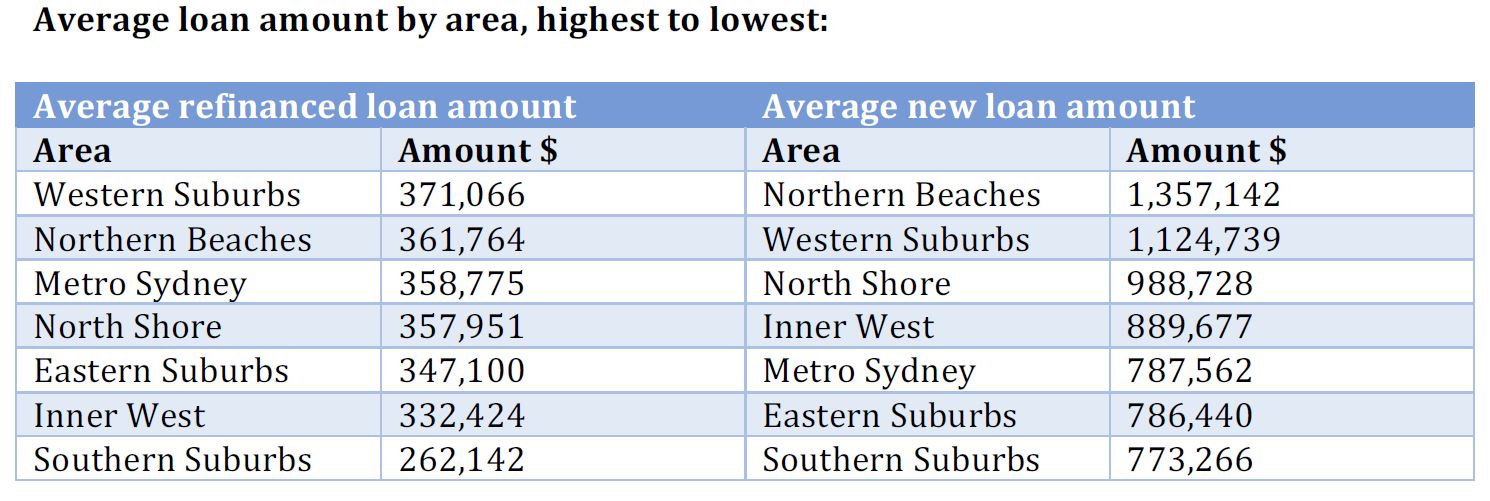
The data indicated that new owner-occupied loans across Sydney CBD, Northern Beaches and Western Suburbs all had average interest rates above 4 per cent, while South Sydney (3.95), Eastern Suburbs (3.94), Inner West (3.89) and North Shore (3.86) sat just below.

The average refinanced owner-occupied rate in the Inner West was a high 4.12 per cent, followed by the Eastern Suburbs (3.99) and North Shore (3.95).

The average loan size for those refinancing was $341,603 and the average loan size for a new home was $958,222 – with Northern Beaches and Western Suburbs residents borrowing the most.

* Note, high rates due to poor credit history or unique circumstances were removed from the data before analysis.


New home sales lift in August – HIA

The HIA New Home Sales report – a monthly survey of the largest volume home builders in the five largest states – says for the three months to August compared with the same period last year, house sales in Victoria are 15.7 per cent higher and up by 9.2 per cent in South Australia. Over the same period, sales declined in Queensland (-7.3 per cent), WA (-15.4 per cent), NSW (-17.4 per cent) and Queensland (-37.9 per cent).

“New home sales increased by 9.1 per cent last month as a result of very strong results in Victoria and Western Australia, but over the year sales have continued to slow,” stated HIA’s Principal Economist, Tim Reardon.

“The jump in sales in July confirms our forecast of a slowdown in building activity through until 2018/19.

The increase in sales in August offsets larger declines in sales in recent months, but it is not sufficient to reverse the decline in sales that is evident since early 2016,” continued Mr Reardon.

“Results in July and August have been affected by government interventions in NSW and Victoria which have seen first home-buyers returning to the new home market.

“Victoria has seen record numbers of new building approvals and new home sales are continuing to drive even higher. Strong population growth and employment growth, fortified with enhanced first home buyer incentives, is prolonging the boom in building activity.”

“The trend in new home sales continues to provide a strong leading indicator of the trend in residential building approval figures from the ABS as can be seen in the chart below,” concluded Mr Reardon.

ANZ acquires REALas to bolster digital offering in Australia’s property market

ANZ today announced it had acquired Australian property start-up REALas to help home buyers access better information about the Australian property market.

Launched in 2011, REALas offers a unique algorithm to predict property prices and has forged a strong reputation as the most accurate predictor of sale prices for listed properties.

Commenting on the acquisition, ANZ Managing Director Customer Experience and Digital Channels Peter Dalton said: “This is an important acquisition for our digital transformation as we know customers are increasingly turning to online resources for help as they navigate the Australian property market.

“It’s also a great success story of an Australian start-up, so we’re really pleased to be working with them and looking at how we might incorporate some of their features into ANZ’s products and services in the future.”

REALas CEO Josh Rowe said: “The algorithm at the centre of our site was built using the latest data science methods, local market knowledge from property experts and crowd-sourced data from buyers. Its predictions change in response to the market, which means buyers have access to the latest prediction right up to the time of sale.

“We’re thrilled that ANZ has recognised the value in what we’ve built over the past six years and we’re looking forward to growing our service and helping people get the information they need to make better decisions when buying or selling property.”

REALas.com will continue to operate independently as a wholly-owned subsidiary of ANZ.

How can we prevent financial abuse of the elderly?

From The Conversation.

Throughout Australia older people are losing their savings, property and homes through financial abuse, usually at the hands of persons close to them such as an adult child or grandchild.

A sense of entitlement, ‘Inheritance impatience’ or opportunism can encourage people to ‘help themselves’ to an older person’s assets.

Elder abuse is not a new problem. It has been occurring in Australia and elsewhere for generations – but its only now that serious steps are being taken to address it.

While the extent of elder abuse in Australia is unknown, conservative estimates suggest at least 9% of older Australians suffer from financial abuse. However, we know that because of the hidden nature of the problem, the majority of cases go unreported.

Sadly, a majority of elder financial abuse occurs within families, and is defined as the illegal or improper use of a person’s finances or property by another person with whom they have a relationship implying trust.

Government taking long overdue action

On October 1 this year the Commonwealth Attorney General announced a suite of measures to address elder abuse. These will include initiating a new peak body focused on elder abuse, an online knowledge hub, and education materials to better support older Australians.

But, as Michael Riley, CEO of the elder advocacy group Greysafe, notes: “We know the problems, we now need an action plan and timelines put in place to come up with solutions.”

Financial elder abuse can take many forms but common examples include misappropriation of the older person’s money; misuse of enduring powers of attorney; inappropriate dealing with an older persons property through a guarantee or an unauthorised mortgage; and failed assets for care arrangements.

The opportunities for elder financial abuse are exacerbated by the de-personalisation of banking services. An increase in electronic services means that older people are more vulnerable to such exploitation than in the past.

Although criminal law addresses matters such as theft and fraud, low conviction rates indicate the difficulty of bringing an elder abuse matter before a court. Furthermore, many older people do not want to pursue relatives in criminal proceedings – despite the experience they wish to maintain family relationships.

How banks can help

Part of the solution may rest with banks and financial institutions which are often at the front line when instances of elder financial abuse arise.

There has been some reluctance on the part of banks and financial institutions to address elder abuse citing concerns regarding inter alia privacy obligations, legal liability, and the absence of a consistent reporting framework.

To date, some bank staff receive training to deal with elder abuse detection and banks follow the industry guideline, Protecting Vulnerable Customers from Potential Financial Abuse. Banks have the capacity to identify suspect in-bank and electronic transactions.

While there is limited material publicly available regarding instances where banks have uncovered abuse, in the few reported cases where significant physical abuse and neglect have been the subject of legal consideration, misappropriation of the older person’s funds has been a common factor.

In the absence of a broad national reporting framework, at present there is no cohesive strategy as to how to deal with the elder financial abuse. Furthermore, there are no whistleblower protections for bank employees who may be exposed to legal action from families in the event that financial abuse is not proven. This can make bank employees reluctant to report suspected abuse.

To address this, the Australian Law Reform Commission (ALRC) recommended that the Code of Banking Practice should ensure that banks be obliged to take ‘reasonable steps’ to prevent the financial abuse of vulnerable customers.

Such steps include training staff to detect (through software or other means) and appropriately respond to abuse; ensuring ‘Authority to Operate’ forms are not obtained fraudulently and providing a framework for reporting abuse.

Federal Government must work with banks

Addressing elder financial abuse must be a centrepiece of the federal government’s overall elder abuse strategy. The test will be how, and to what extent, the banks will collaborate with government, relevant agencies, and each other.

As it stands, the requirement to take ‘reasonable steps’ lacks definition; it could encompass significant reform or the bare minimum. Furthermore, a comprehensive internal reporting framework within the banks is essential. If this national initiative is to succeed – mandatory reporting by banks of suspected abuse should be seriously considered.

Finally, public education campaigns targeting older people themselves, persons entering into power of attorney arrangements, and bank staff is the key to preventing such conduct in the first place.

Elder financial abuse has the potential to devastate individuals at the most vulnerable point in their lives – as well as have a detrimental impact on society as a whole.

While the federal government efforts to address elder abuse are to be applauded – we must ensure the opportunity is fully utilized and includes proper regulations within the banking sector.

Authors: Eileen Webb, Associate Professor, Curtin Law School, Curtin University; Teresa Somes, Macquarie University

Top 10 Mortgage Stress Count Down – September 2017

Mortgage stress rose again in September according to Digital Finance Analytics analysis, crossing the 900,000 household rubicon for the first time. The latest RBA data shows household debt to income rose again in June, to 193.7, further confirmation of Australia’s debt problem.

Across the nation, more than 905,000 households are estimated to be now in mortgage stress (last month 860,000) and more than 18,000 of these in severe stress. This equates to 28.9% of households. A rising number of more affluent households are being impacted as the contagion of mortgage stress continues to spread beyond the traditional mortgage belts. We estimate that more than 49,000 households risk default in the next 12 months, up 3,000 from last month.

Watch the video to learn more, and count down the latest top 10 post codes. We had some new regions “promoted” into the list this time.

The main drivers of stress are rising mortgage rates and living costs whilst real incomes continue to fall and underemployment remains high.  Some households are now making larger mortgage repayments following out of cycle interest rate rises, and are simultaneously facing higher power prices, council rates and childcare costs. This remains a deadly combination and is touching households across the country, not just in the mortgage belts.

Our analysis uses the DFA core market model which combines information from our 52,000 household surveys, public data from the RBA, ABS and APRA; and private data from lenders and aggregators. The data is current to end September 2017. We analyse household cash flow based on real incomes, outgoings and mortgage repayments, rather than using an arbitrary 30% of income.

Households are defined as “stressed” when net income (or cashflow) does not cover ongoing costs. Households in mild stress have little leeway in their cash flows, whereas those in severe stress are unable to meet repayments from current income. In both cases, households manage this deficit by cutting back on spending, putting more on credit cards and seeking to refinance, restructure or sell their home.  Those in severe stress are more likely to be seeking hardship assistance and are often forced to sell. The debt-to-income (DTI) ratios in severely stressed households are on average eleven times their current annual incomes and this is high on any measure. The combined statistics suggest there are continuing concerns about underwriting standards.

We revised our expectation of potential interest rate rises, given the stronger data on the global economy. Probability of default extends our mortgage stress analysis by overlaying economic indicators such as employment, future wage growth and cpi changes.

Martin North, Principal of Digital Finance Analytics said that “continued pressure from low wage and rising costs means those with bigger mortgages are especially under the gun. These stressed households are less likely to spend at the shops, which will act as a further drag anchor on future growth. The number of households impacted are economically significant, especially as household debt continues to climb to new record levels”. The latest household debt to income ratio is now at a record 193.7.[1]

Gill North, joint Principal of Digital Finance Analytics and a Professorial Research Fellow in the law school at Deakin University, citing her recent research, suggests the Australian house party has been glorious – but the hangover may be severe and more should be done to mitigate future risks and harm to highly indebted households and the nation.[2]

She notes that at the beginning of 2016 the RBA and APRA stood largely aloof from concerns around levels of household debt and the major risk was complacency. While the RBA and APRA have been more vocal since and have taken steps to tighten lending standards, she calls for additional measures and highlights the continuing vulnerability of many households without financial buffers for adverse contingencies.[3]

Regional analysis shows that NSW has 238,703 households in stress (238,755 last month), VIC 243,752 (236,544 last month), QLD 168,051 (146,497 last month) and WA 124,754 (118,860 last month). The probability of default rose, with around 9,300 in WA, around 9,100 QLD, 12,800 in VIC and 13,100 in NSW.

You can request our media release. Note this will NOT automatically send you our research updates, for that register here.

[contact-form to=’mnorth@digitalfinanceanalytics.com’ subject=’Request The Sept 2017 Stress Release’][contact-field label=’Name’ type=’name’ required=’1’/][contact-field label=’Email’ type=’email’ required=’1’/][contact-field label=’Email Me The Sept 2017 Media Release’ type=’radio’ required=’1′ options=’Yes Please’/][contact-field label=”Comment If You Like” type=”textarea”/][/contact-form]

Note that the detailed results from our surveys and analysis are made available to our paying clients.

[1] RBA E2 Household Finances – Selected Ratios June 2017

[2] Gill North ‘The Australian House Party Has Been Glorious – But the Hangover May Be Severe: Reforms to Mitigate Some of the Risks’ in R Levy, M O’Brien, S Rice, P Ridge and M Thornton (eds), New Directions For Law In Australia (ANU Press, Canberra, 2017). An earlier version of this book chapter is available at https://ssrn.com/author=905894.

[3] See also, Gill North, ‘Regulation Governing the Provision of Credit Assistance & Financial Advice in Australia: A Consumer’s Perspective’ (2015) 43 Federal Law Review 369. An earlier draft of this article is available at https://ssrn.com/author=905894.


Household Debt Burden Rises Once Again – RBA

The RBA has updated its E2 Household Finances Selected Ratios to June 2017. As a result, we see another rise in the ratio of household debt to income, and housing debt to income. Both are at new record levels.

In addition, we see the proportion of income required to service these debts rising, as out of cycle rates rises hit home. These ratios are below their peaks in 2011, when the cash rate was higher, but it highlights the risks in the system should rates rise.

We discuss this further in our September Mortgage Stress Data, to be released shortly.  The debt chickens will come home to roost!

But the policy settings are wrong, debt cannot continue to grow at more than three times cpi or wage growth.


Sydney House Values Fall in September as Capital Gains Continue to Lose Steam

From CoreLogic.

The September results confirmed that dwelling values edged 0.2% higher across Australia over the month, led by a 0.3% rise in capital city values and a 0.1% gain across the combined regional markets. The latest figures take national dwelling values 0.5% higher over the September quarter, which is the slowest rate of quarter-on-quarter growth since June 2016, and national values are up 8.0% over the past twelve months.

According to analysis by CoreLogic head of research Tim Lawless, the combined capital city trend growth rate is clearly losing steam with dwelling values rising by 0.7% over the September quarter and well down from the recent peak rate of quarter-on-quarter growth which was recorded at 3.5% over the December 2016 quarter. Mr Lawless said, “This slowing in the combined capitals growth trend is heavily influenced by conditions across the Sydney market where capital gains have stalled.”

CBA Reclassifies Loans

At 12:13 PM on Friday 29th September, before the long weekend, Commonwealth Bank of Australia (CBA) advised the ASX that following clarification of loan purpose reporting guidelines, certain statistical data have been reclassified as part of regulatory reporting obligations for Authorised Deposit-taking Institutions. It did not come through their normal press release channels.

The reclassification relates to mortgage-secured household lending data for the periods between October 2015 and July 2017. The approximate impacts of the reclassification as at 31 July 2017 include:

  • Restatement of Loans to Households: Housing: Owner-occupied from $278.4bn to $273.9bn;
  • Restatement of Loans to Households: Housing: Investment from $138.2bn to $134.8bn; and
  • Restatement of Loans to Households: Other from $10.1 bn to $18.0 bn

The reclassification is for statistical reporting purposes only and has no impact on customers, the security and serviceability arrangements for these loans or on CBA’s regulatory capital, risk appetite, risk-weighted assets or statutory financial statements.

The reclassification has minimal impact on CBA’s reported volumes relative to APRA’s industry benchmark for investor mortgage growth and limit for new interest-only mortgage lending.

This may go some way to explaining the weird APRA data which came out Friday, compared with the RBA data, which showed a net rise.  Here is the APRA portfolio movements in summary.

So it means CBA loans were switched from classified for property lending, to secured on property for other purposes.  The APRA guidance letter from March 2016 says:

In particular, non-housing loans that are secured by residential property mortgages should not be reported under item5.1.1.1 or 5.1.1.2, but reported under the relevant loan item elsewhere in ARF 320.0.

At very least this switching of loans is unhelpful when trying to understand the trajectory of home lending, including the $58 billion of loans reclassified according to the RBA.

Not having a trusty compass makes policy setting difficult – the recent media reports of macro-prudential biting may be overdone as a result. More reason to think the RBA may hike rates sooner.

Reclassification also masks loan portfolio growth, and also the RBA only reports the value of loans switched between owner occupied and investors, not switched away to non-property purposes.  More fog around the numbers!

ANZ to offer payments on Fitbit Ionic

ANZ has announced it had partnered with leading global wearables brand, Fitbit, to offer customers the ability to make payments on the run through Fitbit Ionic, the ultimate health and fitness watch.

From today, ANZ’s Australian customers will be able to load their eligible Visa debit or credit cards through the Fitbit app so they can make simple and more secure purchases on the go with a Fitbit Ionic.

Commenting on the new partnership, ANZ Managing Director Products Bob Belan said: “ANZ is committed to being at the forefront of new payment experiences so we’re pleased to be offering our customers a convenient way to pay on the go with their Fitbit Ionic.

“We’re excited to work with an innovative company like Fitbit to offer our customers products and services that are simple to use and helpful in an increasingly digital world.”

“Having done a lot of work with mobile payments in the past, we are well-positioned to establish more partnerships at a faster rate to meet the evolving needs of our customers.”

Customers will need a Fitbit account and an eligible device to pair with their Android or iOS smartphone so they can access the payments service via the Fitbit app. Once set up with their debit or credit card, they simply need to tap the device at any contactless merchant terminal to make a payment.

The announcement comes after ANZ successfully launched mobile payments partnerships with several other companies in the past 18 months, including the world’s largest smartphone manufacturers and software providers.

Mortgage stress up despite decline in rates

New research from Roy Morgan shows that mortgage stress has increased to 17.3% of borrowers in July, an increase of 0.3% points over the last 12 months, despite a decline in loan rates.

Home loan rates were based on the standard variable rate from the RBA which in the three months ended July 2017 averaged 5.25%, down from 5.40% for the same period in 2016.

These are the latest findings from Roy Morgan’s Single Source Survey (Australia) of over 50,000 consumers per annum, which includes interviews with over 10,000 owner occupied mortgage holders.

Increase in ‘At Risk’ and ‘Extremely at Risk’ mortgage holders

Over the last 12 months there has been an increase in mortgage stress for both those considered to be ‘At Risk’ (which is based on the amount originally borrowed) and those ‘Extremely at Risk’ (based on the amount currently outstanding). In the three months to July 2016, 17.0% of mortgage holders were ‘At Risk’, this has increased to 17.3% in July 2017. Over the same period the proportion that were ‘Extremely at Risk’ also increased from 12.4% to 12.8%.

Mortgage Stress – Owner Occupied Mortgage Holders


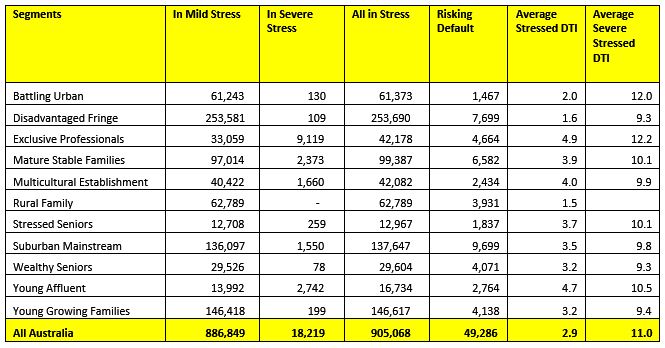
Mortgage stress is based on the ability of home borrowers to meet the repayment guidelines currently provided by the major banks. 1. “At Risk” is based on those paying more than a certain proportion of their household income (15% to 50% depending on income) into their loans based on the appropriate Standard Variable Rate reported by the RBA and the amount the respondent initially borrowed. 2. “Extremely at Risk” is based on those paying more than a certain proportion of their household income (30% to 45% depending on Income) into their home loans based on the Standard Variable Rate set by the RBA on the amount respondents currently owe on their home loan. Source: Roy Morgan Single Source (Australia) 3 months ended July 2016, n = 2,673, 3 months ended July 2017, n = 2,734. Base: Australians 14+ with owner occupied home loan

Household incomes of mortgage holder’s not keeping pace with borrowings

The main cause of the increase in mortgage stress was the fact that over the last year, the median household income of mortgage holders only increased by 2.0%, well behind the increase in the median amount borrowed (up 7.4%) and the median amount outstanding (up 13.1%).

Major Factors Impacting Increase in Mortgage Stress – Last 12 Months

1. Percentage change is based on 3 months to July 2017, compared to 3 months to July 2016. Source: Roy Morgan Single Source (Australia) 3 months ended July 2016, n = 2,673, 3 months ended July 2017, n = 2,734. Base: Australians 14+ with owner occupied home loan

The increase in mortgage stress was despite the fact that home loan rates (based on the RBA standard variable rate) over this period actually declined from 5.40% to 5.25%.