A GUEST post on the Bank of England’s “Bank Underground” blog makes the point that most reversals after periods of interest rate declines are rapid. When rate cycles turn, real rates can relatively swiftly accelerate. The current cycle of rate decline is one of the longest in history, but if the analysis is right, the rate of correction to more normal levels may be quicker than people are expecting – and a slow rate of increases designed to allow the economy to acclimatize may not be possible. Not pretty if you are a sovereign or household sitting on a pile of currently cheap debt!
With core inflation rates remaining low in many advanced economies, proponents of the “secular stagnation” narrative –that markets are trapped in a period of permanently lower equilibrium real rates- have recently doubled down on their pessimistic outlook. Building on an earlier post on nominal rates this post takes a much longer-term view on real rates using a dataset going back over the past 7 centuries, and finds evidence that the trend decline in real rates since the 1980s fits into a pattern of a much deeper trend stretching back 5 centuries. Looking at cyclical dynamics, however, the evidence from eight previous “real rate depressions” is that turnarounds from such environments, when they occur, have typically been both quick and sizeable.
Despite much research into the causes of real rate distortions in recent years, the discussion has arguably suffered from a lack of long-term context. Key additions – such as the influential BoE staff working paper confirming the role of excess savings and lower investment preferences – typically trace back their observations to the late Bretton Woods period, or at best to Alvin Hansen’s time in the interwar period. Hamilton et al. and Eichengreen are rare exceptions in their inclusion of 19th century data.
Therefore, the majority of work on secular stagnation– and with it the debate regarding bond market valuations – fails to consider the deeper historical rate trends. In contrast, a multi-century dataset offers the opportunity to look at cyclical behavior and the dynamics of reversals from earlier real rate depressions.
Seven centuries of real risk free rates
In this spirit, this post (based on a new Staff Working Paper) provides a real rate dataset for the last 700 years, and identifies a total of nine “real rate depressions” sharing similar traits to the trend observed since the 1980s.
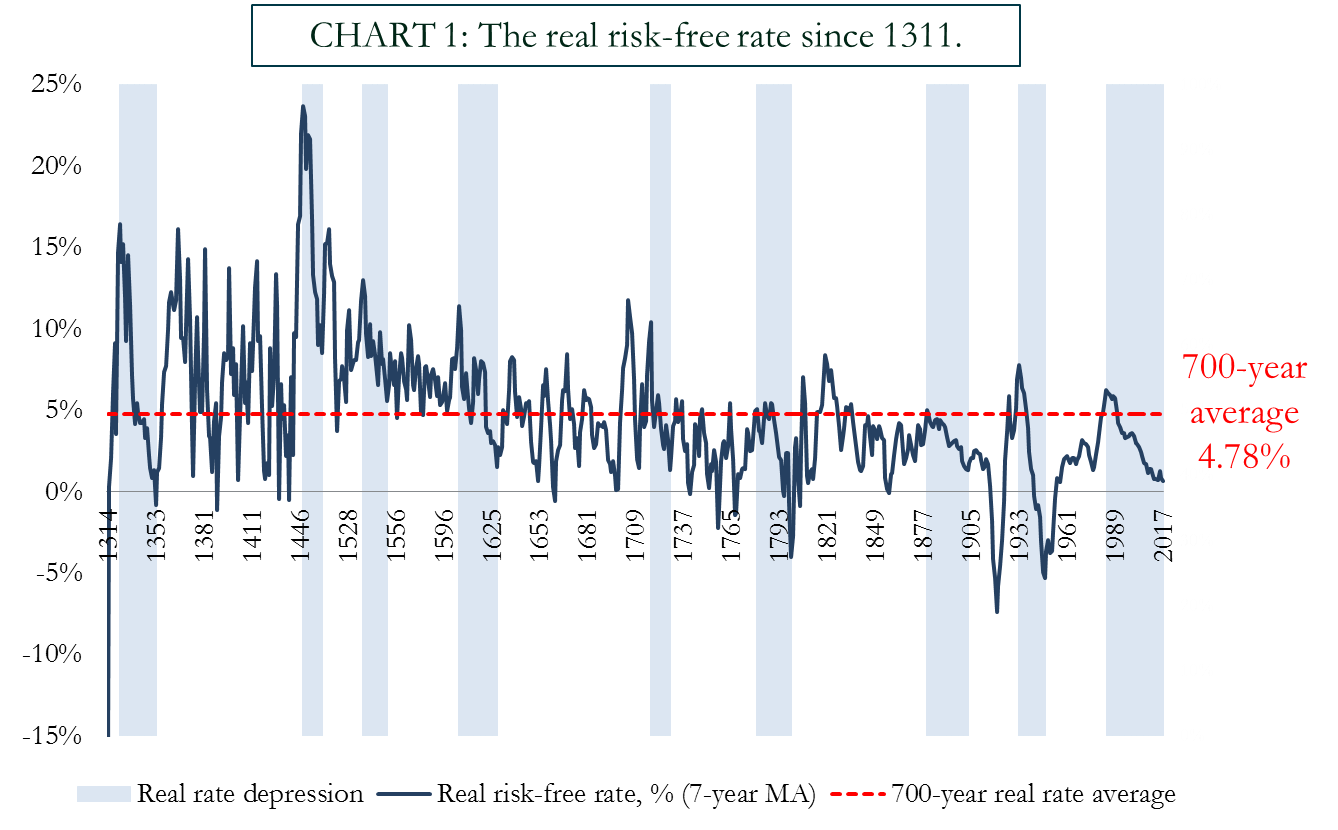
This chart further expands risk-free nominal bond data introduced in a previous post, and adjusts for historical ex-post inflation data provided by Bob Allen, Bank, Bundesbank, archival, and FRED data. We trace the use of the dominant risk-free asset over time, starting with sovereign rates in the Italian city states in the 14th and 15th centuries, later switching to long-term rates in Spain, followed by the Province of Holland, since 1703 the UK, subsequently Germany, and finally the US.
The all-time real rate average stands at 4.78% and the 200-year real rate average stands at 2.6%. Relative to both historical benchmarks, the current market environment thus remains severely depressed.
Upon closer inspection, it can be shown that trend real rates have been following a downward path for close to five hundred years, on a variety of measures. The development since the 1980s does not constitute a fundamental break with these tendencies.
Regressing the 7-year average on a constant time trend (the red line) indicates an average fall of 1.6 basis points per annum. Simple averages tell a similar story of decline. In many ways, therefore, the “secular decline” in real rates since the days of Paul Volcker is but a part of a deeper “millennial decline” tracing back its roots to the days of the late Quattrocento.
The all-time peaks in real yields in the mid-1400s coincide with the geopolitical escalations amid the fall of Constantinople, the seizure of silver mines by the Ottomans, on the Balkans, and evidence of increasing European BoP deficits to the Levant – factors consistent with the narrative of a “Great Bullion Famine”. The “real rate turning point” on our basis thus somewhat precedes the classical dating of the “financial revolution” and the sharp inflows of New World treasure. The falling trend continues unabatedly after other political inflections, such as the Reformation, the Thirty Years War, and into the modern days of Globalization.
The breakdown of real risk-free rates: nominal and inflation components
The real rate, by definition, represents the difference between nominal rates and inflation.
The 700-year average annual ex-post headline inflation for the risk-free issuer stands at 1.09%,, the 200-year average, since 1817, stands at 1.55%, with a further pickup in the 1900s. Three observations stand out: First, the past 60 years, in which the US has been the benchmark bond issuer has been the most inflationary in our whole sample period; second, current inflation rates of slightly below 2% remain fully in-line with the ex-post performance witnessed in modern times, with today’s typical inflation targets already being accommodative if measured against (very) long run trends. Third, never before has a longer period without deflation existed than the ongoing 70-year spell since World War Two.
Economists often view the real-nominal-inflation nexus through the lens of the Fisher equation– where long run nominal rates are the sum of two “structural” variables: real rates, and (expected) inflation. The chart below presents the real rates and ex post inflation rates in terms of century averages:
The green bars show the fall in real rates, blue bars the contribution of inflation. Evidently, the fall in real rates over successive centuries has been partially muted by the higher inflation in the 20th and 21st centuries. As a result the decline in nominal rates over time has been somewhat less than the underlying fall in real rates.
“Real rate depression cycles”
Focusing on our cyclical precedents, on several previous occasions, rates have exhibited a sustained divergence from long-term averages. Over the seven centuries, nine historical “real rate depression cycles” can be identified, which saw a secular decline of real interest rates, followed by reversals. The chart below plots the size and duration of these compression episodes:
Our current “secular stagnation” of real rates, at 34 years, is the second longest thus far recorded. Only the years immediately surrounding the discovery of America outstrip the current cycle by length. Measured by total rate compression from peak to trough, the period from 1325 to 1353 – at 1700 basis points in real rates – is the most notable. In our 7-year moving average dataset, the all-time trough within depression episodes is recorded in 1948, at -5.3%. Turning to how these depressions end, the chart below plots the path of real rates in each reversal period following the trough.
Most reversals to “real rate stagnation” periods have been rapid, non-linear, and took place on average after 26 years. Within 24-months after hitting their troughs in the rate depression cycle, rates gained on average 315 basis points, with two reversals showing real rate appreciations of more than 600 basis points within 2 years. Generally, there is solid historical evidence, therefore, for Alan Greenspan’s recent assertion that real rates will rise “reasonably fast”, once having turned.
Fundamental Stagnations: A closer look at the “Long Depression”
Most of the eight previous cyclical “real rate depressions” were eventually disrupted by geopolitical events or catastrophes, with several – such as the Black Death, the Thirty Years War, or World War Two – combining both demographic, and geopolitical inflections. Most cyclical real rate depressions equally coincided with inflation outperformances. But for a minority of cycles, economic fundamentals were decisive, and exhibited both excess savings and subdued inflation. The prime example – and likely the closest historical analogy to today’s “secular stagnation” – is represented by the global “Long Depression” of the 1880s and 1890s.
Following years of a global railroad investment frenzy, and global overcapacity indicators inflecting in the mid-1860s, the infamous “Panic of 1873” heralded the advent of two decades of low productivity growth, deflationary price dynamics, and a rise in global populism and protectionism.
Following the crash, the UK’s 10-year moving average TFP growth declined from 1.7% in the early 1870s, to flat, and even at times negative levels in the following two decades (Chart below). Labor productivity in particular shrunk, plummeting by around two-thirds in the same timeframe, after reaching new all-time records at the dawn of the crisis. Though recent research has emphasized nominal factors for the period, most contemporaries including Joseph Schumpeter stressed real drivers. Indeed, real GDP trend growth in the UK reached century lows by the 1890s. Despite alleged money scarcity, borrowing rates declined.
What ended the Long Depression? Labor productivity bottomed out in 1892-3, prior to the discovery of gold at the Klondike, and the associated monetary expansion. Wage inflation started outstripping productivity increases as early as 1885, leading the recovery in general inflation. And US equities finally bounced back from their 15-year lows with the Presidential election of William McKinley – a Republican pro-business protectionist – in November 1896. In other words, there is strong evidence suggesting that the last “secular stagnation cycle” started fading relatively autonomously after just over two decades following the key financial shock, not requiring the aid of decisive fiscal or monetary stimulus.
Conclusion
On aggregate, then, the past 30-odd years more than hold their own in the ranks of historically significant rate depressions. But the trend fall seen over this period is a but a part of a much longer ”millennial trend”. It is thus unlikely that current dynamics can be fully rationalized in a “secular stagnation framework”. Meanwhile, looking at past cyclical patterns, the evidence suggests that when rate cycles turn, real rates can relatively swiftly accelerate.


Paul Schmelzing is an academic visitor to the Bank from Harvard University’s History Department.
Note: Bank Underground is a blog for Bank of England staff to share views that challenge – or support – prevailing policy orthodoxies. The views expressed here are those of the authors, and are not necessarily those of the Bank of England or its policy committees.