First Time Buyers On The Up

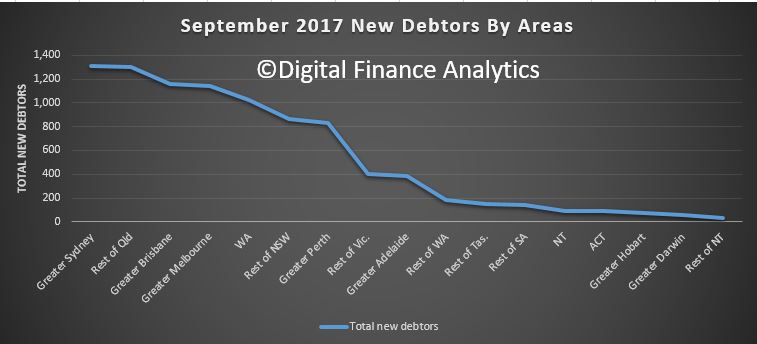
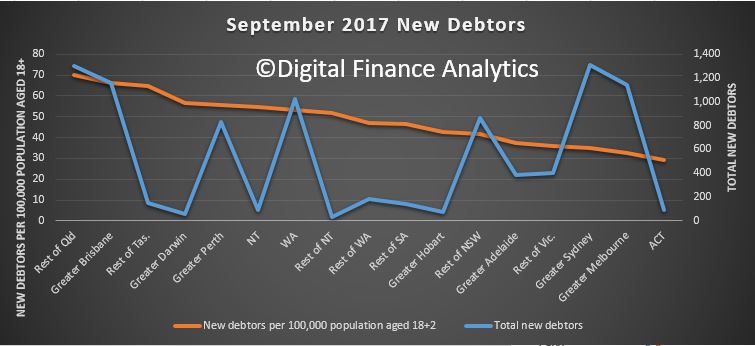
As we continue our series based on our most recent household surveys, we look at first time buyers, who seem to be picking up at least some of the slack from property investors (which we covered yesterday).

We see that 27% want to buy to capture future capital growth, the same proportion seeking a place to live! 13% are seeking tax advantage and 8% greater security of tenure. But the most significant change is in access to the First Home Owner Grants (8%), thanks to recent initiatives in NSW and VIC, as well as running programmes across the country.

We see more are looking to buy units, at the expense of suburban houses.

The largest barriers are high home prices (44%), availability of finance (19% – and a growing barrier thanks to tighter underwriting standards), interest rate rises (9%) and costs of living (6%). Finding a place to buy is still an issue, but slightly less so now (18%).

So expect to see more first time buyers active, though there are not enough of them to offset the fall in interest from investors, so expect price weakness as we go into 2018.

Westpac Cuts Fixed Mortgage Rates Too

From The Advisor.

As of Wednesday (20 September), Westpac’s two-year fixed rate for owner-occupiers paying principal and interest (P&I) dropped by 11 basis points to 4.08 per cent (standalone rate) or 5.16 per cent comparison.

For those with a Premier Advantage Package, the new rate is 3.88 per cent (4.88 per cent comparison) for two-year fixed terms.


At Bank of Melbourne, Bank SA and St. George Bank, the new standard two-year fixed rate for owner-occupiers on P&I is 14 basis points below its former level, at 4.00 per cent (5.14 per cent comparison).

The group clarified to brokers that customers will receive the new lower rate on applicable loans if they have already rate-locked their fixed rate, and if the rate locked in is higher than the new rate, on the date the loan settles (provided that there is no further fixed rate change).

If the rate locked in is lower than the new rate, then they will not be impacted by this change (i.e., they will get the rate they locked it at).

Westpac’s move to drop its two-year fixed rates follow on from similar moves from Suncorp, ANZ, CUA, and MyState Bank. Suncorp Bank recently said that the rate drop follows on from “recent reductions to fixed rate funding costs”.

Genworth Gets NAB’s LMI Contract Extended

In a release to the ASX, Genworth, the listed Lenders Mortgage Insurer said that its contract with NAB to provide LMI had been extended for one year to 20th November 2018.

The contract represented 10% of Gross Written Premium in 2016.

Ms Georgette Nicholas, Chief Executive Officer and Managing Director of Genworth, said, “We look forward to continuing to build on our long-standing partnership with NAB under this extended agreement. We are focused on delivering risk and capital management solutions for our customers and we’re delighted that we have been able to continue to be the LMI provider for NAB’s broker business.

“Genworth remains committed to supporting Australians realise their dream of homeownership. Our focus continues to be on the provision of capital and risk management solutions to our lender customers, being a strong risk management partner and using our data and analytics to provide in sights to this changing market.”

The extended contract does not change the guidance provided that Gross Written Premium (GWP) will be down 10 to 15 per cent in 2017.

Bond Returns, Lower For Longer?

From Moody’s

A less accommodative US monetary policy may heighten market volatility near term. However, over time, the fundamentals that give direction to business activity and financial markets will prevail. For now, current trends involving demography, technology, regulation, and globalization favor the containment of core price inflation and still relatively low US Treasury bond yields.

Because price deflation is anathema to both profit margins and credit quality, a low enough rate of price inflation will adversely affect both equity prices and systemic financial liquidity. If US core consumer price inflation (which excludes volatile food and energy prices) now eases amid a relatively low and declining unemployment rate, what might become of core consumer prices once unemployment inevitably rises? Today’s already sluggish rate of core consumer price growth increases the risk of outright price deflation if sales volumes endure a recessionary contraction.

US consumer price inflation lacks both the speed and breadth necessary for a lasting stay by a 10-year Treasury yield of at least 2.5%. Because the Fed’s preferred inflation measure — the PCE price index — can be temporarily buffeted about by wide swings in food and energy prices, our focus is on the core PCE price index, which best captures consumer price inflation’s underlying pace.

Pockets of price deflation warn against aggressive tightening

The annual rate of core PCE price index inflation was merely 1.4% in July. The accompanying -2.0% annual rate of consumer durables price deflation underscores the considerable risk of pushing too hard on the monetary brakes. Both persistent consumer durables price deflation and August 2017’s -0.9% annual rate of core consumer goods price deflation (as measured by the CPI) warn that too rapid a rise by interest rates risks even lower prices among businesses already burdened by a loss of pricing power. Prolonged core consumer goods price deflation might yet thin profit margins by enough to necessitate layoffs.

The CPI tells roughly the same story as the PCE price index, where inflation gives way to deflation outside of consumer services. By far the fastest price growth has been posted by consumer services, whose pricing benefits from the category’s relative immunity from global competition. For example, August 2017’s 1.7% annual rate of core CPI inflation consisted of a 2.5% annual rate of consumer service price inflation that differed considerably from the aforementioned -0.9% annual rate of core consumer goods price deflation. Core consumer goods price deflation has held in each month since March 2013 and it posted its worst reading since August 2004’s -1.2% in August 2017.

Moreover, consumer service price inflation has been skewed higher by the relatively rapid growth of shelter costs. After excluding August 2017’s 3.3% yearly increase by the CPI’s shelter cost component, the 1.7% annual rate of core CPI inflation drops to 0.5%, which was the slowest such rate since the 0.5% of January 2004.

Expectations of a 2% to 3% Return from Bonds May Become the Norm

Investment professionals now include expectations of a prolonged containment of price inflation in their long-term outlook for prospective returns. For example, a member of Vanguard Group’s global investment-strategy team reiterated Vanguard’s expectation of expected returns for the next decade of 5% to 8% for equities and 2% to 3% for bonds, according to Bloomberg News.

The expected 2% to 3% return from bonds during the next 10 years is at odds with both the FOMC’s median projection of a 2.75% federal funds rate over the long-term and consensus forecasts of a 3% to 3.5% average for the 10-year Treasury yield during the next 10 years.

The cited Vanguard investment manager claimed that bond yields will be reined in by low price inflation stemming from demographic change, globalization, and technological progress. Aging populations will weigh on household expenditures. An aging population implies less in the way of household formation that otherwise accelerates spending vis-a-vis income and, by doing so, imparts a powerful multiplier effect.

Furthermore, the US workforce now ages in tandem with the overall population. According to the Labor Department’s household survey of employment, the employment of Americans aged at least 55 years surged by a cumulative 31.2% since June 2009’s end to the Great Recession through August 2017. Because the latter was so much faster than the accompanying 9.6% increase by total household-survey employment, the number of employees aged at least 55 years rose to a record 23.2% of household survey employment in August. The unprecedented aging of both the US workforce and population will limit the upsides for household expenditures, core consumer price inflation, benchmark interest rates, corporate earnings growth, and corporate debt growth.

Globalization has weakened the tendency of a tighter US labor market to quicken wage growth and, thereby, stoke consumer price inflation. Globalization exposes US workers to the often cheaper and increasingly skilled workforces of dynamic emerging market countries. Heightened labor-market competition implies that employee compensation will be more closely aligned with a worker’s individual performance. Attractive across-the-board wage hikes are a thing of the past.

Meanwhile, technological progress will facilitate the production of higher quality products at lower costs. Thanks to technology, cost-push deflation may push aside cost-push inflation.

Faster price growth requires the sustenance of faster income growth

A recurring annual rate of consumer price inflation of at least 2% requires that consumers be able to afford such a steady and broadly distributed climb by prices. The atypically slow 2.6% annual rise by wage and salary income of the 12-months-ended July 2017 questions consumer spending’s ability to sustain consumer price inflation at 2% or higher. An improving trend has yet to materialize according to July’s merely 2.5% yearly increase by wages and salaries.

Never before has wage and salary income grown so slowly over a yearlong span more than three years into a business cycle upturn. Yes, it may be true that 2017’s deceleration by wages and salaries reflects an attempt to delay receiving employment income until after possible income tax cuts take effect, but most workers are incapable of timing the receipt of income. Thus, to the extent any slowing of 2017’s wage and salary income reflects a tax-driven postponement of such income, attention is brought to a distribution of income that may be increasingly skewed toward higher income individuals. If true, then any percent increase by wage and salary income will supply less of a boost to household expenditures
and business pricing power compared to the past.

Today’s dearth of personal savings and weakened financial state of America’s lower- and middle-income classes subtract from business pricing power. Less personal savings leaves consumers with less of a buffer with which to absorb widespread price hikes. When savings are low or practically nonexistent, affected consumers may react to broadly distributed price hikes by cutting back on real consumer spending, which, in turn, leads to an accumulation of unwanted inventories and remedial price discounting.

When the core PCE price index averaged a rapid annual advance of 6.6% during 1971-1981, the US personal savings rate averaged 11.6% of disposable personal income. By contrast, since the end of 1995, the 1.7% average annual rate of core PCE price index inflation has been joined by a much lower average personal savings rate of 5.0%, where the personal savings rate was an even skimpier 3.9% during the 12-months-ended July 2017. Moreover, to the degree the distribution of income has become increasingly skewed toward the top, the personal savings rate of middle- to lower-income consumers may now be noticeably lower.

The FOMC now believes that the annual rate of core PCE price index inflation will remain under 2%, but only through 2018. However, core PCE price index inflation is likely to average something less than 2% annually through 2027, especially if employee compensation cannot sustain a pace faster than 4% annually.

Don’t count your economic chickens before they hatch

From The Conversation.


After their customary two-day meeting, the Fed announced that they were holding interest rates at their current level, but would begin unwinding the massive bond-buying program they instituted in the wake of the financial crisis.

The Fed’s statement said:

In October, the Committee will initiate the balance sheet normalization program described in the June 2017 Addendum to the Committee’s Policy Normalization Principles and Plans.

This was met with whoops and hollers – from most quarters – and interpreted as a sign that the US economy is back on track.

For instance, the New York Times ran a headline “Confident Fed Sets Stage for December Rate Hike” and noted:

…[the Fed] would begin to withdraw some of the trillions of dollars that it invested in the American economy after the 2008 financial crisis. The widely expected announcement reflected the Fed’s confidence in continued economic growth. The current expansion is now in its ninth year, one of the longest periods of growth in American history.

Now, none of those words are wrong, but there’s more to this story.

The Fed is planning to shrink its US$4.5 trillion balance sheet by US$10 billion a month. That’s hardly a massive vote of confidence in the economy. In their statement, the Fed also expressed continued concern about stubbornly low inflation.

On top of all of that, we might be in the ninth year of economic expansion, but at what rate? Answer: well below historical levels.

So, as they say in showbusiness, hold the balloons.

Meanwhile in Australia, RBA assistant governor Luci Ellis issued an upbeat assessment of the economy in a speech to the Australian Business Economists forum. Her positive outlook is based on a textual reading of the IMF World Economic Outlook.

In 2016 about 6% of the “important” words were deemed positive and 10% were negative. This year 13% are positive and only 5% negative.

IMF word cloud. Reserve Bank of Australia

Let me add a few negative words to the count. First, it’s not as if the IMF is never wrong. Second, if one tries this kind of word-counting exercise in an academic seminar then people either giggle, cry, or start throwing things.

Economists (like those at the RBA) typically put little weight on chatter and a lot of weight on “revealed preference” – the decisions actually being made. For instance, the RBA continues to keep the cash rate at 1.5%. One can only surmise that they are concerned about what would happen if they did raise rates.

And with good reason. As the RBA themselves have pointed out, Australian households are deeply indebted. Moreover, the big four banks are extremely exposed to the housing market, and at least some of their chief executives seem rather naive about the risks they have taken on.

For instance, ANZ chief executive Shayne Elliot made the astonishing claim on ABC’s Four Corners recently that the bank’s risks are diversified because each mortgage was its own individual risk. This is exactly the kind of thinking that led to the financial crisis in 2008.

The RBA is in a bind, and they know it. So until they start raising rates it is wise to believe that the economy is more fragile than they often say it is.

Indeed, the one positive thing the US and Australia and Australia have in common is a relatively low unemployment rate. Yet wage growth is also very low.

All in all, the positive responses to the Fed’s announcement, and the happy sentiments in Luci Ellis’s speech, seem premature at best. The world economy may be picking up a little bit, but there is a long way to go before we can say that we are in a stable recovery.

Author: Richard Holden, Professor of Economics and PLuS Alliance Fellow, UNSW

RBA Says The Next Chapter Is Coming

An interesting and wide ranging speech from RBA Governor Philip Lowe.

In short, the global economy is on the up, central banks are beginning to remove stimulus, and locally, wage growth is low, despite reasonable employment rates. Household debt is extended, but in the current low rates mostly manageable, but the medium term risks are higher.  Business conditions are improving.

He then discusses the growth path from here, including the impact of higher debt on household balance sheets. We will need to deal with the higher level of household debt and higher housing prices, especially in a world of more normal interest rates. In this environment, a small shock could turn into a more serious correction as households seek to repair their balance sheets.

The Current Chapter

The storyline of the current chapter is well known. It has had two main plot lines.

The first was a troubled global economy. A decade ago we had the global financial crisis and the worst recession in many advanced economies since the 1930s. A gradual recovery then took place, but it was painfully slow. Recently, things have improved noticeably and unemployment rates in some advanced economies are now at the lowest levels in many decades. Throughout this chapter, central banks have mostly worried that inflation rates might turn out to be too low, not too high. Interest rates have been at record lows. And workers in advanced economies have experienced low growth in their nominal wages. So it’s been a challenging international backdrop.

The second plot line was the resources boom. Strong growth in China saw strong growth in demand for resources. Prices rose in response, with Australia’s terms of trade reaching the highest level in at least 150 years (Graph 1). Then an investment boom took place in response to the higher prices, with investment in the resources sector reaching its highest level as a share of GDP in over a century. And now we are seeing the dividends of this, with large increases in Australia’s resource exports.

Graph 1
Graph 1: Terms of Trade


Overall, it has been a reasonably successful chapter in Australia’s economic history. Real income per person is around 20 per cent higher than it was in the mid 2000s and real wealth per person is 40 per cent higher. Australia is one of the few advanced economies that avoided a recession in 2008. And the biggest mining boom in a century did not end in a crash, as previous booms did. Our interest rates remained positive, unlike those in many other advanced economies. Since the mid 2000s, the unemployment rate has averaged 5¼ per cent, a better outcome than in the previous three decades. Inflation has averaged 2½ per cent. And over this period, GDP growth has averaged 2¾ per cent, higher than in most other advanced economies.

So, taking the period as a whole, it is a positive picture.

At the same time, though, as the chapter draws to a close, we do face some issues. I would like to highlight three of these.

The first is the recent slow growth in real per capita income. For much of the past two decades, real national income per person grew very strongly in Australia (Graph 2). We benefited from strong productivity growth, higher commodity prices and more of the population working. In contrast, since 2011 there has been little net growth in real per capita incomes. This change in trend is proving to be a difficult adjustment. The solutions are strong productivity growth and increased labour force participation.

Graph 2
Graph 2: PWL Real Net National Disposable Income per Capita


A second issue is the unusually slow growth in nominal and real wages. Over the past four years, the increase in average hourly earnings has been the slowest since at least the mid 1960s (Graph 3). This is partly a consequence of the unwinding of the mining boom but there are structural factors at work as well. The slow growth in wages is putting a strain on household budgets and contributing to low rates of inflation.

Graph 3
Graph 3: Average Earnings per Hour


A third issue is the high level of household debt and housing prices. Over recent times, Australians have borrowed a lot to purchase housing. This has added to the upward pressure on housing prices, especially in our two largest cities, where structural factors are also at work. Australians are coping well with the higher level of debt, but as debt levels have increased relative to our incomes so too have the medium-term risks. The very high levels of housing prices in our largest cities are also making it difficult for those on low and middle incomes to buy their own home.

So as we turn the final pages of this chapter, these are some of the issues we face. But as we turn these pages, we also see improvements on a number of fronts.

Business conditions, as reported in surveys, are at the highest level in almost 10 years. There are also growing signs that private investment outside the resources sector is picking up. We have been waiting for this for some time. For a number of years, animal spirits had been missing, with many firms preferring to put off making decisions about capital spending. It appears that some of this reluctance to invest is now passing. According to the June quarter national accounts, private non-mining business investment increased strongly over the first half 2017, to be around 10 per cent above the level at the start of 2016. Non-residential building approvals have increased to be above the levels of recent years and there is a large pipeline of public infrastructure investment to be completed (Graph 4). The decline in mining investment has also largely run its course.

Graph 4
Graph 4: Investment


There has also been positive news on the employment front. Over the past year, the number of people with jobs has increased by more than 2½ per cent, a positive outcome given that the working-age population is increasing at around 1½ per cent a year. Growth in full time employment has been particularly strong. The various forward-looking indicators suggest that labour market conditions will remain positive in the period immediately ahead.

Here in Western Australia, there are also some signs of improvement after what has been a difficult few years. The drag from declining mining investment is diminishing. Businesses are feeling more positive than they were a year ago and employment has been rising after a period of decline. At the same time though, conditions in the housing market remain difficult, with housing prices and rents continuing to fall in Perth. Weak residential construction has also weighed on aggregate demand over the first half of this year, although building approvals and liaison reports point to some stabilisation in the period ahead (Graph 5).

Graph 5
Graph 5: Western Australia - Economic Indicators


For Australia as a whole, the recent national accounts – which showed a healthy increase in output of 0.8 per cent in the June quarter – were in line with the Bank’s expectations. These, and other recent data, are consistent with the Reserve Bank’s central scenario for GDP growth averaging around the 3 per cent mark over the next couple of years. This is a bit faster than our current estimate of trend growth in the Australian economy, so we expect to see a gradual decline in the unemployment rate. This should lead to some pick-up in wage growth, although we expect this to be a gradual process given the structural factors at work that I have spoken about on previous occasions. We can also expect to see a gradual increase in inflation back towards the middle of the 2 to 3 per cent medium-term target range.

There are clearly risks around this central scenario. We would like to see the improvement in business investment consolidate and a continuation of job growth at a rate at least sufficient to absorb the increase in Australia’s workforce. Some pick-up in wage growth in response to the tighter labour market would also be a welcome development. So these are some areas to watch. But as things stand, the economy does look to be improving.

The Next Chapter

I would now like to lift my gaze a little and turn to the next chapter in our economic story. I would like to sketch out four of the possible plot lines, acknowledging that, as in all good stories, there are likely to be plenty of surprises along the way.

Shifts in the global economy

A first likely plot line, as it has been in previous chapters, is the ongoing shift in the global economy. Here, changes in technology and further growth in Asia are likely to be prominent themes.

In some quarters there is pessimism about future prospects for the global economy. The pessimists cite demographic trends, high debt levels, increasing regulatory burdens that stifle innovation and political issues. They see a future of low productivity growth and only modest increases in average living standards.

It’s right to be concerned about the issues that the pessimists focus on, but I am more optimistic about the ability of technological progress to propel growth in the global economy, just as it has done in the past. We are still learning how to take advantage of recent advances in technology, including the advances in the tools of science. In time we will do this and new industries and methods of production will evolve, some of which are hard to even imagine today. So there is still plenty of upside. The challenge we face is to make sure that the benefits of technological progress are widely shared. How well we do this could have a major bearing on the next chapter.

Beyond this broad theme, it is appropriate to recognise the important leadership role that the United States plays in the global economy. If the US economy does well, so does most of the rest of the world. The United States has long been a strong supporter of open markets and a rules-based international system. It has been the breeding ground for much of the progress in technology. And it has been a safe place for people to invest and an important source of financial capital for other countries. It is in our interests that the United States continues to play this important role. A retreat would make our lives more complicated.

Another important influence on the next chapter is how things play out in China. While growth in China is trending lower, the share of global output produced in China will continue to rise, as per capita incomes converge towards those in the more advanced economies (Graph 6). As this convergence takes place, the structure of the Chinese economy will change and so too will China’s economic relationship with Australia. Exports of resources will continue to be an important part of that relationship, but increasingly trade in services and other high valued-added activities, including food, will become more important. Notwithstanding this, there are risks on the horizon, with the Chinese economy going through some difficult adjustments. One of these is the switch from a growth model based on industrial expansion to one based more on services. Another is managing an increasingly large and complex financial system. Australia has a strong interest in China successfully managing these challenges.

Graph 6
Graph 6: OE GDP per Capita


Another shift in the global economy that could shape the next chapter is the growth of other economies in Asia. Developments in India and Indonesia bear especially close watching. Both of these countries, especially India, have very large populations, and per capita incomes are still quite low. In time, the effects of economic progress in these countries and others in the region could be expected to have a substantial effect on the Australian economy, just as the development of China has.

Normalisation of monetary conditions

A second likely plot line of the next chapter is a return to more normal monetary conditions globally. Since the financial crisis we have been through an extraordinary period in monetary history. Interest rates have been very low and even negative in some countries. Central banks have greatly expanded their balance sheets in order to buy assets from the private sector (Graph 7). This period of monetary expansion is now drawing to a close.

Graph 7
Graph 7: IFM Central Bank Balance Sheets


Some normalisation of monetary conditions globally should be seen as a positive development, although it does carry risks. It is a sign that economic growth in the advanced economies has become self-sustaining, rather than just being dependent on monetary stimulus. It would also lift the return to many savers who have been receiving very low returns on interest-bearing assets for a decade now.

On the other side of the ledger, periods of rising interest rates globally have, historically, exposed over-borrowing somewhere in the global system. Investment strategies that looked sensible when interest rates were very low tend not to look so good when interest rates are higher.

We can take some comfort from the major efforts over the past decade to improve the resilience of the global financial system. But at the same time, investors have increasingly been prepared to take more risk in the search for yield. Many continue to expect a continuation of low rates of inflation and low interest rates, despite quite low unemployment rates in a number of countries. So this is an area that is worth watching. If higher interest rates are the result of a surprise increase in inflation, financial markets could be in for a difficult adjustment.

A rise in global interest rates has no automatic implications for us here in Australia. Notwithstanding this, an increase in global interest rates would, over time, be expected to flow through to us, just as the lower interest rates have. Our flexible exchange rate though gives us considerable independence regarding the timing as to when this might happen.

Higher levels of debt

This brings me to a third plot line: that is, how we deal with the higher level of household debt and higher housing prices, especially in a world of more normal interest rates.

It is likely that higher levels of household debt change household spending patterns. Having increased their borrowing, households are less inclined to let consumption growth run ahead of growth in incomes for too long. Higher levels of debt also mean that household spending could be quite sensitive to increases in interest rates, something the Reserve Bank will be paying close attention to.

To date, households have been coping reasonably well with the higher debt levels. The aggregate debt-to-income ratio has trended higher, but the ratio of interest payments to income is not particularly high, given the low level of interest rates (Graph 8). Housing loan arrears remain low, although they have increased a little recently, especially here in Western Australia.

Graph 8
Graph 8: Household Mortgage Debt Indicators


Over recent times, one issue that the Reserve Bank has focused on is the build-up of medium-term risks from growth in household debt persistently outpacing that in household income. Our concern has been that, in this environment, a small shock could turn into a more serious correction as households seek to repair their balance sheets. We have been working with APRA through the Council of Financial Regulators to address this risk. The various measures are having a positive impact in improving the resilience of household balance sheets.

A broadening of the drivers of growth

The fourth likely plot line is a broadening of the drivers of growth in the Australian economy. How the next chapter in our economic history turns out depends partly on our ability to lift productivity growth across a wide range of industries. The resources sector will, no doubt, continue to make an important contribution to the Australian economy, but it is unlikely that it will shape the next chapter in our economic history as it did the current chapter. With another major upswing in the terms of trade unlikely and the working-age share of our population having peaked as the population ages, improving productivity will be key to growth in our national income.

The drivers of growth are changing: they increasingly depend on our ability to produce innovative goods and services in a rapidly changing world. In this world, it is difficult to make precise predictions about where the jobs and growth in our economy are going to come from in the future. But it seems clear that we will be best placed to take advantage of whatever possibilities arise if businesses and our workforce are innovative and adaptable.

Australia is fortunate to have a natural resource base that provides an important source of national income, and this will remain the case. But in this next chapter we will need to look more directly to the skills of our workers and our businesses to drive economic growth. If we are to take advantage of the opportunities that are offered by technology and growth in Asia, we need a flexible workforce with strong skills in the areas of problem solving, critical thinking and communication. Investment in human capital will be one of the keys to success. We also need a competitive business environment that encourages innovation. How well the next chapter turns out will depend on how we do in these areas.

So, in summary these are some of the themes we might expect to see in the next chapter – the impact of technology and the growth of Asia; the normalisation of monetary conditions; the effects of higher levels of household debt; and the capability of our workforce and businesses to be flexible, innovative and adaptable.

This is, obviously, not a complete list. There are clearly other factors that could have a major influence on the storyline, including how geopolitical tensions are resolved and how we adjust to climate change. And no doubt there will be surprises as well.

But overall, I remain optimistic about how this next chapter might unfold. While we have our challenges, some of which I have talked about, we also have some advantages. We have a strong institutional and policy framework, a skilled, growing and diverse population and a wealth of mineral and agricultural resources. We have strong links to Asia, the fastest growing part of the global economy. We also have a flexible economy with a demonstrated capacity to adjust to a changing world.

These factors should give us confidence about our future. But we can’t rest on this and there are a number of significant risks. The world is a competitive place and the global economy is continuing to go through some challenging adjustments. If we are to do well in this world, we need to keep investing in both physical and human capital. We also need to keep investing in policy reform.

Finally, I have said relatively little about monetary policy today. This is partly because there are other forces that are likely to be more important in shaping the next chapter of the Australian economy. Monetary policy has an important role to play in supporting the economy as it goes through the current period of adjustment. It can also help stabilise the economy when it is hit by future shocks. Monetary policy can make for a more predictable investment climate by keeping inflation low and stable. Having a competent, analytical, transparent and independent central bank can also be a source of confidence in the country. But beyond these effects, monetary policy has little influence on the economy’s potential growth rate.

Over recent times, the Reserve Bank Board has not sought to overly fine-tune things. We have provided support and allowed time for the economy to adjust to the new circumstances. In its decisions, the Board has been careful to balance the benefit of providing this support with the risks that can come from rising household debt. As things currently stand, we look to be on course to make further progress in reducing unemployment and moving towards the midpoint of the medium-term inflation target. This would be a good outcome.

Fed Holds Stance on Rate Hikes

In the September 2017 statement the FED remains bullish on the US economy, and says it will start to normalise its balance sheet in October (reversing QE).

Bond yields rose, putting upward pressure on capital market funding. In fact there has been a significant change in trajectory since mid September, with yields rising again.

The immediate impact on US mortgage rates was to lift them, and the expectation is more down the track.

All this points to more upward pressure on Australian mortgage rates, thanks to a combination of higher bank funding costs, and the sense the RBA may lift sooner than was expected even a few days ago.

This will all play out over the next few months, but the sense we get from the market is a stronger view of higher rates sooner.

Here is the Fed’s statement:

Information received since the Federal Open Market Committee met in July indicates that the labor market has continued to strengthen and that economic activity has been rising moderately so far this year. Job gains have remained solid in recent months, and the unemployment rate has stayed low. Household spending has been expanding at a moderate rate, and growth in business fixed investment has picked up in recent quarters. On a 12-month basis, overall inflation and the measure excluding food and energy prices have declined this year and are running below 2 percent. Market-based measures of inflation compensation remain low; survey-based measures of longer-term inflation expectations are little changed, on balance.

Consistent with its statutory mandate, the Committee seeks to foster maximum employment and price stability. Hurricanes Harvey, Irma, and Maria have devastated many communities, inflicting severe hardship. Storm-related disruptions and rebuilding will affect economic activity in the near term, but past experience suggests that the storms are unlikely to materially alter the course of the national economy over the medium term. Consequently, the Committee continues to expect that, with gradual adjustments in the stance of monetary policy, economic activity will expand at a moderate pace, and labor market conditions will strengthen somewhat further. Higher prices for gasoline and some other items in the aftermath of the hurricanes will likely boost inflation temporarily; apart from that effect, inflation on a 12-month basis is expected to remain somewhat below 2 percent in the near term but to stabilize around the Committee’s 2 percent objective over the medium term. Near-term risks to the economic outlook appear roughly balanced, but the Committee is monitoring inflation developments closely.

In view of realized and expected labor market conditions and inflation, the Committee decided to maintain the target range for the federal funds rate at 1 to 1-1/4 percent. The stance of monetary policy remains accommodative, thereby supporting some further strengthening in labor market conditions and a sustained return to 2 percent inflation.

In determining the timing and size of future adjustments to the target range for the federal funds rate, the Committee will assess realized and expected economic conditions relative to its objectives of maximum employment and 2 percent inflation. This assessment will take into account a wide range of information, including measures of labor market conditions, indicators of inflation pressures and inflation expectations, and readings on financial and international developments. The Committee will carefully monitor actual and expected inflation developments relative to its symmetric inflation goal. The Committee expects that economic conditions will evolve in a manner that will warrant gradual increases in the federal funds rate; the federal funds rate is likely to remain, for some time, below levels that are expected to prevail in the longer run. However, the actual path of the federal funds rate will depend on the economic outlook as informed by incoming data.

In October, the Committee will initiate the balance sheet normalization program described in the June 2017 Addendum to the Committee’s Policy Normalization Principles and Plans


Why Property Investors Are Less Bullish Now

Continuing our analysis of our households surveys to September 2017, today we look at the property investor segments (which account for one third of mortgage loans).  We already highlighted that investors have become less bullish about future home price growth:

For example, in 2015, 77% of portfolio investors were intending to transact, today this is down to 57%, and the trend in down. Solo investors are down from a high of 49% to 31%, and again is trending lower.

Now we look at what is causing this.

The underlying reason for Investors to transact has been changing, with the tax breaks (40%), and better returns than deposit account savings (35%) together now accounting for two-thirds of the motivation.  Appreciating property values has been squeezed (10%), as has access to low rate finance (5%).

Turning to the barriers which investors face, the difficulty in getting finance is on the rise (29%), along with concerns about rate rises (12%). Other factors, such as RBA warnings (3%), budget changes (1%) only registered a little but concerns about increased regulation rose (7%) . Around one third though already hold investment property (33%) and so will not be buying more in the next year. So, net demand is weakening.

The importance, when it comes to obtaining finance, of the price in the purchase decisions for investors is clear. Flexibility and loyalty to a specific lender count for naught.

Those investing via a SMSF exhibit somewhat similar drivers in terms of motivation to transact, with tax efficiency a strong motivator (37%), as well as appreciating property values (22%), and leverage ( 17%).

We see some changes in where SMSF Trustees get their advice, with more relying on internet forums or sites (23%), their own knowledge (20%) and a mortgage broker (16%).  Advice from real estate agents is on the rise, (14%), and is now similar to accountants (13%).

 The mix of property held in SMSF has not changed much, with 70% holding less that 40% of their investments in property.

Next time we look at first time buyers.

RateSetter Passes $150m in loans

Peer-to-peer lender RateSetter has now reached the $150m mark in loans facilitated thanks to a rapid influx of lenders into the platform.

They provide data on their portfolio via their web site, great disclosure (mainstream players take note!).  From this we see that debt consolidation and home improvement were the two main purposes, and the average debt consolidation loan was ~$20,000.

The average rate varies by term.

The term of loan distribution varies across the age bands.

Commentary from Australian Broker says that Millennial investors have helped to drive this growth, especially in RateSetter’s one-month market where these younger demographics make up 72% of the lender’s investors since the firm launched in 2014. This is followed by the one-year market where Millennials make up 40% of all investors.

“Far from wasting money on avocado toast, these young investors are seizing the opportunity to make their money work hard. For a variety of reasons they may want ready access to their money, so the one-month market gives them a stable, attractive return of around 4% p.a and easier access to cash if they need it,” said RateSetter CEO Daniel Foggo.

Investment in the platform has risen by 50% over the last five months alone after RateSetter hit the $100m loan milestone in March. There are now more than 7,700 investors registered with the platform, making RateSetter the largest P2P lender in Australia.

Foggo said that RateSetter had reached the $150m milestone sooner than anticipated because it provided added competition to the banking sector.

“We are giving everyday Australians a genuine alternative to traditional investment options; offering far more attractive returns across both our short term and longer term markets.

“Our growth has also been supported by banks doing a fantastic job of destroying the trust their customers once held. An increasing number of younger investors are showing they trust new economy services, including peer-to-peer lending, rather than traditional institutions, to act in their interests and help them achieve their financial goals.”

While younger investors seek more short-term lending options, older investors have more of a bias towards longer-term alternatives. A full breakdown of RateSetter’s data can be found below:

For the one-month market, the average amount invested has increased from $3,777 two years ago to $11,483 today.

“RateSetter’s savvy investors are making their money work hard. Instead of leaving it in accounts offering poor returns, they are seizing the opportunity to earn a decent rate of return, even if it’s only for a month”,” Foggo said.

“Younger Australians realise that they won’t get ahead by leaving their cash in a low interest rate bank account, so they are prepared to take a small amount of risk to earn better interest rates.”

CBA Sells Life Insurance Businesses

Commonwealth Bank today announced the sale of 100% of its life insurance businesses in Australia (“CommInsure Life”) and New Zealand (“Sovereign”) to AIA Group Limited (“AIA”) for $3.8 billion (the “Transaction”). The sale agreement also includes a 20-year partnership with AIA for the provision of life insurance products to customers in Australia and New Zealand.

CommInsure Life and Sovereign customers will retain all the current benefits of their existing policies. The Transaction and partnership announced today will allow customers to have continued access to high quality life insurance products through Commonwealth Bank and life and health insurance products through ASB, with the addition of AIA solutions to our offerings. Customers will benefit from AIA’s innovation in life insurance including a focus on digital engagement, the benefits and synergies of global scale and specialisation, and their strong bancassurance experience.

AIA is the largest independent publicly listed pan-Asian life insurance group and has well established life insurance businesses in Australia and New Zealand. The combined operations from this transaction will make AIA the market leader in both Australia and New Zealand.

Commonwealth Bank Chief Executive Officer Ian Narev said: “Providing our customers with access to high quality products and services for all their financial needs is core to our vision of securing and enhancing financial wellbeing. We have said for some time that while distributing life insurance is a fundamental part of that strategy, we were open to different models for doing so. The combination of AIA’s leading insurance capability and scale and Commonwealth Bank’s broad distribution, and our complementary values and commitment to customer focus and innovation, mean that a partnership between us will create an even better experience for our customers, in a more efficient way for our shareholders.”

AIA Group Chief Executive and President, Ng Keng Hooi, said: “The acquisition of CBA’s life insurance businesses and the new 20-year bancassurance partnership with CBA will strengthen AIA’s protection market leadership and expand our distribution capabilities in these markets. We look forward to welcoming our new customers and colleagues, and working with CBA to deliver innovative insurance products and services that meet the growing financial protection needs of customers across Australia and New Zealand.”

The Transaction will deliver important strategic benefits to Commonwealth Bank, contributing to the Group’s vision to secure and enhance the financial wellbeing of customers whilst creating value for shareholders.

The sale price is $3.8 billion, a multiple of 16.9x FY17 pro forma earnings and 1.1x the embedded value of CommInsure Life and Sovereign. A pre-completion dividend is also expected to be received by Commonwealth Bank (amount subject to the timing of completion, business performance and regulatory approvals).

Under the terms of the partnership, Commonwealth Bank will continue to earn income on the distribution of life and health insurance products.

The Transaction is expected to release approximately $3 billion of Common Equity Tier 1 (“CET1”) capital and result in a pro forma uplift to the Group’s FY17 CET1 ratio of approximately 70 basis points on an APRA basis. Due predominantly to the carrying value of goodwill, the Transaction is expected to result in an indicative after tax accounting loss on sale of approximately $300 million, net of separation and transaction costs.

The Transaction and partnership do not include general insurance and the CommInsure brand will be retained. The Transaction is subject to certain conditions and regulatory approvals in Australia and New Zealand and is also conditional upon the transfer of Commonwealth Bank’s equity interest in BoComm Life Insurance Company Limited (“BoComm Life”) out of CommInsure. Commonwealth Bank is considering a range of strategic alternatives for the BoComm Life equity interest, which would be conditional on approval from the China Insurance Regulatory Commission. The Transaction is expected to be completed in calendar year 2018.