A Floor Under Property Price Falls

The ABS today released March 2017 demographic statistics, which shows that natural population growth is being dwarfed by net overseas migration. All these new households will need somewhere to live, so they be competing with existing residents for property, both in the rental sector, and for purchase. This is likely to put a floor under property demand and so home prices.

Bottom line, there is a strong link between home prices and population growth.  So, one lever which should be considered to take the sting out of the property cycle is to reduce net migration. Politically speaking, this appears unlikely as a “big Australia” strategy lays behind much of current public discourse.

The ABS says that the preliminary estimated resident population (ERP) of Australia at 31 March 2017 was 24,511,800 people. This is an increase of 389,100 people since 31 March 2016, and 126,100 people since 31 December 2016.

Within that, the preliminary estimate of natural increase for the year ended 31 March 2017 (142,400 people) was 5.8%, or 8,800 people lower than the natural increase recorded for the year ended 31 March 2016 (151,300 people).

The preliminary estimate of net overseas migration (NOM) for the year ended 31 March 2017 (231,900 people) was 26.9%, or 49,100 people higher than the net overseas migration recorded for the year ended 31 March 2016 (182,800 people).

Significantly, the state with the highest growth rate was Victoria, which is currently seeing the strongest auction clearance rates, strong demand, and home price growth. This is not a surprise, given the high migration

The ABS says Australia’s population grew by 1.6% during the year ended 31 March 2017. Natural increase and NOM contributed 36.6% and 59.6% respectively to total population growth for the year ended 31 March 2017 with intercensal difference accounting for the remainder. All states and territories recorded positive population growth in the year ended 31 March 2017. Victoria recorded the highest growth rate of all states and territories at 2.4%. The Northern Territory recorded the lowest growth rate at 0.1%.


RACQ Launches Regional Bank

From Australian Broker.

Motoring association and mutual organisation Royal Automobile Club of Queensland (RACQ) has launched the RACQ Bank brand, opening 13 branches across the state.

Unveiled 25 September, the bank will provide personal banking products including mortgages to RACQ’s 1.6 million members.

“We’re committed to giving members honest, easy and great value banking products and services, without any hidden fees or excessive charges,” said RACQ group CEO Ian Gillespie.

“We’re also one of Queensland’s last remaining mutual banks, and we are working for our members not for shareholders. Any profits the bank makes will be reinvested back into the RACQ ecosystem for the benefit of our members here in Queensland.”

In the first step of the bank’s expansion strategy, home loans will be offered through direct channels, RACQ Bank CEO Steve Targett told Australian Broker.

Targett was the former CEO of QT Mutual Bank, eventually becoming CEO of RACQ Bank after it acquired QT Mutual in November 2016.

“QT Mutual was a lot smaller. We had about 67,000 members. RACQ has got 1.6 million so the first step of our strategy is to penetrate that member base with personal banking products – the main one of which is mortgages,” he said. “Then we’ll look at the next step of our strategy in terms of penetrating our member base and cross-selling products.”

The bank will consider working with brokers at a later stage once these initial phases are completed, he added.

“It’s on our critical path of things to look at but not in the next six months. At some stage, it’s something that we’ve got to look at and will probably be one of the next things once we feel we’ve got our basic capabilities right.”

The bank’s main products – residential mortgages, car loans and personal loans – will be distributed across Queensland through RACQ Bank’s 13 branches and RACQ’s 34 stores.

“We need to look at providing some sort of banking capability out of some of RACQ’s stores particularly in areas where we don’t have branches. There are quite a few RACQ members up the seaboard between the Sunshine Coast and Townsville. We’ve got some stores there but we don’t have any bank branches. These are things that we need to look at.”

Building a team of mobile lenders was also on the agenda so that banking products could be offered to customers in remote locations, Targett said.

RACQ Bank’s loans will be funded directly through its equity such as transaction accounts and term deposits. The bank can also access wholesale funds through negotiable certificates of deposit or medium-term notes and can draw additional capital through RACQ itself.

Suncorp removes ATM fees

Suncorp will remove fees for all non-Suncorp customers so that no  customer pays an ATM fee anywhere in Australia.

Suncorp Executive General Manager Deposits & Investments, Bruce Rush says the change will deliver greater value to all banking customers while increasing the availability of fee-free ATMs across the country.

“Suncorp supports fee-free ATMs and we will implement this change in early December to coincide with other positive changes, including updating technology and enhancing customer experience which is already planned for our ATM network,” Mr Rush said.

“It is great to see all Australians benefit and we are especially pleased for Suncorp customers who live in locations where there are limited options to withdraw cash.”

Excessive Credit Main Cause Of Personal Insolvencies

New data from the Australian Financial Security Authority shows that in 2016–17, the most common non-business related causes of debtors entering personal insolvencies were:

  • excessive use of credit (8,870 debtors)
  • unemployment or loss of income (8,035 debtors)
  • domestic discord or relationship breakdown (3,222 debtors).

However, employment related issues figured first in WA and SA. Here is an extract from their report:

Non-business related causes of personal insolvencies, 2016–17

Non-business related causes of personal insolvencies 2016–17

While these were the three most common causes of debtors entering non-business related personal insolvencies in every financial year from 2007–08 to 2015–16, excessive use of credit overtook unemployment or loss of income as the single most common cause in 2016–17.

Non-business related debt agreements have increased since 2007–08

The shift towards excessive use of credit is associated with the growing number and proportion of debt agreement personal insolvencies year by year (both at a record level in the June quarter 2017; see personal insolvency statistics and business and non-business statistics for further information). In the period from 2007–08 to 2016–17, debt agreements have increased from 22.9% of non-business related personal insolvencies to 50.1%. In non-business related debt agreements, excessive use of credit has been the most common cause in every year since 2011–12.

Bankruptcies comprised 49.2% of non-business related personal insolvencies in 2016–17, and personal insolvency agreements comprised 0.7%.

The most common non-business related causes of personal insolvencies are similar for all states and territories

In 2016–17, excessive use of credit was the most common non-business case of new personal insolvencies in Australia. This was also the most common cause in 2016–17 in all states and territories except Western Australia, South Australia and Tasmania. Unemployment or loss of income was the most common cause in Western Australia and South Australia. In Tasmania, an equal number of debtors entered into personal insolvencies due to excessive use of credit and unemployment or loss of income. In all cases (as for Australia), the third most common cause was domestic discord or relationship breakdown.

State or territory Most common non-business cause Number of new debtors % total new debtors in a non-business related personal insolvency
New South Wales Excessive use of credit 2,660 36.4%
Australian Capital Territory Excessive use of credit 126 37.6%
Victoria Excessive use of credit 1,696 35.5%
Queensland Excessive use of credit 2,627 35.4%
South Australia Unemployment or loss of income 530 33.8%
Northern Territory Excessive use of credit 104 41.3%
Western Australia Unemployment or loss of income 994 35.8%
Tasmania Excessive use of credit / Unemployment or loss of income 217 34.0%
Australia** Excessive use of credit 8,870 35.2%

*Includes other and unknown state or territory

Most debtors entering non-business related personal insolvencies are male

In 2016–17, 13.3% more men than women entered new non-business related personal insolvencies. This disparity extended across most non-business related causes of personal insolvency. The cause with the highest sex ratio (that is, the ratio of men to women in the debtor population) was gambling or speculation (2.3). More women than men cited ill health and domestic discord or relationship breakdown as causes of new non-business related personal insolvencies (sex ratios of 0.9 and 0.7 respectively).

Non-business related causes by sex, 2016–17*

Main non-business related cause of personal insolvency Number of male debtors Number of female debtors
Excessive use of credit 4,566 4,299
Unemployment or loss of income 4,311 3,707
Domestic discord or relationship breakdown 1,376 1,843
Ill health 874 950
Gambling or speculation 363 161
Adverse legal action 238 148
Liabilities due to guarantees 132 100
Other non-business reason or unknown 1,519 602
Total 13,379 11,810

*Excludes records where debtors did not disclose their sex.

The median age of debtors entering non-business related personal insolvencies varies by cause

In 2016–17, the highest median age of debtors entering new non-business related personal insolvencies was among those who cited the causes adverse legal action and liabilities due to guarantees (both 46 years). Those who cited excessive use of credit had the lowest median age of 36 years. The median age of all new debtors entering non-business related personal insolvencies was 38.

Median age of debtors entering non-business related personal insolvencies in 2016–17 by cause, Australia

Main non-business related reason for entering a personal insolvency Median age of new debtors*, 2016–17 (years)
Adverse legal action 46
Liabilities due to guarantees 46
Ill health 43
Gambling or speculation 40
Domestic discord or relationship breakdown 38
Unemployment or loss of income 37
Excessive use of credit 36
Total 38

*Where an age was recorded


The Trading Up and Trading Down Imbalance

Just rounding out our analysis of households and their property buying inventions, having looked at investors and first time buyers we now turn to those seeking to trade up (sell their current property and buy bigger) and those trading down (sell their current property and buy smaller).

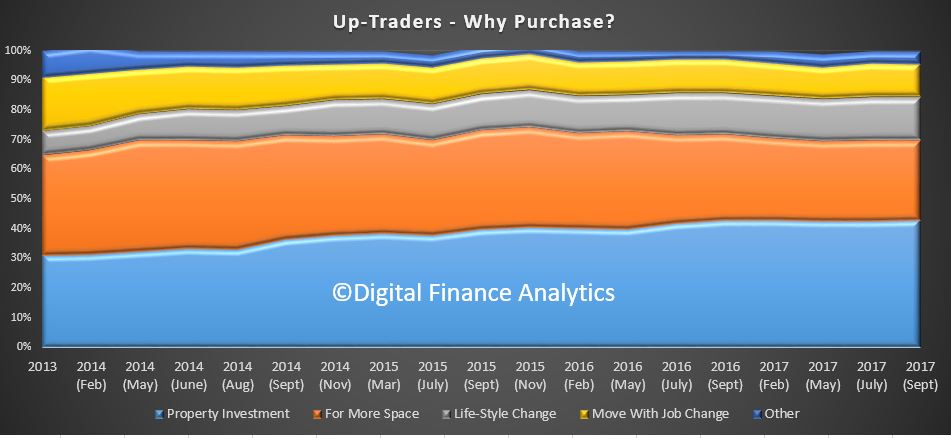
Those trading up are driven by expectations of greater capital growth (42%), for more space, 27%, life-style change (14%) and job change (11%).

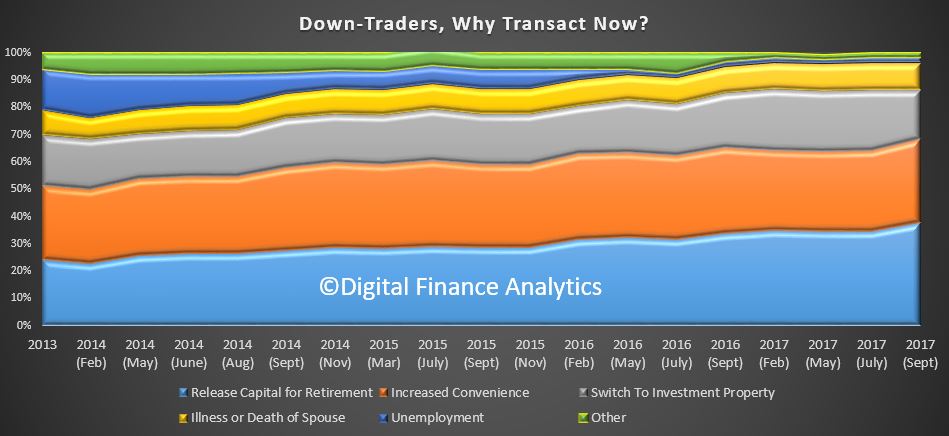
Those seeking to trade down are driven by the desire to release capital for retirement (37%), to move to a place which is more convenient (either location, or for easier maintenance) (31%), or a desire to switch to, or invest in an investment property (18%).

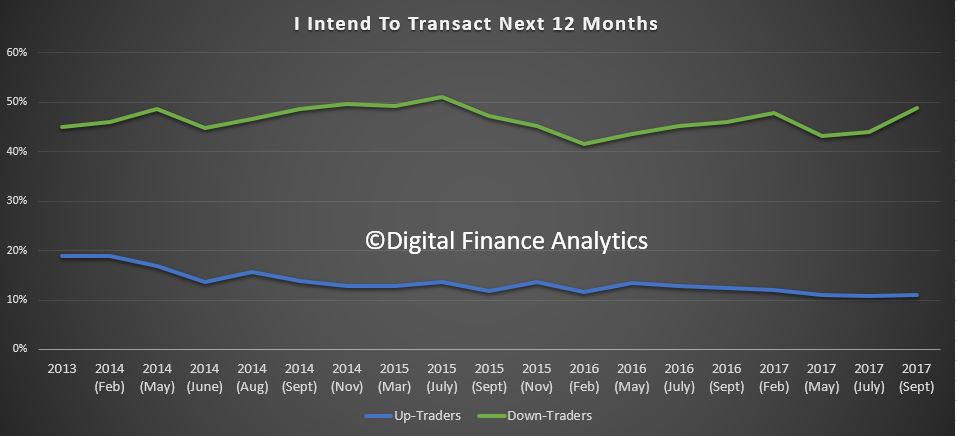
In the past we saw a relative balance between those seeking to trade up and those seeking to trade down, but this is now changing.

Intention to transact, highlights that relatively more down traders are expecting to transact in the next year, compared with up traders.

Given that there around 1.2 million Down Traders and around 800,000 Up Traders, we think there will be more seeking to sell, than buyers able to buy. As a result, this will provide a further drag on future price growth, especially in the middle and upper segments of the markets, where first time buyers are less likely to transact. This simple demand/supply curve provides another reason why prices may soon pass their peaks. Up Traders have more reason to delay, while Down Traders are seeking to extract capital, and as a result they have more of a burning platform.

This analysis will be taken further in the next edition of the Property Imperative, due out in a month or so. Meantime, you can still get the April 2017 edition.


Australia Rises In Global Alt-Lending Ranks

From Pymnts.com

Australia is now the Asia Pacific region’s second-largest alternative finance market, largely due to a favorable regulatory climate, according to new KPMG analysis.

The Australian market is quickly becoming a hotbed of alternative lending, and new analysis from KPMG suggests it has risen up in the ranks.

According to a new report from KPMG’s Cambridge Centre for Alternative Finance and the Australian Centre for Financial Studies, Australia could now be the Asia Pacific region’s second-largest alternative lending market, close behind China. News reports in the International Business Times on Friday (Sept. 22) said that a survey of 600 online alternative finance firms across the Asia Pacific found that Australia’s market grew 53 percent in the last year alone.

A key driver of that growth is favorable government policies, researchers said, with regulators around the world exploring how to ensure borrower protections without stifling innovation. About two-thirds of survey respondents said Australia’s regulatory climate is appropriate for the alternative lending industry.

While alternative finance remains a small portion of the overall lending market, the report also found that the Asia Pacific region is experiencing significant overall growth in this space.

China, though, is the clear winner, with its AltFin market accounting for 99.2 percent of the total Asia Pacific market, reports said.

The Australian government may be looking to facilitate growth of the alternative finance space, but research released in June suggested the industry has another hurdle to overcome: awareness.

Data from Moula and the research and consulting firm Digital Finance Analytics, outlined in their Disruption Index report, found there is room for the industry to gain traction by increasing visibility among small business borrowers.

“There is still a certain air of skepticism about non-traditional forms of lending,” said DFA Principal Martin North in an interview with Australian Broker at the time. “So, SMEs who need to borrow tend to still go to the normal suspects. They’ll look to the banks or put it on their credit cards.”

He added that this means the alternative finance industry has to work harder to boost awareness and promote education.

“I think the FinTech sector has a terrific opportunity to lend to the SME sector, but they haven’t yet cracked the right level of brand awareness,” North continued. “Perhaps they need to think about how they use online tools, particularly advertising, to re-energize the message that’s out there.”

ANZ tightens up on apartment lending

From The Advisor

ANZ has announced that it will be implementing new restrictions on some loans for residential apartments, units and flats in Brisbane and Perth.

Effective Monday, 2 October, there will be a maximum 80 per cent loan-to-value ratio (LVR) for owner-occupier and investment loans for all apartments in the following inner-city Brisbane postcodes:
– 4000
– 4006
– 4010
– 4011
– 4014
– 4102
– 4171

There will likewise be a new restriction on investment lending for apartments in some areas of inner-city Perth.

Also from 2 October, there will be a maximum 80 per cent LVR for investment loans for apartments in these Perth postcodes:
– 6000
– 6004
– 6104
– 6151

These policy changes apply to all apartments in affected postcodes, including off-the-plan and non-standard small residential properties (≥40m2 & <50m2) valued at less than $3 million.

Granny flats are not impacted by this change.

ANZ has told brokers that applications submitted prior to 2 October 2017 will be assessed under the previous policy (as will applications that have been granted an extension prior to Monday, 6 November 2017).

A spokesperson for the bank commented: “This update for a handful of Brisbane and Perth locations is part of our ongoing efforts to ensure we are lending responsibly and in consideration of all our regulatory responsibilities.

“We regularly look at a number of factors in relation to residential apartments to make sure we are meeting our responsibilities, including supply and demand, rental yield, vacancy rates and location.”

The moves come amid increasing concern of oversupply in apartment building, with several developers making headlines recently for being left with unsold apartments.

Analysts at BIS Oxford Economics suggested in June that new apartment completions in Australia that have been largely bought off the plan by investors will hit a record this year and “most cities will find that tenant demand will not be sufficient to support rents and consequently values”.

According to the report, the whole of Australia, barring NSW which is “heavily undersupplied”, will be in oversupply over the next three years, with the unit market likely to face more challenges than the house market as a result of APRA constraints on investor lending.

Further tightening could be on the horizon

Speaking to The Adviser, Ranjit Thambyrajah, managing director of Acuity Funding, suggested that there could be further tightening by ANZ in the coming months.

The commercial broker said: “Perth has been slowing down and slow for quite a while now and Brisbane is heading that way quite quickly. ANZ, in particular, pulled out of lending for both those states for development a little while ago, so I think [this recent change] is just following on from that.

“I think it’s probably going to be more than those areas, actually. I think they are going to face difficulty in other areas as well, in terms of oversupply.”

He explained: “We’re in the business of funding the developments and we are experiencing a lot of difficulty in funding things in Queensland, particularly with the ANZ bank, and we have the same situation in WA. So, they perceive the oversupply as going to continue for a while, but currently the areas that they are quoted on are the ones that they are experiencing most oversupply in.”

While Mr Thambyrajah said that other areas experiencing oversupply of apartments, such as Melbourne and some areas of Sydney, will “start feeling more tightening as well”, he said that he is not overly concerned by the changes.

“Just because one bank is not lending does not mean others are not. It really depends on their prudential limits to the area and also the blend of their book in terms of APRA guidelines as well.

“So, I’m not concerned by this at all. I think it just changes from month to month and bank to bank.”

ANZ also tightened their underwriting standards according to MPA by issuing a Customer Interview Guide..

Yesterday ANZ issued a Customer Interview Guide which specific which topics brokers should discuss with home and investment loan borrowers.

“We expect brokers to use a customer interview guide (CIG) to record customer conversations as a minimum moving forward,” noted ANZ “while it is not required to submit the CIG with the application, it should be made available when requested as a part of the qualitative file reviews.”

Banking Misdirection and the BEAR

According to Wikipedia, Misdirection is a form of deception in which the attention of an audience is focused on one thing in order to distract its attention from another. Managing the audience’s attention is the aim of all theatre; it is the foremost requirement of theatrical magic.

An article From The New Daily. suggests the banks employed this tactic by using Sundays announcements about the end of ATM fees to distract attention from the BEAR draft legislation released the previous Friday.  We had already covered the BEAR on our blog but more generally I agree the potential coverage was diluted thanks to the ATM news.

It is worth looking at the limitations of BEAR, especially as conduct relating to consumer outcomes is excluded, the focus on the rules relate to prudential matters. In the UK, who have similar measures on place, they also included consumer related bad practice.  The rules should have similar reach here, because this is actually the central issue banks need to address.

Will BEAR help consumers?

According to consumer advocate CHOICE and the Consumer Action Law Centre, not really. In a joint submission to the government, the two groups pointed out that these rules only applied to prudential matters – that is, matters relating to systemic financial integrity. They did not apply to consumer matters.

The difference between the two is best understood as follows: the global financial crisis was essentially a prudential crisis. Overseas banks were lending more than they could afford, and (to put it simply) they ran out of money.

The CBA financial advice scandal, meanwhile, was a consumer issue. It involved bank representatives doing the wrong thing by customers.

CHOICE and the Consumer Action Law Centre urged the government to imitate similar laws in the UK, and extend the BEAR to consumers. That would mean bringing in the consumer watchdog ASIC as well as the prudential watchdog APRA.

But the draft legislation reveals the government has not done this. It has also crafted loopholes that allow both itself and the regulator freedom to relax the rules in special (unspecified) circumstances.

These moves suggest the government isn’t quite as tough on banks as it would have the public believe.

Auction Volumes Increase Across All But One of the Capital Cities This Week

From CoreLogic.

Auction volumes increase across all but one of the capital cities this week, returning a preliminary clearance rate of 70.7 per cent across 2,759 auctions.

Auction volumes have increased across all but one of the capital cities this week with a total of 2,759 homes taken to auction, making it the busiest week for auctions since the end of May. So far, 2,226 results have been reported to CoreLogic, returning a preliminary clearance rate of 70.7 per cent, up from last week’s final clearance rate of 66.7 per cent across 2,510 auctions.

The final clearance rate across the combined capital cities has been holding around 66 per cent for the last 3 weeks so it will be interesting to see if this is the case again on Thursday once the remaining results have been collected. One year ago, the final auction clearance rate was recorded at 75.4 per cent and there were 2,480 auctions held across the capital cities.

2017-09-25--auctionresultscapitalcities

CBA introduces new IO ‘simulator’

From Australian Broker.

The Commonwealth Bank of Australia (CBA) has announced a compulsory new digital tool, the Interest Only Simulator, which will be incorporated into its third party lending process.

The simulator will be accessible through CommBroker and will show customers the differences between IO and P&I repayments as well as the financial impacts over the life of the loan for both types of loans. It will be mandatory from 6 October for all customers applying for a new interest only loan.

“The new tool will make it easier for our brokers to have conversations with customers about their needs and their loan options. It will also help ensure customers understand what type of loan is best for them and their situation,” a CBA spokesperson told Australian Broker.

A compulsory Customer Acknowledgement Form will also be included in the simulator. This will be submitted with all interest only home loan applications to ensure that those payments meet the client’s needs.

Brokers are required to provide customers with a copy of this form as a record of the discussion. This can be done electronically as a pdf attachment via email.

“We encourage our customers to choose principal and interest repayments to help them build equity in their home, where this meets their needs and objectives. Customers who currently make interest only payments are encouraged, where they are able, to switch to principal and interest repayments,” the spokesperson said.