Income inequality may be declining but financial vulnerability is increasing

From The Conversation.

If you needed A$2,000 in a hurry where would you get it? 70% of those we surveyed said they would ask friends or family, although almost half said that it’s very or fairly unlikely that their social connections could help.

This is just one of the takeaways from our new report, funded by NAB, that shows financial resilience is declining in Australia. Large numbers of Australians are struggling to meet expenses, pay bills and manage or recover from financial shocks despite two decades of GDP growth, declining income inequality and increasing financial capability.

And while more adults in Australia are reporting regular social contact, and fewer are reporting needing community or government support, the number of Australians needing support but not receiving it has increased from 3.2% to 5.3%.

The problem is especially acute for those on low incomes. A recent report found most low-income households are unable to afford a minimum and healthy standard of living, with their incomes falling short by between A$9 and A$89 a week.

In this week’s Household Expenditure Survey, the Australian Bureau of Statistics found that two in every five households are experiencing at least one indicator of financial stress. In households with incomes in the bottom 40%, this ratio increases to one in two.

People on the lowest incomes are:

  • 12 times more likely to be unable to raise A$2,000 in a week for something important
  • Five times more likely to be unable to pay a utility bill on time
  • Ten times more likely to be unable to heat their homes than the highest income households.

The lowest income households are also more likely to be socially isolated than the highest income group. For example, they were at least ten times more likely to be unable to afford a special meal once a week or a night out once a month.

As you can see in the above graphic, the proportion of Australian adults who are financially secure has decreased significantly between 2015 and 2016, from 35.7% to 31.2%. One in eight Australians (12.6%) now experience severe or high financial stress, up from 11.1%.

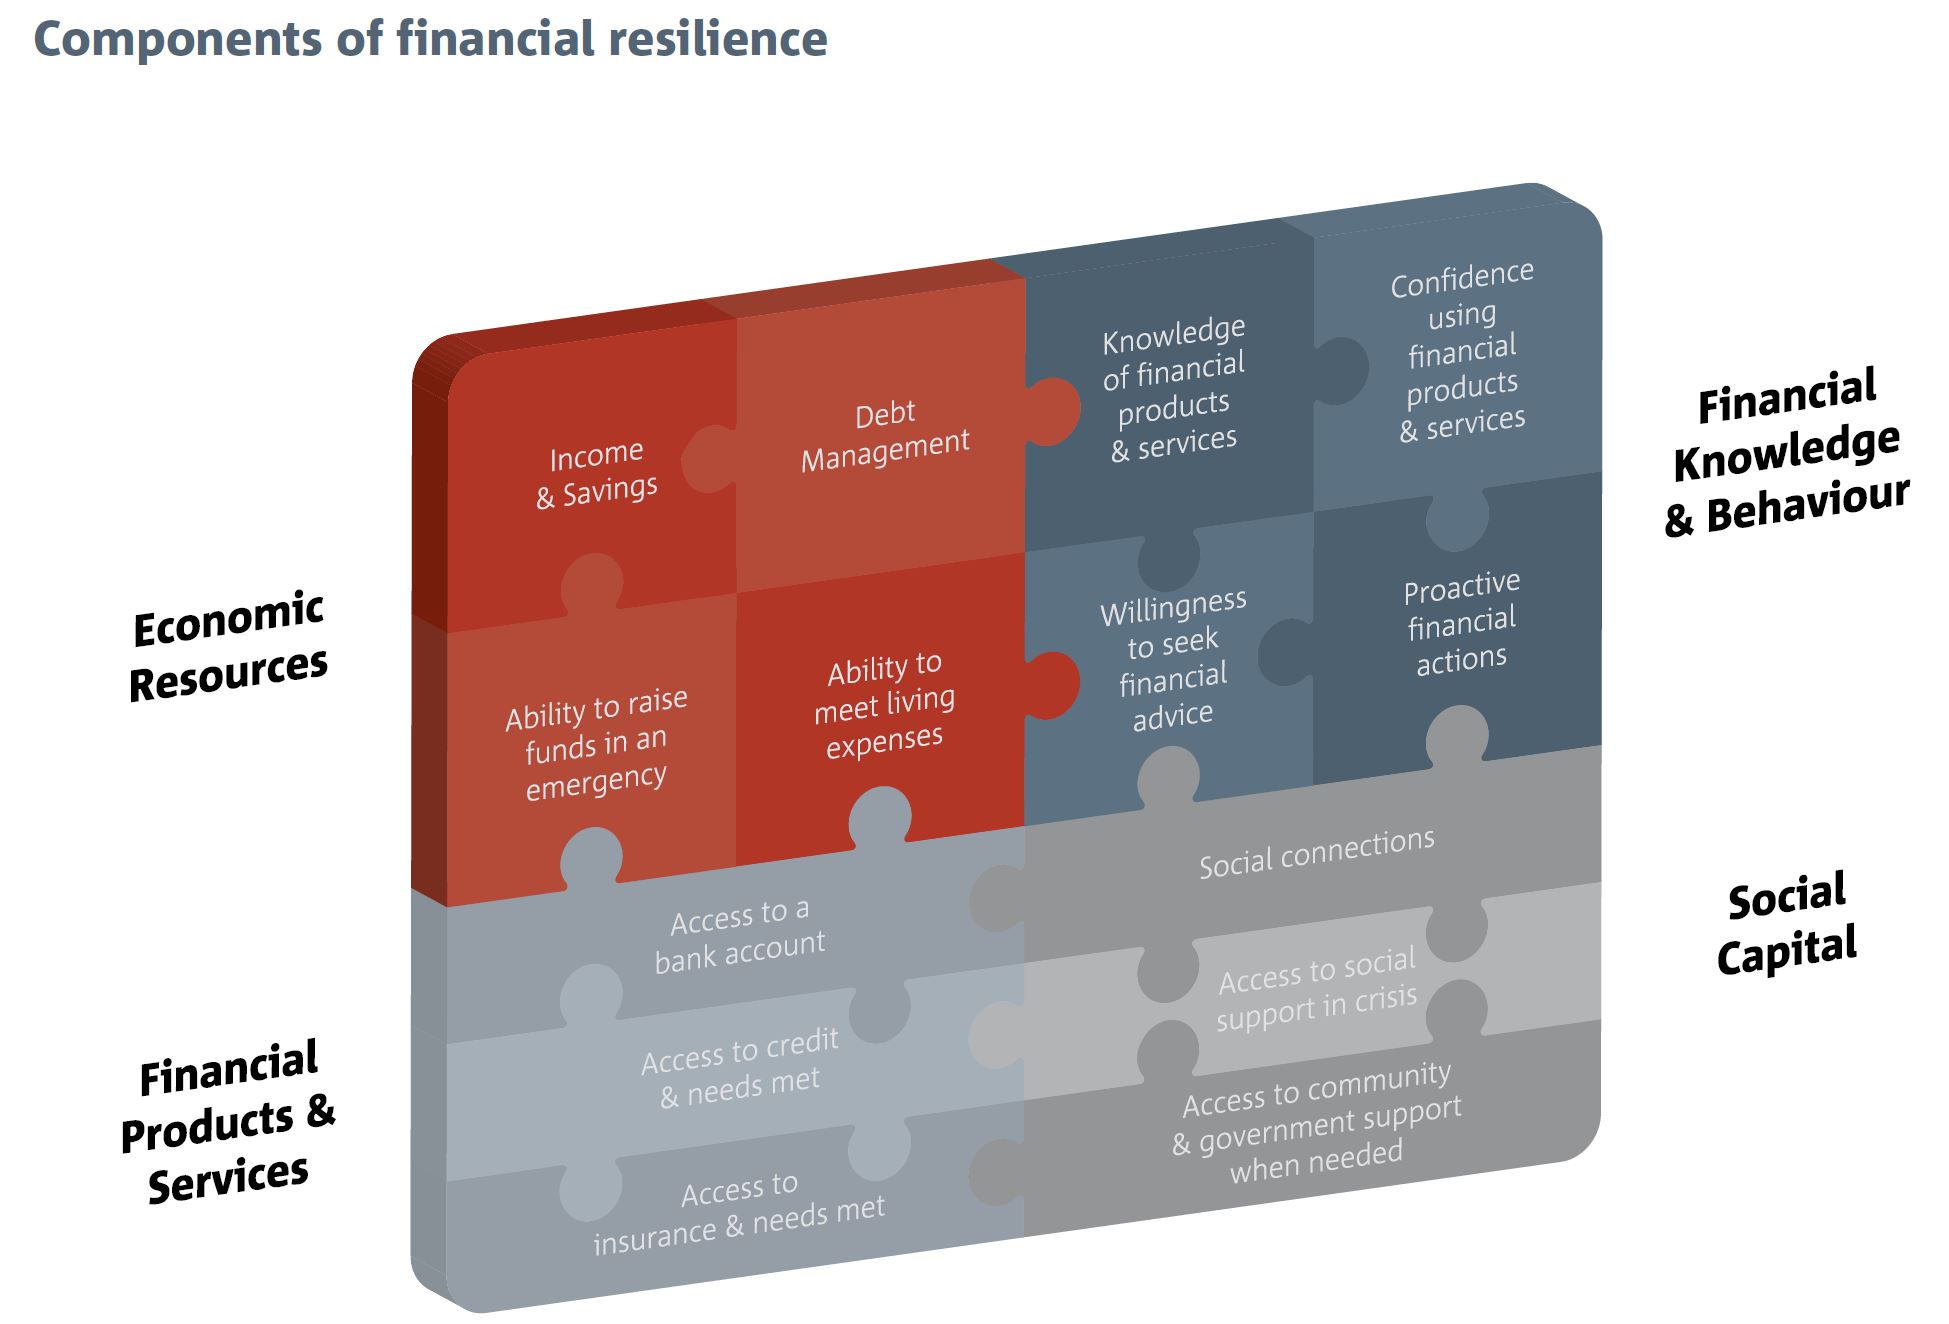
In practical terms financial stress may mean a combination of limited or no savings; difficulties meeting everyday living expenses, managing debts and raising funds in an emergency; no direct access to a bank account; no access to appropriate and affordable credit and/or low levels of social support.

When you dig deeper into the data you see this is not a problem of behaviour or financial literacy. The decline in financial resilience has occurred despite a significant improvement in the proportion of people with moderate to high levels of financial knowledge and behaviour (from 50% to 55%).

This includes a knowledge of, and confidence using, financial products and services. And a willingness to seek financial advice and engage in proactive behaviours like saving, budgeting and paying more than required on debts.

This leads to the conclusion that the cause of the decrease in financial resilience is due to a decline in external resources. This means people having enough money to meet living expenses and manage debts, and having access to a bank account, appropriate credit, insurance and being able to access social and community supports when needed.

We can see this by looking at data on savings.

More Australians are saving (up to 60.2% in 2016 from 56.4%). However, as you can see in the chart below, the total amount of savings has declined. Only one in two people had three months or more of income saved (a drop from 51.9% in 2015 to 49.5% in 2016). And people with savings of a month or less increased from 27.3% to 31.6%.

More Australians are budgeting, too. With 51.6% following a budget in the latest survey as compared to 49.1% in 2015.

The data also shows us that an inability to access appropriate financial products and services affects a large number of Australians. This was mainly driven by increases in the number of people who only had indirect access to a bank account (from 1.2% in 2015 to 2.7% in 2016) and increases in the number of people who had no access to appropriate credit (20.2% in 2015 compared to 25.6% in 2016).

Appropriate and affordable credit is important to assist people who cannot draw on savings when they experience financial shocks, such as the sudden need to replace a washing machine or fridge, or to fix a car needed to get to work.

As we can see, stories of economic growth and declining income inequality aren’t capturing the whole picture. It is important that we don’t overlook the large number of people and households in Australia who are experiencing high levels of financial stress, who are struggling to pay the bills and meet basic living expenses.

Our research shows that large numbers of people and households are not prepared, or adequately supported, should a financial shock (such as an increase in interest rates or a recession) materialise.

While most people have strong social support; more appropriate, affordable and accessible financial support from the government, communities and financial institutions is required. This is along with appropriate mechanisms to help identify people most at risk and to cross refer where required.

Authors: Kristy Muir, Professor of Social Policy / Research Director, Centre for Social Impact, UNSW; Axelle Marjolin, Researcher at the Centre for Social Impact, UNSW


APRA Says Some Competition Good; Too Much Bad

APRA has published their submission to the Productivity Commission review into Competition in the Australian Financial System.

Their submission focuses on APRA’s role in the financial system, potential indicators of competitive dynamics within the industries APRA supervises and its approach to balancing the objectives of financial safety and stability with considerations of competition and competitive neutrality.

A strong prudential framework contributes to strong financial entities and these, in turn, help create robust competitors and intermediaries that are able to support economic growth and activity, throughout the economic cycle.

Most industry sectors regulated by APRA display relatively high levels of concentration, with a small number of large entities holding a significant combined share of the market. However, industry concentration may not, of itself, be a comprehensive measure of the level of competition in individual markets for financial services products. There appear to be strong indicators of competition in certain financial services product markets, for example residential mortgages.

APRA recognises that its objectives are interlinked, with a strong and stable financial system delivering significant efficiency benefits and the promotion of a competitive financial sector. The efficiency and competition benefits of a stable financial system are not limited to the financial sector but extend to the broader Australian economy.

APRA is of the view that, with the right balance, stability and competition are mutually reinforcing objectives. However, competition can also lead to instability in the financial system and there are times where it is important for APRA to actively temper competitive forces. Periods of excessive and unsustainable competition can result in financial institutions inappropriately pricing risk or unintentionally accepting excessive risk in order to gain or retain market share.

Turning to their specific observations on the banks, they say there has been no material growth in the combined market share of the major banks over recent years. The share of the four major banks as at end-June 2017 was 75.2 per cent, compared with 75.8 per cent as at end-June 2016. Five years ago, the corresponding figure was 74.5 per cent.

Return on equity (ROE) for the banking industry for the twelve months to 30 June 2017 was 11.7 per cent. This remains below the ten-year average of 13.4 per cent (which itself has declined in recent years) and is primarily driven by net interest margins, which continue to be challenged by the low interest rate environment. Margin pressure has eased following recent mortgage repricing actions (particularly on investor and interest only products); however, rising funding costs and slowing credit growth may offset much of the benefit afforded by upwards repricing. All else being equal, increasing regulatory capital expectations will also likely negatively impact industry ROE.

Since the global financial crisis there has been a significant convergence in ADI net interest margins. The net interest margins of other Australian banks (including the large regional banks) as shown in Figure 5 have increased over the past ten years, from 0.8 per cent at June 2008 to 1.6 per cent at June 2017, partly driven by wholesale funding being replaced with cheaper funding as volatility in funding markets has eased. Conversely, the net interest margins of other mutual ADIs have been compressed over the same period, falling from 3.2 per cent at June 2008 to 2.3 per cent at June 2017, driven by a combination of pricing competition in both lending and retail deposit markets

Expense management and efficiency continue to be a focus as both large and small ADIs seek to become more competitive and profitable. Cost to income ratios for the majority of ADIs continue to trend downward. The cost to income ratios of large banks compare favourably to those of peers in foreign jurisdictions.

Large banks are likely to have a strong competitive and information advantage in supplying lending products to these businesses through their ability to cross sell or bundle other banking products, particularly payment systems/merchant terminals and transaction accounts. For many smaller ADIs, offering finance to small and medium enterprises would potentially result in the ADI operating outside tolerance levels established by their own risk appetite. However, as an alternative to accessing funding from the larger banks, small businesses may also access trade credit or asset/equipment finance from specialist companies that are not regulated by APRA to fund their establishment or expansion.

Four observations. First, they should have compared returns and NIM on an international basis. Australian banks are super profitable relative to players in many other countries thanks to weaker competition and the market moving rates together (see the recent mortgage repricing).

Second, we may have better cost income ratios here, but that has more to do with income from superior profits than core efficiency. The cost-income metrics are meaningless in isolation.

Third, the current regulatory and competitive settings still create a significantly tilted playing field in favour of the big four, and the barriers to new entrants are too high.

Fourth, we have strong vertical and cross product integrated (e.g. wealth management, retail banking); financial advice, mortgage brokers, as well as product manufacturing.  This tight integration allows players to control prices and margins. This is a structural problem, which no-one wants to address.

We think APRA have traded off competition in favour of financial stability, which is their primary concern. But as a result consumers and small business customers are paying more than they should for financial service products, which is effectively a tax on all Australians.

The ANZ has upped its national housing price forecasts

From Business Insider Australia.

ANZ Bank analysts have increased their forecasts for property price growth in Australia.

“Given Melbourne’s recent resilience, we have nudged our 2017 price forecasts higher, and now expect nationwide prices will finish the year 5.8% higher,” write economists Daniel Gradwell and Joanne Masters.

However, they see further evidence that the housing market is cooling.

“Weaker auction results point toward slow price growth through the rest of 2017, while tighter borrowing conditions and higher interest rates for investors are also likely to weigh on price growth in 2018,” they say.

At the national level, dwelling price growth has slowed over the past three months.

Prices are now 9.7% higher than a year ago, down from the peak of 11.4% in May.

Here are the ANZ’s forecasts:

Source: ANZ Bank

“Much of this slowdown appears to be caused by a retreating investor presence in the market, in line with recent regulatory changes,” they say.

APRA’s further crackdown aimed at investor borrowing, particularly those with interest-only loans, has seen the investor share of total borrowing steadily decline.

“In turn, price growth has slowed across most capital cities and regional areas and across detached houses and the unit/apartment market,” say Gradwell and Masters.

“Having said that, the Melbourne market has recently been more resilient than the Sydney market, perhaps reflecting an element of catch-up after Sydney outperformed in previous years.”

The economists note there is no suggestion that prices will fall outright only that price growth will slow.

“Melbourne and Sydney will continue to be the main drivers of this growth, in line with their expanding populations,” they write.

“Strong additions to supply are expected to keep a lid on Brisbane’s prices, while Perth and Darwin are likely to have another year of weakness, as their mining boom adjustment winds up.”

More Evidence Of Households In Financial Stress

A new report released today by the Centre for Social Impact, in partnership with NAB explores the complex reasons why many Australians are facing increasing financial stress. Financial Resilience in Australia 2016 builds on the 2015 report to show that while people are more financially aware, savings are shrinking and economic vulnerability is on the rise.

The overall level of financial resilience in Australia decreased between 2015 to 2016. In 2016, 2.4 million adults were financially vulnerable and there was a significant decrease in the proportion who were financially secure (35.7% to 31.2%).

Looking at the components of financial resilience, between 2015 and 2016: the mean level of economic resources did not significantly change and, in good news, people’s levels of financial knowledge and behaviour significantly increased.

However, people’s levels of access to external resources – financial products and services and social capital – significantly decreased and while savings behaviours were up, the amount of savings people have to rely upon has gone down.

Economic resources: stayed the same overall but there are concerns about savings markers.

  • On average, adults in Australia were better able to access funds in an emergency in 2016 (77.6% in 2015 to 81.4% in 2016). But almost 1 in 5 still could not, or did not know if they could raise $2,000 in a week and this rate was worse than findings by the ABS in 2014 (when approximately 1 in 8 were not able to find money in an emergency).
  • Of those who reported they could raise $2,000 in an emergency, 70.7% would do so through family or friends demonstrating the importance of social capital.
  • While more people were saving in 2016 compared to 2015, less money was being saved relative to people’s income. Almost one in three (31.6%) adults had no savings or were just two pay packets (<1 month of savings) away from serious financial stress if they were to lose their jobs. Like in 2015, almost 1 in 2 reported having less than three months of income saved (46.6 and 45.5% respectively).

Financial products and services: access has gotten worse

  • People were more likely to report having no access to any form of credit in 2016 (25.6%) compared to 2015 (20.2%) and no form of insurance (11.8% in 2016 compared to 8.7% in 2015).
  • A higher proportion of people reported having access to credit through fringe providers in 2016 (5.4%) compared to 2015 (1.7%).
  • There were no differences in the reported level of unmet need for credit overall, between 2015 (3.8%) and 2016 (3.7%). However, 1 in 10 reported having an unmet need for more insurance (10.0% compared to 9.7% in 2015) and an additional 11.6% (compared to 6.4% in 2015) did not know if they needed more insurance.

Financial knowledge and behaviour: has improved

  • Adults in Australia reported having a higher level of both understanding of and confidence using financial products and services in 2016 than in 2015. In 2016, 5.5% reported having no confidence using financial products and services and 4.5% reported no understanding at all, compared to 8.2% and 9.2% respectively in 2015.
  • There was a positive change in the population’s reported approach to seeking financial advice, with more people reported seeking advice at the time of the survey (7.8% in 2016 compared to 4.8% in 2015).
  • More people reported saving regularly in 2016 (60.2%) compared to 2015 (56.4%).

Social capital: has decreased

  • Although social capital overall decreased between 2015 and 2016, more people reported having regular contact with their social connections (68% compared to 36.6%).
  • A lower proportion of the population reported needing community or government support in 2016.
  • However, the proportion of people reporting a need for support but no access to it grew from 3.2% in 2015 to 5.3% in 2016.

Who is doing better? Who is faring worse?

  • Income, educational attainment and employment were all positively associated with financial security
  • Established home owners were also more likely to be financially secure, while people living in very short-term rentals were more likely to be in severe financial stress.
  • Younger people under 35 years of age were less likely than other age groups to experience financial security.
  • A higher proportion of people born in a non-English speaking country were in the severe and high financial stress categories, than people born in an English-speaking country, including Australia.
  • Mental illness was also negatively correlated to financial security, with a higher proportion of people with a mental illness experiencing severe or high financial stress (44.7% compared to 9.3% of people with no mental illness).

The Centre for Social Impact (CSI) is a national research and education centre dedicated to catalysing social change for a better world. CSI is built on the foundation of three of Australia’s leading universities: UNSW Sydney, The University of Western Australia, and Swinburne University of Technology.

Treasury Releases Affordable Housing Measures

As part of the 2017-18 Budget, the Government announced it would be providing tax incentives to increase private and institutional investment in affordable housing. They have now released an exposure draft for comment.

The legislation proposes an additional 10% Capital Gains Tax (CGT) benefit for investors who provide affordable housing via a recognised community housing entity.

It also allows investment for affordable housing to be made via Managed Investment Trusts (MIT).

The purpose of public consultation is to seek stakeholder views on the exposure draft legislation and explanatory material. Deadline for submissions is 28th September.

Changes To CGT.

The Bill encourages investment in affordable housing for members of the community earning low to moderate incomes. This is achieved by allowing investors to have an additional affordable housing capital gains discount of up to 10 percent at the time a CGT event occurs to an ownership interest in a dwelling that is residential premises that has been used to provide affordable housing. By reducing the CGT that is payable upon disposal of affordable housing, it ensures that a greater proportion of the gain realised at disposal is retained by the investor.

The additional capital gains discount applies to investments by individuals directly in affordable housing or investments in affordable housing by individuals through trusts (other than public unit trusts and superannuation funds), including MITs to the extent the distribution or attribution is to the individual and includes such a capital gain.

An individual is eligible for an additional affordable housing capital gains discount (direct investment) on a capital gain if they:

  • make a discount capital gain from a CGT event happening in relation to a CGT asset that is their ownership interest in a dwelling; and
  • used the dwelling to provide affordable housing for at least three years (1095 days) which may be aggregate usage over different periods.

Only dwellings that are residential premises that are not commercial residential premises can be used to provide affordable housing. Therefore this measure does not apply to caravans, mobile homes and houseboats as they are not residential premises.

The tenancy of the  dwelling or its availability for rent to be exclusively managed by an eligible community housing provider. Community housing providers provide rental housing to tenants who are members of the community earning low to moderate incomes. Community housing providers may own some of the dwellings, however they also manage dwellings on behalf of investors, institutions and state and territory governments. Many community housing providers specialise in providing accommodation to particular client groups which may include disability housing, aged tenants and youth housing. Community housing providers are regulated by the states and territories. For the purposes of this measure an eligible community housing provider is an entity that is registered as a community housing provider to provide community housing services under a law of the Commonwealth, state or territory or is registered by an Australian.

Affordable housing through managed investment trusts.

The proposals will amend taxation laws to encourage managed investment trusts (MITs) to invest in affordable housing. They:

  • allow MITs to invest in dwellings that are residential premises (but not commercial residential premises) that are used to provide affordable housing primarily for the purpose of deriving rent; and
  • apply the concessional 15 per cent withholding tax rate to fund payments: – to the extent they consist of affordable housing rental income and certain capital gains from dwelling used to provide affordable housing; and – that are paid or attributed to MIT members who are foreign residents of jurisdictions which Australia has listed as an exchange of information country.

A MIT is a type of unit trust which investors can use to collectively invest in assets that produce passive income, such as shares, property or fixed interest assets. There also currently is significant uncertainty about the eligibility rules for trusts being MITs if investments are made in dwellings that are residential premises. This is because there is a view that investment in residential property is not made for a primary purpose of earning rental income. It is instead for delivering capital gains from increased property values, and therefore not eligible for the MIT tax concessions.

This measure clarifies the eligibility rules for trusts to be MITs if they invest in dwellings that are residential premises. This will help to provide investors with investment certainty. This change will not, however, affect MITs investing in commercial  residential premises. This means that trusts can invest in commercial residential premises and qualify as MITs provided this investment is primarily for the purpose of deriving rent consistent with the eligible investment business rules.


ME Bank Performing Well On The Back OF Strong Mortgage Growth

Industry super fund-owned bank ME has reported a full year underlying net profit after tax of $85.2 million, up 14% on the previous Financial Year.

ME CEO, Jamie McPhee, said “it was another strong performance and continued ME’s strong profit growth over the past five years”.

McPhee said NPAT growth largely reflected a 12% increase in ME’s home loan portfolio, with net interest margin falling 5 basis points to 1.50% and total expense growth of 3%. ME’s NPAT has grown at an annual compound rate of 28% since 30 June 2012.

We plotted the portfolio value of ME’s mortgage book using APRA data, relative to market growth, and owner occupied loans in particular are growing fast.

The relative percentage growth highlights the trends even more strongly.

“Growth has been the main story for ME in FY17 with home loan settlements up 36% to $6.2 billion, an increase in total assets of 7% to over $26.5 billion, customer deposits up 20% to $12.6 billion, and customer numbers up 15% to 420,000.”

McPhee said “the Bank’s performance is particularly positive in light of the external operating environment – softening credit growth, macro-prudential restrictions on home lending, regulatory imbalances that give the major banks a competitive advantage, and a banking industry ratings downgrade by S&P in May.”

Underlying return on equity increased 10 basis points to 8.3% continuing the trend towards the medium-term target of 10%, while the cost to income ratio reduced further from 65.8% to 63.5%.

ME’s statutory profit after tax, which includes the amortisation of realised losses on hedging instruments ($7.3 million), loss on sale of the business banking portfolio ($6.2 million), transition costs associated with a significant new technology partnership with Capgemini ($6.4 million) and legacy IT decommissioning costs ($3.4 million), was $61.9 million (FY16: $76.8 million).

ME’s commercial partnerships with its industry fund owners continue to bear fruit: ME’s member benefits program, which it uses to market directly to members of industry super funds and unions, is now generating 13% of the Bank’s home loan settlements.

ME’s brand overhaul in FY16 is supporting growth with awareness hitting a record high 55% in July 2017, up 15 points since the change was implemented.

The annual review has yet to be posted and the available financial performance information is very limited.

ASIC questions legality of bank rate hikes

From The Adviser.

The corporate watchdog told a parliamentary hearing this week that the big banks could be in breach of the ASIC Act over the reasons given for hiking interest rates.

ASIC appeared before the House of Representatives Standing Committee on Economics yesterday (14 September) where chairman Greg Medcraft provided no opening remarks and instead launched straight into the inquiry.

Chairing the committee was David Coleman MP, who kicked off the questioning by raising the issue of recent rate hikes by the banks. He noted that some banks, in their public justifications for the out-of-cycle rate hikes, have named the regulatory impact but did not name any other factors.

Mr Coleman questioned if the interest rate increases were larger than could sensibly be justified by the regulatory impact.

He then asked ASIC chairman Greg Medcraft: “Would that concern you?”

“Yes, it would. I think what you are really saying is, are they profiteering on the announcement?” Mr Medcraft replied, before passing to ASIC deputy chair Peter Kell to elaborate.

“Yes, it certainly would concern us,” Mr Kell said. “It would go in effect to, I suppose, whether the public justification or explanation for the interest rate rise was actually inaccurate and perhaps false and misleading, and therefore perhaps in breach of the ASIC Act.”

The deputy chairman explained that ASIC is currently “looking at this issue” and will be working with the ACCC, which has been given a specific brief by Treasury to investigate the factors that have contributed to the recent interest rate setting.

“It is an issue we are concerned about,” Mr Kell said. “We will have to look at any particular statement carefully. I would also ask if the committee has any particular statements they have concerns about?”

CBA blames regulator for rate hikes

David Coleman MP took the opportunity to read from a 27 June press release issued by the Commonwealth Bank of Australia (CBA) which informed the market of home loan pricing changes. It stated: “To meet our regulatory requirements, variable interest-only home rates for owner-occupiers and investors will increase by 30 basis points.”

Mr Coleman said that there was “no wiggle room” in CBA’s statement, which made clear that regulatory requirements were the sole reason for the rate hike.

“CBA has very clearly put on the record that it is to meet the regulatory requirement,” he said.

“It is notable in this context that analysts who have looked at these rate rises have concluded that the rate rises will increase the profitability of the banks. Presumably, this is not the role of a regulatory change.”

Mr Coleman said that it is important that the industry is aware and that bank executives are aware that “the ACCC has powers to interrogate these matters very carefully”.

Back book repricing under scrutiny

APRA was grilled by the parliamentary inquiry earlier in the week, where Mr Coleman questioned whether CBA’s and other lenders’ back book IO repricing practices were “actually opportunistic changes” that had effectively used the APRA speed limits as excuses to garner profit.

He called on APRA chairman Wayne Byres to clarify whether lenders had put out “misleading” statements by using the APRA crackdown as reasoning for back book repricing.

Deflecting the question, Mr Byres said that APRA would wait to see what came out of inquiries by the ACCC and ASIC. He noted that ASIC would have “great interest” in the matter.

Where the accountability problems started at CBA

From The Conversation.

The heads or deputy heads of the three main banking regulators (the Australian Prudential Regulatory Authority, the Australian Securities and Investments Commission and the Reserve Bank of Australia) spoke at the annual regulators’ lunch last week. Guy Debelle, who is relatively new to his role as deputy governor at the RBA, summarised the feelings of the regulators at the lunch in regards to the public’s lack of trust in banks:

No one feels that anything particularly has changed, because even if the issue occurred a few years ago, it still generates the headlines today, and just reinforces the belief [that the banks cannot be trusted].

Unfortunately that’s because these problems were never actually resolved at the time, with regulators being palmed off with internal inquiries, until the scandal went off the front page. Of course the problems that have occurred recently at banks, especially CBA, are going to be dredged up again and again, because customers (unlike regulators) really suffered and no one was ever held to account.

On the same day, APRA chairman Wayne Byers also announced the makeup of the inquiry panel to which it has outsourced its job. The agency also released the terms of reference that will govern the conduct of the inquiry over the next six months.

Way way down the list of things to do is assessing the CBA’s “accountability framework” and whether it conflicts with “sound risk management and compliance outcomes”.

Note the terms of reference do not discuss “accountability”, per se, merely whether the framework (i.e. organisation charts and policies) is effective or not. Instead, the terms of reference discuss whether it conflicts with other policies and organisation charts. It is Olympic standard navel gazing, rather than action on the part of APRA, and a very minor part of the panel’s work.

But, accountability is not only about “what” but about the “who” and, as the French philosopher Molière wrote, “it is not only what we do, but also what we do not do, for which we are accountable”.

Inquiry panel member, John Laker, is also chairman of the Banking Finance Oath initiative, which works to promote “moral and ethical standards in the banking and finance profession”. He will be well placed then to remind CBA directors and managers of one of the key tenets of that oath:

I will accept responsibility for my actions [and] in these and all other matters; My word is my bond.

Responsibility and accountability are personal not commercial constructs and, notwithstanding the latest knee-jerk reaction to the money laundering scandal, these values have been in very short supply in CBA, over the last decade.

In fact, while there have been belated apologies for some of the scandals, no one in a senior position at CBA has actually taken personal accountability for any of the sequence of scandals that have recently beset the bank.

A detailed description of the many failures of accountability at CBA would take many thousands of words, but one scandal stands out above all others, not least because it involved the largest fine ever visited on CBA’s long-suffering shareholders. It set the scene for how the CBA board would handle future scandals, that is to obfuscate, prevaricate and litigate.

On December 23, 2009, the CBA board announced a payment of some NZ$264 million to one of New Zealand’s public service departments, New Zealand Inland Revenue.

The NZ High Court found that CBA had been using ASB Bank, its NZ subsidiary, as a laundromat through which it washed a number of dodgy transactions each year with the purpose of avoiding NZ taxes, which fed directly into CBA group profits. It was tax avoidance on an industrial scale.

It should be noted that three other major banks were also fined in a total settlement of NZ$2.2 billion (about A$1.7 billion at the time), the largest fines ever paid by Australian banks.

The banks had fought the NZ Commissioner of Inland Revenue for several years all the way to the High Court, until Justice Harrison ruled the transactions were “tax avoidance arrangement(s) entered into for a purpose of avoiding tax”.

Why such a small number of transactions? Because they were huge Interest Rate Swaps (IRS) transactions, created at the highest levels of the organisations with the purpose of turning expenses into income, a clever idea that some tax accountant had dreamed up around 1995.

During the extensive and expensive litigation, the CBA board kept maintaining that they had rock solid advice that their actions were legally watertight. But they were very wrong.

So, did anyone take responsibility for this embarrassing, unethical and expensive failure of management and corporate governance?

No board member or senior manager ever took responsibility for being found to have tried to avoid huge amounts of tax in one of the bank’s key markets. In fact the opposite, Sir Ralph Norris, who had been CEO of ASB during the wash and spin cycle, was made CEO of the CBA group in 2005.

What message does such disgraceful and ultimately unproductive behaviour send to staff?

First it says, don’t take responsibility for anything, bluff and dissemble and, if found out, never ever admit to anything. If board members refuse to be accountable for their mistakes, why should anyone else, especially if whistleblowers are treated appallingly?

And the NZ scandal was only the first of many scandals.

While CEO, Ian Narev, has expressed “disappointment” at customers being treated shabbily, no senior leader has been held directly accountable for the financial planning scandal, the CommInsure scandal, the manipulation of BBSW and Foreign Exchange benchmarks, and now the money laundering action being taken by AUSTRAC.

Making belated apologies is not taking responsibility for misconduct unless corrective actions follow. But, in CBA the scandals keep coming, as the apologies appear to have changed nothing in the organisation.

Surely someone, somewhere in the huge CBA organisation has the ethical grounding to stand up and say – “yes, we did make mistakes and, yes, we should bear the consequences, and to start the ball rolling, I resign”. Actions speak much louder than mere words.

The APRA inquiry will undoubtedly find that the bank’s “accountability framework” was deficient but unless names are revealed, its conclusions will be suspect.

However, it is not up to the panel to name and shame, but to convince the senior management of CBA that only true accountability will restore trust in the bank and that someone has to step up and take responsibility for their actions and inaction, otherwise staff will never know the right thing to do.

The CBA inquiry panel is due to hand down an interim report by December but by then we should know if the inquiry has any teeth by any admissions of accountability coming from the CBA board and management. But don’t hold your breath!

Author: Pat McConnell, Honorary Fellow, Macquarie University Applied Finance Centre, Macquarie University

S&P 500 Reaches New Heights (Again)

The US index has reached another high and a 5-year view highlights the strong growth, and momentum since Trump won the election last year.

So, what are the expectations ahead? Well, according to a piece from Moody’s:

An overvalued equity market and an extraordinarily low VIX index offer no assurance of impending doom for US equities. Provided that interest rates do not rocket higher, expectations of corporate earnings growth should be sufficient for the purpose of avoiding a severe equity market correction that would doubtless include the return of corporate bond yield spreads in excess of 700 bp for high yield and above 200 bp for Ba a-rated issues.

For now, the good news is that early September’s Blue Chip consensus expects core profits, or pretax profits from current production, to grow by 4.4% in 2017 and by 4.5% in 2018. Moreover, earnings-sensitive securities should be able to shoulder the 2.5% 10-year Treasury yield projected for 2017’s final quarter. However, the realization of a projected Q4-2018 average of 3.0% for the 10-year Treasury yield could materially reduce US share prices.

Since 1982, there have been seven episodes when the month-long average of the market value of US common stock sank by at least -10% from its then record high. Only two of the seven were not accompanied by at least a -5% drop by core profits’ moving yearlong average from its then record high.

In conclusion, the rich valuation of today’s US equity market very much warns of at least a -10% drop in the market value of US common stock in response to either unexpectedly high interest rates or a contraction of profits. Perhaps, the prudent investor should be braced for at least a -20% plunge in the value of a well-diversified portfolio at some point during the next 18 months.

RBA Makes A Loss; Reduces Distribution

The RBA published their Annual Report for 2017.  They reported an accounting loss of $897 million, or 0.5 per cent of the balance sheet, in 2016/17. The Bank’s underlying earnings were offset by net valuation losses of $1 857 million. The Treasurer, after consulting the Board, determined that all earnings available for distribution in 2016/17, a sum of $1 286 million, would be paid as a dividend to the Commonwealth.

The Reserve Bank of Australia is established by statute as Australia’s central bank. Its enabling legislation is the Reserve Bank Act 1959. The Bank pursues national economic policy objectives. Its responsibility for monetary policy is set out in section 10(2) of the Reserve Bank Act, which states:

It is the duty of the Reserve Bank Board, within the limits of its powers, to ensure that the monetary and banking policy of the Bank is directed to the greatest advantage of the people of Australia and that the powers of the Bank … are exercised in such a manner as, in the opinion of the Reserve Bank Board, will best contribute to: (a) the stability of the currency of Australia; (b) the maintenance of full employment inAustralia; and(c) the economic prosperity and welfare of the people of Australia.

Policies in pursuit of these objectives have found practical expression in a flexible, medium-term inflation target, which has formed the basis ofAustralia’s monetary policy framework since the early 1990s. The policy objective is for consumer price inflation to average between 2 and 3 per cent over time.

Australia’s financial stability policy framework includes mandates for financial stability for both APRA and the Reserve Bank. APRA is responsible for prudential supervision of financial institutions and the Bank is responsible for promoting overall financial system stability. In the event of a financial system disturbance the Bank and relevant agencies would work to mitigate the risk of systemic consequences. The Bank’s responsibility to promote financial stability does not, however, equate to a guarantee of solvency for financial institutions and the Bank does not see its balance sheet as being available to support insolvent institutions. Nevertheless, the Bank’s central position in the financial system – and its position as the ultimate provider of liquidity to the system – gives it a key role in financial crisis management, in conjunction with the other members of the Council of Financial Regulators (CFR).

The Reserve Bank holds a range of financial assets to pursue its monetary policy objectives and support an efficient and orderly payments system in Australia. The Reserve Bank’s balance sheet was $194 billion on 30 June 2017, compared with $167 billion a year earlier.

The Reserve Bank’s earnings arise from two sources: underlying earnings – comprising net interest and fee income, less operating costs – and valuation gains or losses. Net interest income arises because the Bank earns interest on almost all of its assets, albeit currently at low rates, while it pays no interest on a large portion of its liabilities, such as banknotes on issue and capital and reserves. Fees paid by authorised deposit-taking institutions associated with the Committed Liquidity Facility also make a significant contribution to underlying earnings.

Valuation gains and losses result from fluctuations in the value of the Reserve Bank’s assets in response to movements in exchange rates or in yields on securities.

In 2016/17, the Reserve Bank’s underlying earnings were $960 million, which was $263 million lower than the previous year because of lower net interest income resulting from a decline in the net interest margin. The reduced interest margin reflected, in part, the decline in short-term interest rates in Australia compared with the previous year. Underlying earnings remained at historically low levels with interest rates around the world also typically remaining low.

The Reserve Bank’s underlying earnings were offset by net valuation losses of $1 857 million, primarily from the appreciation of the Australian dollar during the year. The net valuation loss was composed of an unrealised valuation loss of $2 179 million offset by net realised gains of $322 million, largely as a result of the sale of foreign currency in the normal course of managing the portfolio of foreign reserves; these transactions had no effect on the value of the Australian dollar. The realised gains came from sales of assets on which unrealised gains had been recorded in earlier years, and therefore they acted to deplete the balance of the unrealised profits reserve, as discussed further below.

The net outcome was that the Reserve Bank recorded an accounting loss of $897 million, or 0.5 per cent of the balance sheet, in 2016/17.

Despite the accounting loss in 2016/17, earnings were still available for distribution, as the net unrealised valuation loss of $2 179 million was absorbed by the unrealised profits reserve in accordance with the Reserve Bank Act as explained above. This left earnings available for distribution amounting to $1 286 million in 2016/17, compared with $4 612 million in the previous year, reflecting both lower underlying earnings and smaller realised gains.

The Treasurer, after consulting the Board, determined that all earnings available for distribution in 2016/17, a sum of $1 286 million, would be paid as a dividend to the Commonwealth.