Genworth Under Ratings Agency Scrutiny

Genworth, the listed Lenders Mortgage Insurer updated the ASX yesterday of the results of the outcomes of recent rating agency reviews. The ratings agencies appear somewhat split on how to assess the risks in the sector.

Fitch ratings affirmed the A+ IFSR and maintained the outlook at stable – saying Genworth had a robust standalone credit profile, solid operating performance, strong capital ratios and conservative investment approach. They noted a generally stable operating environment which continues to support the performance of the insurance portfolio.

Standard & Poor’s rating affirmed the A+ IFSR and maintained the outlook at negative noting standalone credit profile, business risk profile and strong capital and earnings position. “Claims paying resources, which include conservatively invested capital, claims reserves and external reinsurance are supportive of the company’s ability to absorb a significant level of claims if Australia were to experience a severe extended economic downturn”.

Moody’s has however revised its unsolicited IFSR on GFM1 from A3 with a negative outlook to Baa1 with stable outlook. This follows Moody’s wider rating action on financial institutions in June 2017 to reflect its view that “risks in the Australian housing market have risen, heightening the financial sector’s sensitivity to adverse shocks”.

So, you “pays your money and takes your choice!”

Trend Full-Time Employment Rate Still At 5.6%

Monthly trend full-time employment increased for the 11th straight month in August 2017, according to figures released by the Australian Bureau of Statistics (ABS) today.

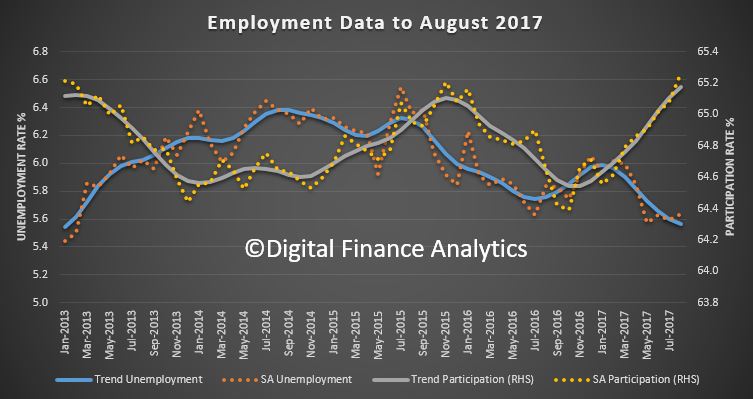
The trend unemployment rate in Australia remained at 5.6 per cent in August 2017, and the labour force participation rate increased to 65.2 per cent, the highest it has been since April 2012.

The quarterly trend underemployment rate remained steady at 8.7 per cent over the quarter to August 2017 from a revised figure for May 2017 quarter.

“The underemployment rate is an important indicator of the spare capacity of workers in Australia, and it has remained at 8.7 per cent, a historical high, for the third consecutive quarter,” the ABS said.

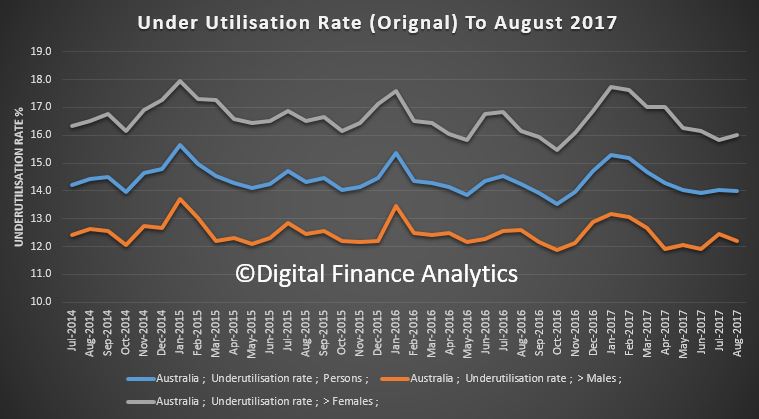
The quarterly trend underutilisation rate, which includes both unemployment and underemployment, decreased by 0.1 percentage points to 14.2 per cent.

Trend series smooth the more volatile seasonally adjusted estimates and provide the best measure of the underlying behaviour of the labour market.

Full-time employment grew by a further 22,000 persons in August, while part-time employment increased by 6,000 persons, underpinning a total increase in employment of 27,000 persons.


“Full-time employment has now increased by around 253,000 persons since August 2016, and makes up the majority of the 307,000 person increase in employment over the period,” Chief Economist for the ABS, Bruce Hockman, said.

Over the past year, trend employment increased by 2.6 per cent, which is above the average year-on-year growth over the past 20 years (1.9 per cent).

The rate of employment growth (2.6 per cent) was greater than the growth in the population aged 15 years and over (1.7 per cent), which was reflected in an increase in the employment to population ratio (which is a measure of how employed the population is). This ratio increased by 0.6 percentage points since August 2016, up to 61.5. This is the highest it has been since February 2013.

Over the past year the three states and territories with the strongest growth in employment were Tasmania (4.0 per cent), Queensland (3.7 per cent) and Victoria (3.2 per cent).

The trend monthly hours worked increased by 3.9 million hours (0.23 per cent) to 1,708.6 million hours in August 2017.

The seasonally adjusted number of persons employed increased by 54,200 in August 2017. The seasonally adjusted unemployment rate remained steady at 5.6 per cent and the labour force participation rate increased to 65.3 per cent.

Rate hikes a result of regulation: APRA

From Australian Broker.

Banks would not have increased their investment and interest-only rates were it not for speed limits imposed by the Australian Prudential Regulation Authority (APRA), the regulator’s chairman Wayne Byres has said.

These statements come from a hearing held by the House of Representatives Standing Committee on Economics around APRA’s 2016 annual report held yesterday (13 September).

Committee chair David Coleman brought up comments by the Commonwealth Bank of Australia (CBA) which alleged that rates hikes were implemented “in line with what our regulators require”.

“Many banks make similar statements and we’ve been blamed for all sorts of things,” Byres said.

While banks have used higher rates to influence customer behaviour, APRA had been “deliberately silent” about the measures which could be used when it implemented these speed limits, he added.

Byres acknowledged that rate hikes were indeed linked to restrictions brought in by APRA.

“Based on what I know… the banks would not have made these interest rate changes if it were not for these regulatory initiatives.”

Coleman remained unsatisfied, pointing out that rate changes affected banks’ existing books despite speed limits only applying to new lending. He asked Byres as to whether these rate increases were a requirement rather than just a response to APRA’s restrictions. At first refusing to give a direct reply, Byres said bank statements linking rate hikes to regulatory measures were “vague and ambiguous”.

Coleman then expanded his question, pressing Byres about a hypothetical in which a bank makes a general move and links this to regulatory requirements despite being wholly unconnected.

“This is not ok,” Byres said.

However, he stressed that APRA was not to blame for any rate hikes, saying “a direct assertion that we made them put up interest rates is clearly not true”.

Global banks turn inwards, says McKinsey

From The Investor Daily.

Financial institutions have embarked on a “broad-based retreat” from cross-border activities in the decade since the global financial crisis, according to management consultancy McKinsey & Co.

Reflecting on the past decade for a McKinsey Global Institute podcast, Washington, DC-based partner Susan Lund said there has been a clear change in behaviour from global banks since the downturn.

“In the 10 years since the global financial crisis began, cross-border capital flows have fallen by 65 per cent, from over $12 trillion to just over $4 trillion in 2016,” Ms Lund said. “Half of that decline is coming from a decline in cross-border lending and other types of banking activity.”

The decline is symptomatic of decisions by bank boardrooms to reduce foreign exposure, the management consultant said, retreating to an inward-looking focus on national interests.

“[Global banks are] selling foreign businesses,” she said. “They’re allowing loans to expire without renewing them, and they’re selling different types of foreign assets. Overall, there’s been a broad-based retreat toward more domestic activity.”

The first key driver of the trend has been the need for some institutions – particularly those adversely affected by the GFC – to “rebuild capital and recoup losses”, minimising risks and costs associated with offshore ventures.

The second has been increasing regulatory requirements post-GFC, which have forced a greater focus on domestic compliance.

Speaking on the same podcast, Frankfurt-based MGI partner Eckart Windhagen said the retreat has been particularly advanced among eurozone banks, many of which were bullish on cross-border activity before 2008.

While Western and European banks have retreated, some Asia-Pacific financial institutions – including those domiciled in China – have been expanding their global reach over the past decade, especially in emerging markets such as economies in Africa and Latin America.

However, despite this trend, only 9 per cent of total assets of Chinese banks are held outside of China, the McKinsey partners clarified.

Asked whether the retreat of global banks from cross-border activity spells “the end of financial globalisation”, Mr Windhagen responded emphatically in the negative.

“Financial globalisation is surprisingly robust,” he said.

“Financial markets remain deeply interconnected, but with a different profile.

“The global value of foreign investment as a percentage of GDP has been steady since 2007, at around 180 per cent, and now stands as an absolute figure at more than $130 trillion.”

In Australia, we have seen ANZ retreat from part of its Asia-Pacific expansion strategy and NAB divest from its UK banking assets.

Income inequality ticks down as the rich see their incomes fall: ABS

From The Conversation.

Income inequality has dropped slightly in Australia, largely driven by a fall in incomes for the richest 20% of the population, according to the latest Australian Bureau of Statistics (ABS) Survey of Household Income and Wealth.

The richest 20% of the population have seen their real disposable incomes (adjusted for the number of people living in the household) fall by nearly 5%, or close to A$100 per week. Most other households have seen no real increase in their incomes over the two years since the previous survey was released.

Our recent public debate over whether inequality is rising or falling ran into the problem that the two most important sources of data were showing different trends. The ABS survey continues to show a higher level of income inequality than the HILDA survey, but the latest trends now look more similar.

Possibly the best characterisation of the latest ABS figures is that they show inequality remains higher than at any period before 2007-08, but in the short term it is unclear what to expect.

As you can see in the following chart, there has been a slight fall in income inequality between 2013-14 and 2015-16, with the Gini coefficient for “Equivalised Disposable Household Income” falling from 0.333 to 0.323. The Gini coefficient is a measure between zero (where all households have the same income) and one (where only one household claims all the income).Equivalised Disposable Household Income is the total income of the household from all sources including social security payments, minus direct taxes, and then adjusted for the number of people living in the household. For example, a household of a couple with two children under the age of 15 is assumed to need 2.1 times the income of a household of a single adult to achieve the same standard of living.

So what explains these most recent trends? At this stage, it’s difficult to be definitive. It should also be borne in mind that it has only been two years since the last survey, the overall change is not large, and so we should be cautious in unpacking the trends.

But it is worth noting that this small reduction in income inequality has come at the same time as a small fall in both median and mean disposable incomes for Australian households.

The average taxes paid by households have also risen slightly in real terms (adjusted for inflation) since 2013-14, while the average social security benefits have stayed the same in real terms. This masks a significant drop in the real level of family payments (such as the family tax benefit) received by households, and increases in age pensions and “other payments” (overseas pensions and benefits, partner allowance, sickness allowance, special benefit, war widow pension (DVA), widow allowance, and wife pensions etc.).

However, where there does appear to be large changes are in the sources of income for households. If we compare incomes between the 2013-14 and 2015-16 surveys, we find that the only group that has enjoyed real increases in incomes are those whose main source of income is social security benefits. But these have risen by only A$6 per week, or about 1.3%, and they remain by far the lowest income households in Australia, with their average incomes remaining less than half of all other household groups.

Households who mainly rely on wages and salaries have seen their average real disposable incomes fall by about A$17 per week, or about 1.4%.

The biggest declines are among those who mainly rely on self-employment income from unincorporated businesses – usually a small business which has not incorporated as a registered company – and people whose main source of income is “other”.

“Other” includes many things, such as income received as a result of ownership of financial assets (interest, dividends), and of non-financial assets (rent, royalties), as well as from sources such as incorporated business income (i.e. companies), superannuation, child support, workers’ compensation and scholarships.

This group is fairly small – about 8% of households, but they are both the group with the highest and most unequal incomes and by far the highest level of net worth (assets minus liabilities). Their average incomes have fallen by around A$93 a week in real terms, or around 8%, but their median real incomes rose by around A$11 per week, suggesting that the loss in income was concentrated among higher income households in this group.

This group in 2013-14 had by far the highest level of income inequality with a Gini coefficient of 0.474. This has fallen to 0.423 in 2015-16. But because a lot of this income comes from the stockmarket, we can expect it to be more volatile.

The group who appear to have lost by far the most, however, are households whose main source of income is unincorporated business income. This is an even smaller group – around 4.6% of all households in 2015-16. Their real average incomes have fallen by more than A$160 per week, or around 16%. They also have a high level of inequality within their group, with a Gini coefficient of 0.353 in 2015-16, down from 0.389 two years previously.

But the overall change in income inequality is not large, and it does not significantly change Australia’s international ranking.

Writing in the Australian yesterday, Nick Cater of the Menzies Research Centre asserted that Australia is “one of the most equal and socially mobile nations on earth”. But even with the slight reduction in inequality, we are slightly above the OECD average, and there are around 20 OECD countries who are likely to have lower levels of income inequality than Australia.

Overall, the data shows a relatively small change in incomes for employee households and for households whose main source of income is social security payments. Together, these account for 87% of all households in Australia.

The reduction in overall income inequality in this period is therefore explained by the falls in income for the self-employed and for the “other” group – the group with the highest incomes and wealth.

Understanding what exactly has been happening for these groups and why will require further time and analysis. The volatility of the income sources for these groups is another reason to be cautious about projecting future trends.

Author: Peter Whiteford, Professor, Crawford School of Public Policy, Australian National University

Banking sector will be ground zero for job losses from AI and robotics

From The Conversation.

Deutsche Bank CEO John Cryan has predicted a bonfire of industry jobs as automation takes hold across the finance sector. Every signal is that he will be proved right very soon.

Those roles in finance where the knowledge required is systematic will soon disappear. And it will happen irrespective of how high a level, how highly trained or how experienced the human equivalent may currently be. Regular and repetitive tasks at all levels of an organisation already do not need to be done by humans. The more a job is solely or largely composed of these routines the higher the risk of being replaced by computing power.

The warning signs have been out there for a number of years as enthusiastic reports about artificial intelligence have been tempered with fears about significant job losses in most sectors of the economy.

Many roles have already all but disappeared in the march towards a fully digital economy. Older readers may recall typesetters, typists, and increasingly, switchboard operators and back room postal workers, as work of the last century. And the changing nature of work is relentless.

Cryan shame? Deutsche Bank’s CEO. EPA/ARMANDO BABANI

Banking on jobs

The finance sector was once driven by human judgement and decision making. But slowly, it has changed. One-to-one conversations with your local bank manager were replaced by scripted call centre interactions during the 1990s. Today, increased processing power, massive cloud storage, strong encryption and an increase in the use of blockchain make possible tasks that had previously been seen as too complex for automation to be done quickly and consistently without any human intervention.

Artificial intelligence reduces the need for human work that requires analysis, consistent applications of decisions and judgement calls. These are pivotal actions for many legal and financial activities. Combined, in the background, with blockchain – essentially a publicly shared automated ledger of agreed contracts – arrangements that require some form of trust between two parties will also be able to be completed with little or no human intervention.

Blockchain is the basis of every cryptocurrency – forms of money exchanged online. Banks are slowly working towards ways of embracing these alternative systems. While alternative forms of money attract popular headlines it is the automation behind the scenes that is most compelling aspect for the finance sector. By removing the influence of human decision making from as many processes as possible, a fully digital supply chain can be created. As artificial intelligence learns more about the impact and influence of every process each time it happens, a bank’s efficiency should continuously improve, and profits increase, with fewer and fewer employees.

Protected

In this atmosphere of change to the world of work in banking, however, there are some roles that will prove more resistant to change. Work that is unpredictable or inherently people-focused will survive. Customer service staff will still need to tackle the inevitably complex queries that are the product of the human mind rather than the outcome of algorithms. AI will deal with most enquiries, but will inevitably need to transfer the most cryptic to a human interlocutor. Mortgage decisions, for example, will come as an automatically generated message; more intricate questions will still require face-to-face conversations.

At the other end of the (pay) scale senior executives will continue to steer the direction of their individual organisations, although the nature of their work will subtly change to become technology-based decisions. Executives will find themselves choosing an algorithm instead of directly making a high-risk investment decision, or they may end up selecting an artificial intelligence machine rather than interviewing people to become employees. Reduction in the wage bill at other levels of the business and the increasing significance of the few human decisions that need to be made may even assist in justifying their annual bonuses.

Inevitable change

The traditional banking sector is an obvious area for artificial intelligence and automation to generate competitive advantages for companies. This is a result, in part, of previous reluctance to embrace change. In the late 1990s there was a collective hysteria around the Y2K bug and fear of a wholesale shutdown of computers which failed to cope with the millennium date change. That highlighted the sector’s uneasy relationship with fast-moving technological change. But even this public panic prompted few immediate, practical changes.

Now, mobile app-only banks, with no branches, such as N26 and Monzo, challenge the traditional banking sector and its human resources legacy. Traditional banks are still largely oriented towards humans doing most of its work. In 2016, over 1m people, or 3.1% of the UK workforce, were employed in the finance services sector, which is the biggest tax contributor to the UK economy and the country’s largest exporter. Most predictions claim around 50% of the jobs in the sector will be lost. Depending on who you listen to, this process will take between five and 20 years.

The impact of these changes will be felt across the entire economy. There exists a genuine fear that artificial intelligence, robotics and fully digital businesses may contribute to a significant increase in the gap between rich and poor.

Deutsche Bank’s CEO is being frank about a future where jobs in banking and elsewhere will become ever more scarce as digital business becomes a reality. This realisation has reinvigorated calls for a universal basic income (UBI) or a social dividend in the UK and elsewhere. The proposal has found support with some MEPs as a means to maintain personal levels of prosperity in this new world. Crucially too, the UBI would seek to maintain the foundations of the current Western economy in an era of increasingly fully automated digital businesses – a goal, if achieved, which might also just about keep the current finance and banking sector in business.

Authors: Gordon Fletcher, Co-director, Centre for Digital Business, University of Salford; David Kreps, Senior Lecturer in Centre for Digital Business, University of Salford

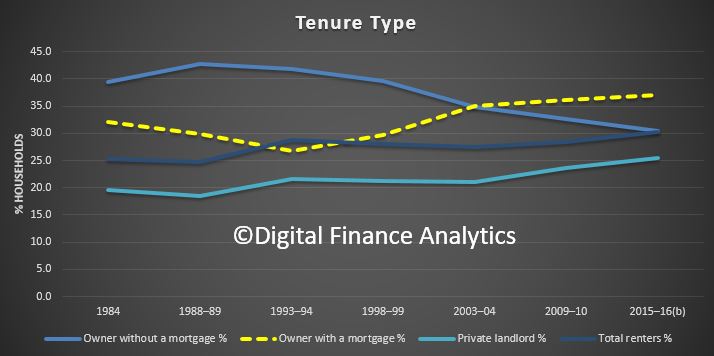
Households Spending More On Basics

The ABS has released their 2015-16 Household Expenditure Survey (HES).

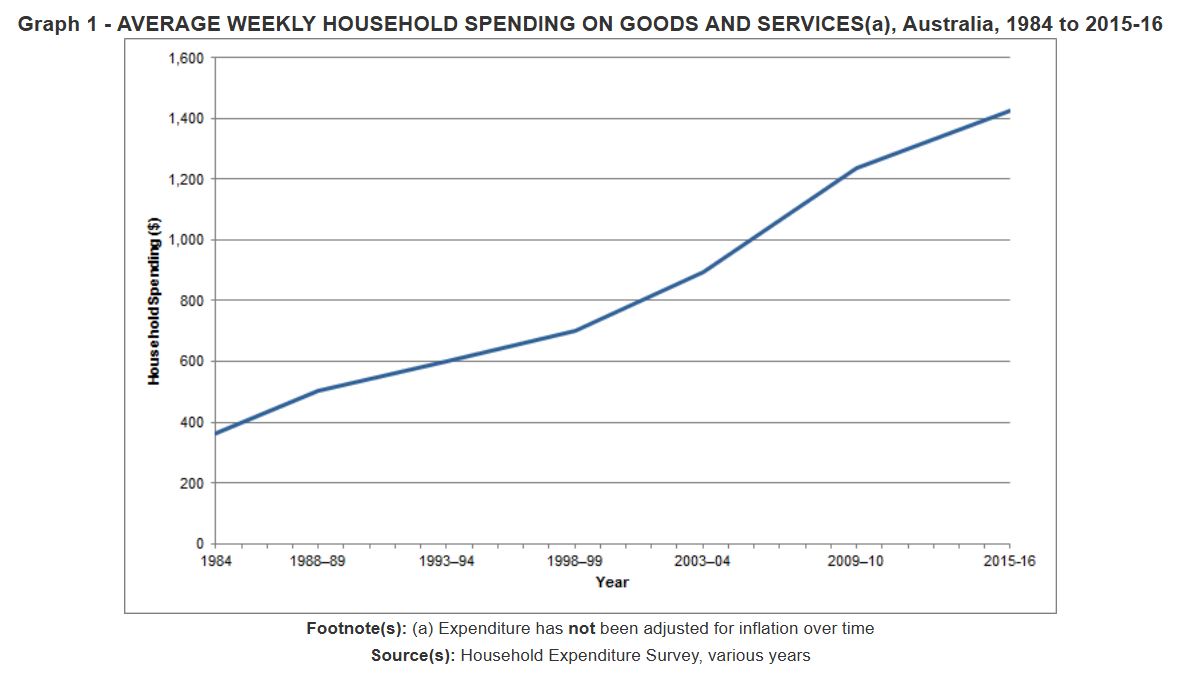
More than half the money Australian households spend on goods and services per week goes on basics – on average, $846 out of $1,425 spent.

Australian household spending on goods and services increased by 15% between 2009-10 and 2015-16, going from an average of $1,236 per week to $1,425.

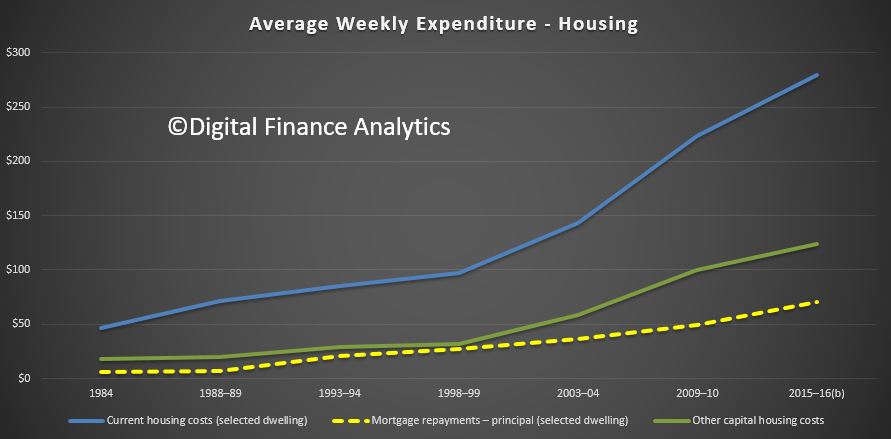
Housing costs have accelerated significantly.

The data shows that more households now have a mortgage, while less are mortgage free. Rental rates remain reasonably stable, despite a rise in private landlords.

The goods and services that Australian households were spending the most on in 2015-16 were current housing costs ($279 per week), food and non-alcoholic beverages ($237 per week) and transport ($207 per week).

Average weekly spending on goods and services was highest in the Northern Territory and Australian Capital Territory ($1,700 and $1,670) and lowest in Tasmania and South Australia ($1,141 and $1,192).

“We can broadly think about household spending as either being for ‘basics’ or for ‘discretionary’ purchases – with basics covering essentials such as housing, food, energy, health care and transport,” ABS Chief Economist, Bruce Hockman said.

Today’s release shows that a growing portion of weekly outlays is spent on basics. Spending on basics accounted for 56 per cent of weekly household spending in 1984, growing to 59 per cent in 2015-16.

“The survey also shows that since 1984, the pattern of household spending has changed considerably,” explained Mr Hockman.

“In 1984, the largest contributors to household spending were food (20 per cent), then transport (16 per cent) and housing (13 per cent).”

“Jump forward to 2015-16, and housing is now the largest contributor (20 per cent), followed by food (17 per cent), and transport costs (15 per cent).”

More recently, since the last survey in 2009-10, the biggest increases in spending on goods and services by households have been in education (44 per cent), household services and operations, such as cleaning products and pest control services (30 per cent), energy (26 per cent), health care (26 per cent) and housing (25 per cent).

On the other hand, spending on alcohol, tobacco, clothing and footwear and household furnishings have not changed significantly from six years ago.

Mr Hockman added that, in 2015-16, 1.3 million Australian households (15 per cent) reported 4 or more markers of financial stress, down from 16 per cent in 2009-10. In addition, the proportion of Australian households who did not report experiencing any markers of financial stress has steadily increased, from 54 per cent in 2009-10, to 59 per cent in 2015-16.


  • ‘Housing’ includes expenditure on rent, interest payments on mortgages, rates, home and content insurance and repairs and maintenance. Principle repayments on mortgages are reported separately.
  • ‘Food’ also includes expenditure on non-alcoholic beverages and meals out. Expenditure on alcoholic beverages are reported separately.
  • ‘Energy’ includes domestic fuel and power costs such as gas and electricity.
  • ‘Health care’ includes expenditure on health practitioner’s fees, accident and health insurance, and medicines, pharmaceutical produces and therapeutic appliances.
  • ‘Transport’ includes vehicle purchases and their ongoing running costs, public transport, taxi and ride sharing fares.
  • Proportions of spending are based on total goods and services expenditure. This excludes items which increase household wealth (such as the principal component of mortgage repayments).
  • Financial stress indicators include a range of items, such as not being able to raise emergency funds.
  • Estimates are for people who reside in private dwellings in Australia, excluding Very Remote areas.

CBA Joins The New Loan Grab

From The Adviser.

The Commonwealth Bank has announced the availability of a $1,250 refinance rebate for “select applications” along with a series of rate changes.

In a broker note released 12 September, CBA advised brokers that the bank is offering a $1,250 rebate for “new external refinance investment and owner-occupied principal and interest home loans”. The rebate can be accessed via CBA’s home loan pricing tool.

ING DIRECT in late August acknowledged that its recent $1,000 refinance offer extended to customers had put brokers in an “uncomfortable predicament” as the offer was only available via the bank’s proprietary channel. However, head of distribution Mark Woolnough added that the bank does not have plans to extend the offer to the broker channel.

He said: “We never wanted to put you or your customer in that predicament where they could potentially question your honesty and integrity by not telling them.

“So, will we make it available to brokers? As it currently stands? No. But do we need to look at the way it is currently operated at the moment? Yes.”

Rate changes

In the same note, CBA announced a series of reductions to certain fixed rate loans. Effective immediately, four and five-year term fixed rate principal and interest owner-occupied home loans will both fall by 20 basis points to 4.19 per cent per annum (p.a.).

Additionally, fixed interest-only investment rates with four and five-year terms will fall by 10 and 20 basis points, respectively, to 4.99 per cent p.a.

All impacted loans fall under CBA’s mortgage advantage package (MAV).

The changes follow a spate of rate adjustments announced by ANZ, MyState and Suncorp this week.

ANZ increased its fixed rate two-year investor loans (with principal and interest repayments) by 31 basis points to 4.34 per cent p.a., while its two-year fixed resident investor loan with an interest-only repayment structure fell by 10 basis points to 4.64 per cent p.a.

Suncorp also reduced fixed rates on its two and three-year investment home package plus loans by 20 and 30 basis points, respectively. The new rate for both is 4.29 per cent p.a., provided that the loan is for more than $150,000 and the loan to value ratio (LVR) is less than 90 per cent.

Suncorp said that the changes to its “two most popular fixed rate products for investors” were “a reflection of recent reductions to fixed rate funding costs”.

Brokers and Banks Respond to ‘Liar’ Loan Claims from UBS

From Mortgage Professional Australia.

The MFAA and FBAA have harshly criticised a UBS report which claimed 1/3 of mortgage applications were not entirely accurate (which they term ‘liar loans’).

The report, which also claimed broker channel loans were more likely to contain inaccurate information, was branded ‘reckless’ by the FBAA because it was “based on implied presumptions.”

MFAA CEO Mike Felton questioned the validity of UBS’ results, stating that “we particularly question their comparison of misrepresentation in the ‘Banker vs broker’ channels given that the actual data shows us that default rates experienced on loans originated through the respective channels are quite similar once controlled for demographic differences.”

Felton also pointed to the low numbers of brokers being deregistered by ASIC, the high market share of brokers and ASIC’s Review of Mortgage Remuneration to counter UBS’ claims. He also notes that “whilst the broker is an intermediary in the process with a significant role, final responsibility for approving or declining a loan has to lie with the lender.”

eChoice’s general manager of aggregation Blake Buchanan argued that UBS’ report demonstrated a lack of understanding of the sector: “the level of scrutiny for  broker introduced business is greater than their retail counterparts and with advancements in technology, information sharing and better regulation the event of misrepresentation is more discoverable than ever before.”

Lenders also criticised UBS. Major bank ANZ, which was singled out by UBS for an alleged high proportion of incorrect loans, told MPA: “a survey of 907 people covering all of the major banks is an extremely limited sample given ANZ has more than one million home loans.”

Methodology and sample size

UBS results come from an online survey of 907 individuals who had taken out mortgages in the last 12 months.

Peter White, executive director of the FBAA, has asked to see UBS’ questions (of which there were 70) and asked whether participants were paid to take part, arguing that “UBS must prove there is no steering of answers or influences to produce outcomes which are not factual or fair or commercially sound.”

ANZ and brokers have questioned whether UBS’ sample size could adequately support the bank’s claims. UBS does not disclose what proportion of its respondents used brokers, but assuming 50%, that meant 65 respondents claimed “the broker suggested I misrepresent” on their mortgage application. Just 9 individuals claimed bankers had suggested they misrepresent.

In comparison, ASIC’s Review of Mortgage Broker Remuneration analysed 1.4m home loans worth $5.5bn, collecting 157 data points for each, in addition to surveying 3000 consumers on their opinion of brokers.

The MFAA told MPA it will continue to benchmark against ASIC’s data rather than consumer surveys.

UBS involvement in Australia and fines

FBAA boss White also criticised UBS’ knowledge of mortgage broking: “this is not their data and not data from a bank/lender, so the question must be asked as to the accuracy and integrity of the research, which is fundamentally divorced of market broker and lender marketplace data.”

According to APRA’s monthly banking statistics, UBS have $0 lent out in mortgages in Australia although they are involved in over $2bn of lending to Australian corporations.

UBS themselves disclose they are linked to the major banks through the provision of investment banking services. However, the bank is not a member of the Australian Bankers Association or the Australian Finance Industry Association, and so not involved in the Combined Industry Forum on broker remuneration.

The bank has been fined for misconduct several times in recent years, albeit for services not clearly connected with their recent report, and in many cases outside Australia.

In 2015 UBS was fined US$545m by the UK regulator for rigging inter-bank exchange rates, US$15m in 2016 by the US regulator for failing to properly instruct financial advisors on the products they were selling and 2 million Swiss Franks in 2017 for releasing price-sensitive information too late. UBS’ most recent brush with ASIC was a $280,000 fine in June this year for incorrect disclosures related to trading and an electronic trading system.

What is the industry doing to respond?

With UBS’ report covered extensively by Australia’s financial and mainstream press, the industry has come under pressure to protect broking’s reputation.

The MFAA and FBAA have made public statements against the report, although it is not clear whether they will engage directly with UBS.

ANZ told MPA that: “We have processes in place designed to ensure our home loans continue to be assessed conservatively. This includes applying an interest rate floor of 7.25% and using the higher of either the customer-stated expenses or a benchmark based on independent data provided by the Melbourne Institute.”

ANZ added that UBS’ report “reinforces the need for the introduction of Comprehensive Credit Reporting which ANZ strongly supports.”

More Mortgage Rate Cuts To Attract New Borrowers

More evidence of competition for lower risk new borrowers, including interest only mortgages.

From Australian Broker.

MyState Bank has announced a decrease in its two-year fixed home loan rates for new, owner-occupied home loans with an LVR equal to or below 80%, effective immediately.

MyState’s two-year fixed home rate for principal and interest lending has reduced by 30 basis points to 3.69% p.a. (comparison rate 5.01% p.a.), while the interest-only two-year fixed option has also reduced by 30 basis points to 3.89% p.a. (comparison rate 5.05% p.a.).

MyState group executive of broker distribution Huw Bough said the lower rates were part of the bank’s commitment to providing broker partners with competitive products and services so both could attract new customer groups and steadily grow their loan books.