The hollow promise of construction-led jobs and growth

From The Conversation.

Any downturn in the construction industry could trigger job losses to a range of sectors that support the building industry, such as planning, project management, real estate and property services. This threat reveals the risk of relying on building and construction to sustain the economy.

Since before the global financial crisis, urban economies across the world have relied increasingly on the construction of housing, especially high rise urban apartments, to maintain economic activity.

Construction has boomed in Australia, especially in Melbourne and Sydney. Migration from overseas and interstate, as well as international student numbers, have so far maintained sufficient demand for city apartments and suburban houses to keep the building boom going.

Nationally the number of jobs in construction has increased from 927,000 in May 2007 to 1,110,400 in May 2017, an increase of 183,400 jobs. Even now, the federal government expects that construction employment will increase by 10.9% in the five years to 2022.

But this view is at odds with new data. A recent report by advisory firm BIS Oxford predicts that new dwellings construction will fall by 31%, from 230,000 to 160,000 dwellings in Australia, in the next three years. This prediction foreshadows a dramatic decline in construction employment.

The other jobs construction creates

Construction activity creates employment across the economy. There are jobs in industries that provide input building materials – such as local quarries and forests, sawmills, concrete products manufacturers, steel makers and glass, plastic and metal products manufacturers. There are also jobs created for people working in import firms bringing in materials that might not be made locally, as well as for people who work to store materials and transport them from ports and factories to building sites. Construction generates jobs for people involved in the design and planning of buildings, also those involved in the financing and contracting of construction projects.

Once the buildings exist, construction creates more jobs in marketing the properties, building inspections, buyers agents, mortgage brokers, real estate agents and the like. After the sale, more jobs are sustained in interior designer, selling furnishings and fittings and appliances, and providing internet connections and utilities.

The wages earned and taxes paid by these workers then create jobs in other services industries. This includes everything from dentists and personal trainers to bank tellers and public servants. New populations create new demand for supermarkets and schools and hospitals that employ more people.

The secondary circuit of capital

Following the ideas of French urban theorist Henri Lefebvre, geographer David Harvey famously explained a process called the “second circuit of capital” where building replaces manufacturing as the driver of growth. This secondary circuit soaks up the excess capital sloshing around the world that can’t be invested profitably in the primary circuit of (manufacturing) production. Buildings are built for the purpose of generating profits for developers and investors.

In places like Melbourne, the secondary circuit has created so many jobs in construction and related industries, that these have become the key drivers of growth. All these jobs are at risk when construction activity stalls.

David Harvey’s crucial insight was that once economies rely on construction to drive employment, then the entire economy becomes like a giant Ponzi scheme. The only way that employment in a host city can be maintained is to keep building more buildings.

Harvey argues the principle purpose of building is to generate profit, which means that the building will stop if there are insufficient numbers of buyers, or insufficient buyers willing to pay a price that will generate profit.

If the developers can elect to build elsewhere, in places where returns are higher, the local construction-led system can collapse like a house of cards. The resulting crisis would not be confined to the construction sector but would resonate through all the activities contributing to building or benefiting from the taxes and charges generated by building.

That pretty much means everybody. Once the cards fall over, not only do employment opportunities decline, but so do property values, as prices adjust to the new reality.

Some economists recommend creating new infrastructure projects to provide work, to keep the construction sector and material suppliers in business. But they rarely consider the second order effects as the downturn in construction filters through the economy. Most economists would argue that dealing with these secondary effects is best left to market forces.

This means that as the downturn filters through the economy, jobs will be lost quietly across a range of sectors. The sectors most obviously vulnerable in the event of a downturn in residential building activity will be those that rely on discretionary building-related spending – such as furniture and effects retailing, wholesaling and manufacturing. The impacts on affected households will be no less devastating than for direct building jobs.

Author: Sally Weller, Visiting Fellow, Australian Catholic University

CBA credit card scandal ‘just the tip of the iceberg’

From The New Daily.

The Commonwealth Bank credit card insurance scandal is the “tip of a very large iceberg”, legal experts have warned.

Philippa Heir, a senior solicitor at the Consumer Action Law Centre, welcomed the bank’s promise to repay $10 million to 65,000 students and unemployed people sold dodgy credit card insurance.

“Unfortunately it’s very widespread,” she told The New Daily.

“We’ve seen misselling of this sort of insurance on a large scale.”

On Monday, corporate regulator ASIC revealed that CBA – already mired in a money-laundering scandal – had agreed to refund about $154 to each of the 65,000 affected customers, who were sold ‘CreditCard Plus’ insurance between 2011 and 2015 despite being unable to claim for payouts.

CBA told the market it “self-reported the issue” to ASIC in 2015, and that the insurance was “not intentionally sold to customers who were not eligible”.


It was an example of what Consumer Action calls ‘junk insurance’, which is where inappropriate insurance policies are slipped covertly into the paperwork for car loans, credit cards and other financial products, or where the salesperson pressures the customer to buy unsuitable coverage.

Ms Heir said the CBA example was by no means an isolated case, and that many victims were poor.

“People who’ve spoken to us say they were told they had to [pay for insurance] or they would not qualify for finance for the car they needed to support their family. So this is affecting people on lower incomes significantly.”

Last year, ASIC published the results of a three-year investigation of add-on insurance sold by used car dealers. Its sample group paid $1.6 billion in premiums for only $144 million in payouts.

This amounted to an average payout of nine cents per dollar of premiums, compared to 85 cents for comprehensive car insurance, ASIC reported.

Consumer Action has set up a website to help Australians claim refunds from insurers. More than $700,000 has been claimed so far.

Here are the potential warning signs that a policy may be unsuitable.

Be wary of pressure selling

Consumer Action’s Ms Heir said high-pressure sales tactics were a danger sign.

“The key is, if you’re being put under pressure to buy insurance, that might ring alarm bells that you should shop around.”

An independent review of the banking sector, released in January, contained shocking revelations from bank staff who reported being forced to oversell financial products, including unnecessary insurance.

One anonymous bank teller said: “If I do not meet my daily sales target I have to explain how I will catch up at morning meetings of the team. I am behind in sales of wealth and insurance products and need to catch up to keep my job.”

Be wary of add-on insurance

ASIC’s recent investigation related specifically to add-on general insurance policies sold by used car dealers. It found “serious problems in the market”.

These add-on policies cover risks relating either to the car itself, or to the car loan. Examples include ‘consumer credit insurance’ and ‘tyre and rim insurance’.

Consumer Action agreed it was a high-risk area.

“One person we spoke to spent $20,000 for add-on insurance on a $60,000 car loan, so it took that loan from $60,000 to $80,000, which is hard to even comprehend,” Ms Heir said.

Be wary of insurance for small losses

An expert on investor behaviour, Dr Michael Finke of Texas Tech University, warned in a recent financial literacy series that fear of losing money temps consumers to buy unnecessary insurance.

Buying a policy is “rational” only when the probability of losing money is low and the size of the potential loss is high, Dr Finke said.

“It’s a good strategy to make sure that you let the small ones go so you can focus on insuring bigger losses.”

He recommended setting a “risk retention limit” – a dollar figure below which you don’t insurance yourself.

“This limit should be based on your wealth and your ability to cover a loss if it happens,” he said. “This may mean keeping a little bit more money in a liquid savings accounts just in case.”

RBA Minutes For August Says Little (In Many Words)

The latest RBA minutes really does not add much to our understanding, other than the bank continues to watch developments in the property market, they are holding to their forecasts on growth, and the signals across the economy are mixed.

Perhaps they were muted because of the reaction to the 2% rate lift to neutral last month, which was hurriedly walked back subsequently!

Domestic Economic Conditions

Members commenced their discussion of the domestic economy by noting that the June quarter inflation data had been in line with the Bank’s expectations and provided further confirmation that inflation had increased since 2016. Underlying inflation was ½ per cent in the June quarter and headline inflation was only slightly lower. Both Consumer Price Index (CPI) inflation and measures of underlying inflation were running at a little under 2 per cent in year-ended terms.

Non-tradables inflation had reached its highest year-ended rate in two years in the June quarter, boosted by rises in tobacco excise and utilities prices. Market services inflation had increased since 2016, but remained low; around half of total costs in the market services sector are labour costs, and these had been subdued over recent years. Inflation in the costs of constructing a new dwelling had also increased over the prior year in all capital cities other than Perth and Adelaide. In contrast, rents had been increasing at a below-average pace in Sydney and Melbourne, had been falling in Perth and had been broadly stable in most other capital cities.

The prices of tradable consumer durable items had declined over the year, partly reflecting the appreciation of the exchange rate and heightened competition from foreign retailers. Inflation in food prices (excluding fruit and vegetables) had been running at low rates for several years. Supply disruptions from Cyclone Debbie had had relatively little net effect on fruit and vegetables prices in the June quarter. Fuel prices had fallen in the quarter, but had contributed 0.2 percentage points to headline inflation over the year.

Members noted that the Australian Bureau of Statistics intends to update the weights in the CPI in the December quarter 2017 CPI release, to reflect changes in consumers’ spending behaviour over recent years. This was expected to lead to lower reported CPI inflation because the weights of items whose prices had fallen were likely to be higher, whereas the weights of items whose prices had risen were likely to be lower.

In their discussion of the outlook for the domestic economy, members noted that the Bank’s forecasts for output growth and inflation were largely unchanged from three months earlier. They noted that the forecasts were conditioned on the assumption of no change in the Australian dollar exchange rate during the forecast period, which extends to the end of 2019, and that this assumption was one source of uncertainty.

The available data on activity suggested that GDP growth had increased in the June quarter, following weaker-than-expected growth in the March quarter. Output growth was expected to reach around 3 per cent in year-ended terms during 2018 and 2019, which was a little higher than estimates of potential growth. The recent data had indicated that consumption growth had increased in the June quarter. The value of retail sales had risen strongly in April and May, and the increases had been broadly based both nationally and across spending categories. Beyond the June quarter, rising employment and stronger household income growth were expected to support consumption growth, which was forecast to be a little above its average of recent years.

Dwelling investment was expected to recover from the weakness in the March quarter, which was partly the result of wet weather in New South Wales, and remain at a high level over the following year or so, sustained by the large pipeline of residential building work already approved or under way. The number of new residential building approvals had stepped down since 2016 and members noted that, if approvals remained at current levels, construction activity could also begin to decline.

The established housing markets in Sydney and Melbourne had remained the strongest in the country, although conditions had eased since late 2016. Housing prices in Perth had declined a little further, while apartment price growth in Brisbane had been weak.

Turning to the business sector, members noted that activity in the mining sector was expected to be supported in the June quarter by stronger resource export volumes. Coking coal exports had returned to pre-cyclone levels in May, and liquefied natural gas exports had continued to increase. The decline in mining investment was expected to run its course in the following year or so and thereafter no longer be a drag on growth. Resource exports were expected to make a significant contribution to GDP growth over the forecast period.

Investment by non-mining businesses was expected to pick up later in the forecast period in response to stronger growth in demand. Businesses had continued to report above-average business conditions and members noted that many of the conditions that might typically be associated with stronger growth in investment were in place. Some indicators of non-mining investment, including recent strength in sales of commercial motor vehicles and the higher investment intentions recorded in the NAB survey, had been more positive in the period leading up to the meeting. The increase in the level of non-residential building approvals had also signalled a more positive outlook for private non-residential construction, although the pipeline of work to be done was at low levels. The pipeline of public infrastructure activity had increased over the previous few years, to be at its highest share of GDP since the mid 1980s. The expected increase in expenditure on public infrastructure had been reported as flowing into the order books of firms in the private sector.

Members observed that recent data had suggested further improvement in the labour market. Employment had increased in every state since the start of 2017, including solid growth in the mining-exposed states. This provided further evidence that the drag on economic activity from earlier declines in the terms of trade and falling mining investment were running their course. Over this period, around 165,000 full-time jobs had been created, labour force participation had risen and average hours worked had increased.

The unemployment rate had been little changed in June at 5.6 per cent and underemployment had edged lower over prior months. Indicators of labour demand had pointed to further employment growth and little change in the unemployment rate over coming quarters. By the end of the forecast period, the unemployment rate was expected to be just below 5½ per cent, slightly lower than forecast in May but still implying a degree of spare capacity in the labour market. Members observed that the recent improvement in labour market conditions and the increase in award wages should help support household incomes and thus spending. Some upside risk to spending could be envisaged if employment were to be higher than forecast. On the other hand, expectations of ongoing low wage growth could weigh on consumption growth. Spending could also be constrained by elevated levels of household debt, especially if housing market conditions were to weaken.

More broadly, members noted there was some uncertainty about the effect any decline in spare capacity in the labour market would have on wage and price inflation. Information from liaison indicated that some employers were finding it harder to attract workers with particular skills. If this were to broaden, wage growth could increase more quickly than forecast, which would see inflationary pressures also emerge more quickly. However, wage and price inflation had not increased by as much as expected in other economies around the world that are already close to full employment, which raised the possibility that low inflation in Australia might also persist longer than forecast.

Turning to the inflation forecast, members noted that underlying inflation was expected to be close to 2 per cent in the second half of 2017 and to edge higher over the subsequent two years. Most of the difference between headline and underlying inflation over the forecast period could be accounted for by further increases in tobacco excise and utilities prices. Retail electricity prices were expected to increase sharply in the September quarter, following the increases in retail prices in New South Wales, Queensland and Western Australia on 1 July, and the March quarter 2018, when similar increases were expected in Victoria. Members acknowledged that the second-round effects of higher utilities prices on retail prices through business costs were uncertain, partly because it was unclear when utilities contracts for businesses would be subject to renewal. Members also observed that energy is a relatively low share of costs for most businesses, although it is higher for some businesses that compete in international markets.

The inflation forecast partly reflected an expectation of a modest increase in wage growth as labour market conditions tightened further and the drag on activity and incomes from falls in mining investment and the terms of trade diminished. Working in the opposite direction were the effects of additional competition in the retail industry, the dampening effect of expanding housing supply on growth in rents, and the recent exchange rate appreciation. Headline inflation had been revised a little higher in the updated forecasts, mostly reflecting the prospect of faster growth in utilities prices, and was expected to be between 2 and 3 per cent over much of the forecast period.

International Economic Conditions

Members commenced their discussion of the global economy by noting that economic conditions had strengthened over the prior year and the improvement had broadened beyond international trade. In particular, growth in business investment had picked up in several advanced and emerging economies, including the United States, Canada, Japan and a number of economies in east Asia. Consumption growth had been resilient. Recent GDP data had generally confirmed earlier expectations and, accordingly, the forecast for global growth had been little changed since that published in the May Statement on Monetary Policy. A gradual increase in global inflationary pressures over the subsequent couple of years had seemed likely, as spare capacity in many advanced economies was expected to be absorbed, resulting in higher wage growth. However, as members noted, even though labour market conditions had already tightened in some advanced economies, wage growth and core inflation had remained subdued.

Growth in GDP in China had been a little stronger than expected in the June quarter, supported by accommodative financial conditions and expansionary fiscal policy. The strengthening in conditions in the industrial sector over recent months had been broadly based; construction activity had been resilient, although housing market policies introduced in some cities over the preceding year had been effective in lowering overall housing price inflation. Demand for both consumer goods and Chinese exports had picked up. The strength in manufacturing and construction activity had contributed to higher demand for steel. As a result, imports of iron ore, including from Australia, had trended higher and prices for iron ore and coking coal had increased since the previous meeting. The outlook for Australia’s thermal coal exports had not benefited to the same extent, partly because there had been an increase in domestic Chinese production. The forecast for Australia’s terms of trade had been revised up a little since May, but still implied a decline from their recent peak.

Growth in China was expected to ease in 2018 and 2019 because of structural factors such as a declining working-age population, as well as policies to address financial risks. Members noted that the outlook for the Chinese economy remained a significant source of uncertainty. In particular, it was unclear how the authorities would negotiate the difficult trade-off between growth and the build-up of leverage in the Chinese economy. To address risks in the shadow banking sector, the authorities had recently sought to improve coordination among financial regulators and had announced tighter regulatory measures. Members noted that such measures could be difficult to calibrate and that, as a result, financial conditions might tighten by more than expected.

GDP growth in the rest of east Asia looked to have been around estimates of potential in the first half of 2017, supported by accommodative policies as well as the increase in global trade growth. Members noted that many economies in this region were deeply integrated into global supply chains, particularly for semiconductors and other electronics. There had also been signs of a recovery in retail sales and a sharp increase in consumer confidence in South Korea, the largest economy in the region.

In the three largest advanced economies, investment growth had picked up and employment growth had supported growth in household incomes and consumption. GDP growth had picked up in the June quarter in the United States and had been above potential rates for some time in the euro area and Japan, which had experienced sizeable increases in exports as global economic conditions had improved. GDP growth in all three major advanced economies was expected to remain above estimates of potential growth over the forecast period. Unemployment rates had declined to low levels in all three economies and in the United States and Japan were below levels associated with full employment.

Financial Markets

Members noted that over recent months most attention in international financial markets had been on changes in expectations regarding monetary policy. In a number of advanced economies, monetary policy was expected to be somewhat less accommodative than previously anticipated.

At its June meeting, the US Federal Open Market Committee (FOMC) increased its policy rate and outlined plans for a gradual and predictable reduction in the size of the Federal Reserve’s balance sheet. More recently, the FOMC had indicated that the balance sheet reduction would be likely to begin relatively soon. Financial market participants continued to expect further increases in the US federal funds rate to occur more slowly than implied by the median projections of FOMC participants. At its July meeting, the European Central Bank had emphasised that monetary policy needed to remain very accommodative, but had also indicated that it will consider whether to reduce the pace of asset purchases at one of its forthcoming meetings. In July, the Bank of Canada raised its policy rate for the first time in seven years and financial market participants expected further increases. Central banks in several other advanced economies had also adjusted their communication over recent months so as to remove earlier biases towards easier monetary policy.

Long-term government bond yields had responded to the changes in expectations for the stance of monetary policy, with yields in most major financial markets, as well as in Australia, having risen from their levels in early June. Members noted, however, that yields remained at low levels. In Japan, yields on 10-year government bonds had remained around zero during 2017, consistent with the Bank of Japan’s policy of yield curve control.

Members observed that financial market conditions remained very favourable. Corporate financing conditions had continued to improve, with the increase in equity prices and decline in corporate bond spreads having continued over 2017 in the United States and the euro area.

In China, financial market conditions also remained accommodative, but had tightened since the end of 2016 as the authorities had instituted a range of measures to reduce leverage in financial markets. Bond yields had increased markedly since late 2016, despite a slight retracement in recent months, and corporate bond issuance had slowed following strong growth over the preceding several years. Members observed that credit availability to households and businesses had been relatively unaffected by the regulatory measures. The renminbi exchange rate had appreciated against the US dollar since the beginning of 2017, but had depreciated in trade-weighted terms. The Chinese authorities had increased their scrutiny of capital flows, resulting in a decline in net capital outflows, and the value of the People’s Bank of China’s foreign currency reserves had stabilised.

Members noted that there had been a broadly based depreciation of the US dollar over 2017, including against the Australian dollar. The appreciation of the Australian dollar over the previous two months had resulted in it returning to 2015 levels in US dollar terms and to the levels of late 2014 on a trade-weighted basis.

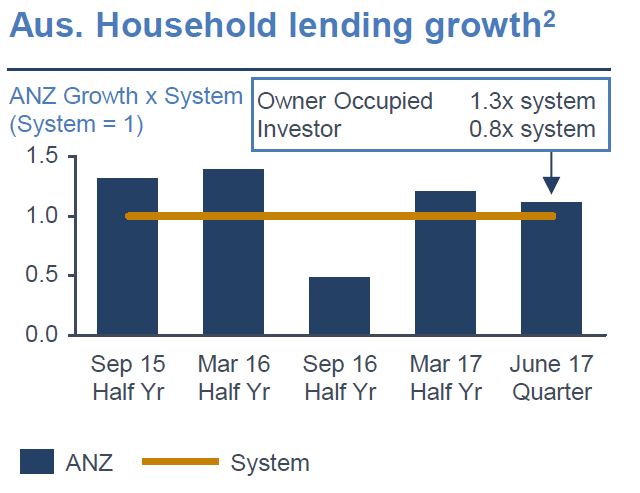
In Australia, housing credit growth had been steady over the first half of 2017, as a decline in growth in housing credit extended to investors had been offset by a slight increase in growth in housing credit to owner-occupiers. Members discussed the relative increases in housing lending rates to investors compared with owner-occupiers and for interest-only loans compared with principal-and-interest loans. Overall, the average actual interest rate paid on all outstanding housing loans was estimated to have increased slightly since late 2016. Housing loan approvals to investors had declined in recent months, which pointed to some easing in growth in housing credit to investors. The share of interest-only housing loans in total loan approvals appeared to have declined noticeably in the June quarter in response to recent measures introduced by the Australian Prudential Regulation Authority (APRA) to improve lending standards. Moreover, there was evidence of some switching of existing interest-only loans to principal-and-interest loans.

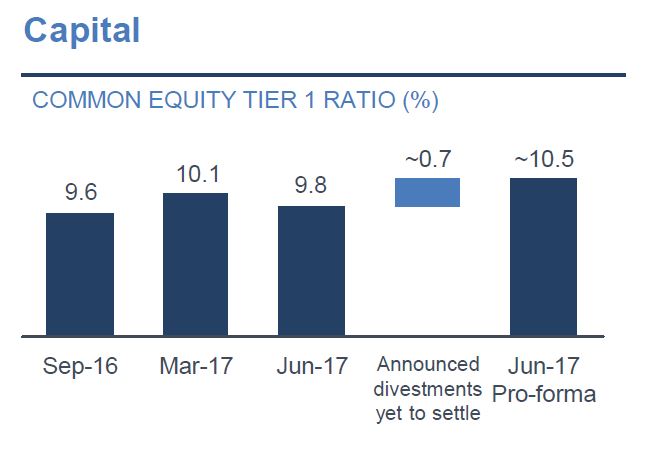
Australian share prices had been broadly steady in recent months. Over July, bank share prices had retraced some of their earlier decline, in line with a rise in bank share prices globally and following APRA’s announcement of additional capital requirements for the banking sector, which were only slightly higher than banks’ current actual capital ratios. The major banks had been issuing increasingly longer-dated bonds, including two large US-denominated 30-year bond issues in July. Members noted that longer-dated bonds are favoured under the Net Stable Funding Ratio requirement, which will come into effect in 2018. Members also noted that Australian issuance of residential mortgage-backed securities had continued at the relatively strong pace seen since late 2016.

Financial market pricing had continued to suggest that the cash rate was expected to remain unchanged over the remainder of 2017, with some expectation of an increase in the cash rate by mid 2018.

Considerations for Monetary Policy

In considering the stance of monetary policy, members noted that the improvement in global economic conditions had continued, particularly in China and the euro area. Demand growth from the Chinese industrial sector had been stronger than expected and had contributed to higher commodity prices. Labour markets had continued to tighten in a number of economies, but inflation had generally remained subdued. There had been a broadly based depreciation of the US dollar. Consistent with that, a number of currencies were close to their highs of the previous few years against the US dollar, including the euro and the Canadian dollar. The Australian dollar also had risen to levels last seen in 2015.

Domestically, the outlook was little changed. The forecast was for GDP growth to increase to around 3 per cent during the forecast period, supported by the low level of interest rates. Business conditions had improved further and faster growth in non-mining business investment was expected. Inflation was still expected to increase gradually as the economy strengthened. However, a further appreciation of the exchange rate would be expected to result in a slower pick-up in inflation and economic activity than currently forecast.

Employment growth had been stronger over recent months, so the forecasts for the labour market were starting from a stronger position. Forward-looking indicators suggested that the degree of spare capacity in the labour market would continue to decline gradually. Wage growth had remained low but was still expected to increase a little as conditions in the labour market improved. Members observed that recent strong employment growth would be likely to contribute to an increase in household disposable income, and therefore consumption growth, over the forecast period. However, ongoing low wage growth and the high level of debt on household balance sheets raised the possibility that consumption growth could be lower than forecast.

Members regarded conditions in the housing market and household balance sheets as continuing to warrant careful monitoring. Conditions in the housing market varied considerably around the country. While there were signs that conditions in the Sydney and Melbourne markets had eased somewhat, housing price growth in these two cities had remained relatively strong. In some other housing markets, prices had been declining. Borrowers investing in residential property had been facing higher interest rates and growth in credit to investors had eased, but overall housing credit growth had continued to outpace the relatively slow growth in household incomes.

Taking account of the available information and the need to balance the risks associated with high household debt in a low-inflation environment, the Board judged that holding the stance of monetary policy unchanged would be consistent with sustainable growth in the economy and achieving the inflation target over time.

The Decision

The Board decided to leave the cash rate unchanged at 1.5 per cent.

APRA To Ease New Banking Entrance Requirements

APRA is reviewing its licensing approach for authorised deposit-taking institutions (ADIs). They propose new entrants could gain an interim licence and operate on a conditional basis for a period before transitioning to a full licence, with a view to increasing competition in the banking sector.

The discussion paper seeks views on the proposed amendments to introduce a phased approach to authorisation, designed to make it easier for applicants to navigate the ADI licensing process.

The phased approach is intended to support increased competition in the banking sector by reducing barriers to new entrants being authorised to conduct banking business, including those with innovative or otherwise non-traditional business models or those leveraging greater use of technology. In particular, the purpose of the Restricted ADI licence is to allow applicants to obtain a licence to begin limited operations while still developing the full range of resources and capabilities necessary to meet the prudential framework.

An overview of the phased approach is depicted below.

In facilitating a phased approach, APRA still needs to ensure community confidence that deposits with all ADIs are adequately safeguarded, and that any new approach does not create competitive advantages for new entrants over incumbents, or compromise financial stability. Therefore, reflecting their relative infancy, Restricted ADIs will be strictly limited in their activity and would not be expected to be actively conducting banking business during the restricted period.

The Restricted ADI licence will be subject to certain eligibility requirements and a maximum period after which they are expected to transition to an ADI and fully comply with the prudential framework or exit the industry.

APRA invites written submissions from all interested parties on its proposals for the phased approach to licensing new entrants to the banking sector.

Submissions close on 30 November 2017.

Submissions are welcome on all aspects of the proposals. In addition, specific areas where feedback on the proposed direction would be of assistance to APRA in finalising its proposals are outlined below.

Introduction of phased approach for ADIs​ ​Should APRA establish a phased approach to licensing applicants in the banking industry?
​Balance of APRA‘s mandate ​Do the proposals strike an appropriate balance between financial safety and considerations such as those relating to efficiency, competition, contestability and competitive neutrality?
​Eligibility ​Are the proposed eligibility criteria appropriate for new entrants to the banking industry under a Restricted ADI licence?
Restricted ADI Licence phase​ ​Is two years an appropriate time for an ADI to be allowed to operate in a restricted fashion without fully meeting the prudential framework? Is two years a sufficient period of time for a Restricted ADI to demonstrate it fully meets the prudential framework?
Minimum requirements​ ​Are the proposed minimum requirements appropriate for potential new entrants to the banking industry? Are there alternative requirements APRA should consider?
​Licence restrictions ​Are the proposed licence restrictions appropriate for an ADI on a Restricted ADI licence? Are there alternative or other restrictions APRA should consider?
Financial Claims Scheme​ ​Are the proposals appropriate in the context of the last resort protection afforded to depositors under the Financial Claims Scheme?
Further refinement​ ​Are there other refinements to the licensing process APRA should consider?

During the consultation process APRA may also look to arrange discussions of these proposals with interested parties

ANZ Q3 FY17 Trading Update

ANZ released their unaudited Statutory Profit for the Third Quarter to 30 June 2017 was $1.67 billion. Provisions were $243 million. Cash Profit of $1.79 billion up 5.3%. Profit before Provisions increased 0.3%.

Customer deposit growth of 2.3% with net lending asset growth of 2.0% during the quarter.

Revenue decreased 0.3% which in part reflected a normalisation of the Markets business performance after an unusually strong first half along with the sale of 100 Queen Street.

Expenses reduced 1% and continue to be well managed. As flagged the proceeds of the sale of 100 Queen Street are being reinvested in the business with approximately two thirds occurring in the second half, largely in the final quarter.

The Group Net Interest Margin (NIM) was stable, up several basis points excluding Markets. Australia Division NIM improved offsetting a decline in Institutional NIM. The Australian Bank Levy will impact the NIM in the fourth quarter being reflected within the cost of funds.

The reshaping of the Institutional Division asset base continued with Risk Weighted Assets (RWA) reducing a further $3 billion to $156 billion, with a cumulative reduction of $12 billion (-7%) during the Financial Year to date. The changing profile of the book has resulted in a decline in the Division’s provision charge and an improvement in the risk adjusted return (NII/Average Credit Risk Weighted Assets (CRWA)).

Above system growth in residential mortgages in Australia has been primarily driven by the Owner Occupier segment. The Division is tracking well in respect of meeting various macro prudential requirements regarding mortgage growth.

The total provision charge of $243 million was comprised of an Individual Provision (IP) charge of $308 million and a Collective Provision (CP) release. The release of CP was largely driven by continued reshaping of the Institutional portfolio along with some transfers to IP.

The Australian Prudential Regulation Authority Common Equity Tier 1 (CET1) ratio was 9.8% at 30 June, which incorporates 51 basis points of net organic capital generation offset by the Interim Dividend (59 bps) and adoption of the new RWA models for Australian Residential Mortgages. Proforma CET 1 was 10.5%.

Post the end of the third quarter ANZ completed the sale of the Retail and Wealth businesses in China and Singapore to DBS with Hong Kong expected to complete prior to the end of the second-half. All other transactions remain subject to regulatory approvals and completion.

1 Excludes Markets income
2 Source: ANZ analysis of APRA monthly banking statistics

CBA ‘falls short’ on climate policy

From InvestorDaily.

CBA released its first ‘Climate Policy Position Statement’ yesterday as part of its annual report, in which the bank committed to both decrease the intensity of its business lending and reduce its own emissions.

However, according to environmental financial group Market Forces, CBA has failed to honour its previous commitment to the Paris Agreement goal to limit global warming to 2 degrees.

Market Forces executive director Julien Vincent said CBA’s position statement demonstrated they were “not even pretending” to make an effort.

“Unlike the bank’s peers in Australia and overseas that are taking concrete steps to avoid the most carbon intensive sectors, Commonwealth Bank clearly lacks either the interest or competency to fulfil its commitment to help hold global warming below two degrees,” Mr Vincent said.

According to CBA’s position statement, the bank would “target an average emissions intensity decrease of our business lending portfolio consistent with our commitment to a net zero emissions economy by 2050”.

However, the Market Forces analysis suggested this statement was vague and lacking in detail.

“The wording of this statement is very concerning as it is aspirational but no hard targets are being set,” the analysis said.

“It also covers the bank’s entire business lending, leaving room for some sectors to increase while others decrease. It is also a target that could conceivably be met by adding more renewable energy to energy portfolios (which is of course positive) but not necessarily requiring reductions on exposure to fossil fuels.

“This offers no confidence whatsoever that Commonwealth will reduce its fossil fuel exposure.”

Mr Vincent said the policy statement left “the door wide open” to continue lending to fossil fuel projects.

“That in itself should be enough to conclude this flimsy document has no relationship with the goal of holding global warming to less than 2 degrees,” Mr Vincent said.

The analysis also compared CBA’s commitments in renewable energy lending with its peers and found it to be “a slightly lower commitment pro rata than those of the other major banks”.

In light of what Market Forces called a “dismal” position statement, the environmental group has declared its intention to lodge a shareholder resolution against the bank.

CBA provides an update on customer and employee review and remediation actions

CBA released another update itemising the status of a number of open compliance and other process issues and their remediation programmes. Clearly disclosure is on the minds of the CBA currently!

In the course of reviewing our products and processes and where we see issues, we report to our regulators and fix these for our customers. In addition to updates on a number of customer review and remediation programs in the Annual Report 2017 released today, we are providing an additional update on other issues we are putting right for our customers and employees. This is not an exhaustive list of all regulatory matters, however the following have now reached some key milestones:

Our review of superannuation payments

Earlier this year, we started a review of superannuation payable to our part-time employees working additional hours at single-time rates. As part of this review, we also expanded the scope to all employees and all types of payments going back eight years. This included looking at superannuation and the impact on leave and allowances paid since 1 July 2009 when the Australian Tax Office’s Superannuation Guarantee Ruling was issued.

This review is ongoing and the precise amounts are to be determined. The first tranche, which will commence shortly, is estimated to be $16.7 million plus interest, equating to an average amount per employee of approximately $463 plus interest. The expected total payments and program costs have been conservatively provided for in previous financial years.

We will be contacting the 36,000 current and former employees who are eligible for additional payments.

Refund for some Credit Card Plus insurance customers

In 2015, we identified that some customers who purchased Credit Card Plus insurance (providing cover for a range of circumstances) may not have met the employment criteria, meaning they may not, if the need arose, have been able to receive certain benefits under the policy. We self-reported this issue to the Australian Securities and Investments Commission in 2015, fixed the issue and began working with ASIC on a remediation program.

These customers remain eligible for various benefits of Credit Card Plus insurance such as Death and Terminal Illness, but may not have been eligible to receive benefits for Involuntary Unemployment, Temporary and Permanent Disability. It was not intentionally sold to customers who were not eligible. We have agreed with ASIC to refund these customers who were not eligible to receive these benefits for the period between 2011 and 2015. We will shortly commence refunding customers.

We expect the refunds to total approximately $10 million, including interest, for around 65,000 customers, with an average refund of approximately $154 including interest.

We will continue to engage with ASIC on their wider industry review into consumer credit insurance.

Refund for some Home Loan Protection insurance customers

In February 2016, we identified that some customers who had purchased Home Loan Protection insurance had been charged an incorrect premium amount or had incurred premium charges before the home loan was drawn down. Both issues were self-identified and reported to ASIC in 2016.

This investigation is ongoing, however so far we have refunded approximately 9,600 customers a total of approximately $586,000 including interest, with an average refund of approximately $61 including interest.

Essential Super

ASIC has expressed a concern that some customers may have been given personal advice rather than general advice during the sale of Essential Super. We continue to discuss this topic with ASIC.

Charges on disputed card transactions

In July 2017, we proactively notified ASIC that when refunding disputed transactions on customers’ cards, while the transaction itself was correctly reversed, certain charges associated with the disputed transactions were not always correctly adjusted. We reviewed the 4.5 million disputed transactions going back to 2009 and will shortly commence refunding approximately $5 million including interest for around 355,000 customers, with an average refund of approximately $14 including interest.

Deceased estates

Today, ASIC was notified about an issue affecting some insurance products, where for a number of accounts, a confirmation of the cancellation of an existing insurance policy may not have been sent to the deceased estate. At this stage, the number of customers impacted is expected to be below 1,000. We are currently undertaking a detailed investigation back to the year 2000 to confirm the number of affected customers and will contact their estates and remediate if appropriate.

All of the above amounts have been appropriately provided for in previous financial years.

Credit Card Rules Tightened

The Treasury has released draft legislation for review which is designed to improving consumer outcomes and enhancing competition. The purpose of the amendments is to reduce the likelihood of consumers being granted excessive credit limits, to align the way interest is charged with consumers’ reasonable expectations and to make it easier for consumers to terminate a credit card or reduce a credit limit.

The draft Bill would:

  • require that affordability assessments be based on a consumer’s ability to repay the credit limit within a reasonable period;
  • prohibit unsolicited offers of credit limit increases;
  • simplify how interest is calculated, including prohibiting credit card providers from backdating interest charges; and
  • require credit card providers to have online options to cancel a credit card or to reduce credit limits.

The consultation on the draft Bill will close on Wednesday, 23 August 2017.

Reform 1: tighten responsible lending obligations for credit card contracts

This introduces a new requirement that a consumer’s unsuitability for a credit card contract or credit limit increase be assessed on whether the consumer could repay an amount equivalent to the credit limit of the contract within a period determined by the Australian Securities and Investments Commission (ASIC).

This requirement will apply to licensees that provide credit assistance, and licensees that are credit providers, in relation to both new and existing credit card contracts from 1 January 2019. Existing civil and criminal penalties for breaches of the responsible lending obligations will apply to breaches of the new requirement. Existing infringement notice powers will also apply.

Reform 2: prohibit unsolicited credit limit offers in relation to credit card contracts

This prohibits credit card providers from making any unsolicited credit limit offers by broadening the existing prohibition to all forms of communication and removing the informed consent exemption. These amendments apply in relation to both new and existing credit card contracts from 1 January 2018. Existing civil and criminal penalties for breaches of the prohibition against unsolicited credit limit offers will apply. Existing infringement notice powers will also apply.

Reform 3: simplify the calculation of interest charges under credit card contracts

These amendments will prevent credit card providers from imposing interest charges retrospectively to a credit card balance, or part of a balance, that has had the benefit of an interest-free period. These amendments apply in relation to both new and existing credit card contracts from 1 January 2019.

Failure to comply with this requirement attracts civil penalties of 2,000 penalty units and criminal penalties of 50 penalty units. The infringement notice scheme contained in the Credit Act will also apply.

Reform 4: reducing credit limits and terminating credit card contracts, including by online means

A key amendment is to require credit card contracts entered into on or after 1 January 2019 to allow consumers to request to reduce the limit of their credit card (a ‘credit limit reduction entitlement’) or terminate a credit card contract (a ‘credit card termination requirement’).

Where a credit card contract contains a credit limit reduction entitlement or a credit card termination requirement the amendments also provide for the following:

  • the credit card provider must provide an online means for the consumer to make a request to reduce their credit card limit or terminate their credit card contract;
  • following such a request, the credit card provider must not make a suggestion that is contrary to the consumer’s request; and
  • the credit card provider must take reasonable steps to ensure that the request is given effect to.

These further amendments apply to credit card contracts entered into before, on or after 1 January 2019.

Failure to comply with these requirements attracts civil penalties of 2,000 penalty units and criminal penalties of 50 penalty units. The infringement notice scheme contained in the Credit Act will also apply.


Million Dollar Sales at Record Levels

From CoreLogic.

The cost of housing has continued to rise across most parts of the country over the past 12 months, pushing the proportion of homes selling for at least one million dollars to new record highs.  Bracket creep should come as no surprise in markets like Sydney and Melbourne where dwelling values have increased by 77% and 61% respectively over the past five years.  While the rise in housing values has been most pronounced in Sydney and Melbourne, most other capital cities and regional areas have also seen a proportional lift in home sales over the million dollar mark.

Over the 12 months to June 2017, 15.4% of all house sales and 8.8% of all unit sales nationally were at a price of at least $1 million.  By comparison, 12 months earlier 14.4% of all house sales and 7.5% of all unit sales were at least $1 million in value.

Annual % of sales of at least $1 million,
National

2017-08-14--annual%ofsalesofatleast$1million,national


The instances of dwellings selling for at least $1 million is much more prevalent across the combined capital cities.  Over the 12 months to June 2017, 23.2% of all houses and 10.8% of all units sold in capital cities were sold for at least $1 million.  The proportion of sales of at least $1 million has increased over the year from 21.5% of houses and 9.1% of units.

Some Innovative Mortgage Data

RBA Assistant Governor (Financial Markets) Christopher Kent discussed data from their securitised mortgage data pool. Currently, the dataset covers about 280 ‘pools’ of securitised assets and has information on 1.6 million individual mortgages with a total value of around $400 billion. Currently, this accounts for about one-quarter of the total value of home loans outstanding in Australia.

It is worth noting that securitised loans may not accurately represent the entire market, as loan pools are selected carefully when they are rolled into a securitised structure – “the choice of assets in the collateral pool may be influenced by the way that credit ratings agencies assign ratings and by investor preferences”. That said, there is interesting data contained in the speech, below. Note the focus on household debt. But no data on loan to income (again!)

The Reserve Bank has always emphasised the value of using a wide range of data to better understand economic developments. One relatively new source of data for us is what we refer to as the Securitisation Dataset. Today, I’ll briefly describe this dataset and then I want to tell you a few of the interesting things we are learning from it.[1]

The Bank collects data on asset-backed securities. Currently, the dataset covers about 280 ‘pools’ of securitised assets. We require these data to ensure that the securities are of sufficient quality to be eligible as collateral in our domestic market operations. The vast bulk of the assets underlying these securities are residential mortgages (other assets, such as commercial property mortgages and car loans, constitute only about 2 per cent of the pools). Some of these are ‘marketed securities’ that have been sold to external investors. There are also securities that banks have ‘self-securitised’.[2]

Self-securitisations are primarily used by participating banks for the Committed Liquidity Facility (CLF) in order to meet their regulatory requirements.[3] The size of the CLF across the banking system is currently $217 billion. Self-securitisations are also used to cover payment settlements that occur outside business hours via ‘open repo’ transactions with the RBA.

The Bank has required the securitisation data to be made available to permitted data users (such as those who intend to use the data for investment, professional or academic research). This has helped to enhance the transparency of the market. Much of that has been achieved by requiring data that is comparable across different pools of securities.

Another benefit of the Securitisation Dataset is that it provides a useful source of information to help us better understand developments in the market for housing loans. The dataset covers information on 1.6 million individual mortgages with a total value of around $400 billion. Currently, this accounts for about one-quarter of the total value of home loans outstanding in Australia.

Nature of the data

Let me make a few brief remarks about the nature of the data.

For each housing loan, we collect (de-identified) data on around 100 fields including:

  • loan characteristics, such as balances, interest rates, loan type (e.g. principal-and-interest (P&I), interest-only), loan purpose (e.g. owner-occupier, investor) and arrears status;
  • borrower characteristics, such as income and the type of employment (e.g. pay as you go (PAYG), self-employed);
  • details on the collateral underpinning the mortgage, such as the type of property (e.g. house or apartment), its location (postcode) and its valuation.[4]

The dataset is updated each month with a lag of just one month. The frequency and timeliness of the data allow us to observe changes in interest rates, progress on repayments (i.e. the current loan balance) and the extent of any redraw or offset balances (just to name a few) without much delay.

I should note that, while the dataset covers a significant share of the market for housing loans, it may not be entirely representative across all its dimensions. In particular, the choice of assets in the collateral pool may be influenced by the way that credit ratings agencies assign ratings and by investor preferences. Also, in practice it may take quite a while until new loans enter a securitised pool. I’ll mention one important example of this later.

Now let’s look at some interesting things we have learnt from this dataset.

1. Interest Rates

In the years prior to 2015, banks would generally advertise only one standard variable reference rate for housing loans.[5] There was no distinction, at least in advertised rates, between investors and owner-occupiers, or between principal-and-interest and interest-only loans. That changed when the banks responded to requirements by the Australian Prudential Regulation Authority (APRA) to tighten lending standards, with a particular focus on investor loans. Then, earlier this year, APRA and the Australian Securities and Investments Commission (ASIC) further tightened lending standards: this time the focus was on interest-only lending. A key concern has been that interest-only loans are potentially more risky than principal-and-interest loans. This is because with a principal-and-interest loan the borrower is required to regularly pay down the loan and build up equity. Also, interest-only borrowers can face a marked step-up in their required repayments once they come off the interest-only period (after the first few years of the loan term).

Among other things, the banks have responded to these regulatory actions by increasing interest rates on investor and interest-only loans. There are now four different advertised reference rates, one for each of the key types of loans (Graph 1). While the data in Graph 1 provide a useful guide to interest rate developments, they only cover advertised or reference rates for variable loans applicable to the major banks. Actual rates paid on outstanding loans differ from these for a few reasons. Borrowers are typically offered discounts on reference rates, which can vary according to the characteristics of the borrower and the loan. Discounts offered may vary across institutions, reflecting factors such as funding costs and market segmentation. (For example, non-bank lenders typically compete for different borrowers than the major banks.) The level of the discounts has also varied over time. Furthermore, there are fixed-rate loans, for which rates depend on the vintage of the loan.

Graph 1
Graph 1: Variable Reference Interest Rates


The Securitisation Dataset provides us with a timely and detailed source of information on the actual interest rates paid by households on their outstanding loans. Graph 2 shows rates paid on specific types of loans and by different types of borrowers.[6]

Graph 2
Graph 2: Outstanding Variable Interest Rates


The first thing to note is that rates on owner-occupier loans and investor loans used to be similar, but investor loans became relatively more expensive from the latter part of 2015. Again, this followed regulatory measures to impose a ‘benchmark’ on the pace of growth of investor credit, which had picked up noticeably.

The second development I’d draw your attention to is the variation in housing loan interest rates over time. There were declines in 2016 following the reduction in the cash rate when the Reserve Bank eased monetary policy in May and then August. More recently, rates have increased for investor loans and interest-only loans, with a premium built into the latter as lenders have responded to the tightening in prudential guidance earlier this year. As part of that guidance, lenders will be required to limit the share of new mortgages that are interest-only to 30 per cent. Meanwhile, interest rates on principal-and-interest loans to owner-occupiers are little changed and remain at very low levels. Pulling this all together, the average interest rate paid on all outstanding loans has increased since late last year, but only by about 10 basis points.

A third and subtle point relates to the differences in the level of interest rates actually paid on different loan products (Graph 2) when compared with reference rates (Graph 1). The reference rates suggest that any given borrower would expect to pay a higher rate on an interest-only loan than on a principal-and-interest loan. That makes sense for two reasons. First, because the principal is paid down in the case of principal-and-interest loans, those loans are likely to be less risky for the banks; other things equal, you would expect them to attract a lower interest rate. Second, the banks have added a premium to interest-only loans of late to encourage customers to take on principal-and-interest loans and constrain the growth of interest-only lending.

But Graph 2 (based on securitised loans) suggests that, up until most recently, actual rates paid on interest-only loans have been lower than those on principal-and-interest loans. This doesn’t necessarily imply a mispricing of risk. Rather, it appears to reflect differences in the nature of loans and borrowers across the two types of loan products. In particular, borrowers with an interest-only loan tend to have larger loan balances (of around $85 000–100 000) and higher incomes (of about $30 000–40 000 per annum).[7]

We can control for some of these differences between loan characteristics (such as loan size, loan-to-valuation ratio (LVR) and documentation type). When we do that, we find that rates have been much more similar across the two loan types in the past; although, a wedge has opened up more recently as we’d expect (Graph 3).

Graph 3
Graph 3: Outstanding Variable Interest Rates - selected loans


This highlights the value of examining loan-level data. We find that interest rates are lower for borrowers that are likely to pose less risk (as indicated, for example, by lower loan-to-value ratios and full documentation). Borrowers with larger loans – who typically have higher income levels – also tend to attract lower interest rates. In relation to loan size, this suggests that borrowers with larger loans may have somewhat greater bargaining power.

2. Loan-to-Valuation Ratios and Offset Balances

The Securitisation Dataset provides us with a measure of the LVR, based on the current loan balance.[8] We refer to this here as the ‘current LVR’. This is one indicator of the riskiness of a loan. Other things equal, higher LVRs tend to be associated with a greater risk of default (and greater loss for the lender in the case of default).[9]

Graph 4 shows current LVRs for owner-occupiers and investor loans, split into interest-only and principal-and-interest loans. I should emphasise again that the Securitisation Dataset may not be entirely representative of the set of all mortgages, particularly when it comes to LVRs. That is because high LVR loans may be less likely to be added to a pool of securitised assets in order to ensure that the securitisation achieves a sufficiently high credit rating.[10]

With that caveat in mind, we see that there is a large share of both owner-occupier and investor loans with current LVRs between 75 and 80 per cent. That is consistent with banks limiting the share of loans with LVRs (at origination) above 80 per cent. Also, borrowers have an incentive to avoid the cost of mortgage insurance, which is typically required for loans with LVRs (at origination) above 80 per cent.

Graph 4
Graph 4: Loan-to-Valuation Ratios - current


Comparing investor loans with owner-occupier loans, we can see that investors have a larger share of outstanding loans with current LVRs of 75 per cent or higher.[11] That’s most obvious in the case of interest-only loans, but is also true for principal-and-interest loans. This reflects the investor’s financial incentive to maximise the amount of funds borrowed (without breaching the banks’ threshold above which they require lenders mortgage insurance). That can be more easily achieved with an interest-only loan. And, even in the case of principal-and-interest loans, investors don’t have the same incentives as owner-occupiers to get ahead of their scheduled repayments.

But what I’ve just shown doesn’t account for offset accounts. These have grown rapidly over recent years and are now an important feature of the Australian mortgage market (Graph 5). Funds held in these accounts are ‘offset’ against the loan balance, reducing the interest payable on the loan. In that way they are similar to a principal repayment. But, unlike the scheduled principal repayment, offset (and redraw) balances can be moved in and out freely by the borrower.

Graph 5
Graph 5: Interest-Only and Offset Account Balances


Part of the strong growth in offset balances up to 2015 appears to have been related to the rise in the share of interest-only loans, with the two being offered as a package. Interestingly, we saw a significant slowing in growth in offset balances around the same time as growth in interest-only housing loans started to decline.

Graph 6 highlights how the distribution of current LVRs is altered if we deduct funds held in offset accounts from the balance owing. This suggests that for owner-occupier loans, interest-only borrowers are behaving somewhat like those with principal-and-interest loans. That is, many of those borrowers have built up significant balances in offset accounts. If needed in times of financial stress – such as a period of unemployment – borrowers could use those balances to service their mortgages.

Graph 6
Graph 6: Loan-to-Valuation Ratios


However, I would caution against any suggestion that this similarity regarding the build-up of financial buffers means that the tightening of lending standards for interest-only loans was not warranted – far from it. What matters when it comes to financial stability is not what the average borrowers are doing, but what the more marginal borrowers are doing. There are two important points to make on this issue.

First, for investor loans, even after accounting for offset balances, there is still a noticeable share of loans with current LVRs of between 75 and 80 per cent. And for both investor and owner-occupier loans, adjusting for offset balances leads to only a small change in the share of loans with current LVRs greater than 80 per cent. This suggests that borrowers with high current LVRs have limited repayment buffers.

The second point is that more marginal borrowers are now more likely to take on a principal-and-interest loan than in the past. One reason is that there is a premium on the interest rates charged on an interest-only loan (for any given borrower, compared with an owner-occupier loan). Another reason is that banks, at APRA’s direction, have also tightened their lending standards for interest-only loans, most notably by reducing the share of new interest-only loans with high LVRs at origination.[12]

3. Arrears by region

Banks’ non-performing housing loans have increased a little over recent years (Graph 7). However, at around ¾ of one per cent as a share of all housing loans, non-performing loans remain low and below the levels reached following the global financial crisis.

Graph 7
Graph 7: Banks' Non-performing Housing Loans


Using the Securitisation Dataset we can assess how loans are performing across different parts of the country by examining arrears rates. Like non-performing loans, the arrears rates have increased a little but remain low.[13] Arrears have risen more in regions experiencing weak economic conditions over recent years. In particular, there has been a more noticeable pick-up in arrears rates in Western Australia, South Australia and Queensland since late 2015 (Graph 8).

Graph 8
Graph 8: Mortgage Arrears Rates


The Securitisation Dataset allows us to drill down even further to examine some relationships between arears and other factors. A key factor contributing to a borrower entering into arrears is a reduction in income, most obviously via a period of unemployment. We find that there is a positive relationship between arrears rates and the unemployment rate across regions (Graph 9).[14] However, the relationship is not especially strong, which suggests that other factors are at play. For example, arrears rates are higher in mining-exposed regions, which have generally experienced a sharp fall in demand following the end of the mining investment boom. One indicator of that has been the pronounced fall in the demand for housing in those parts of the country as indicated by a decline in housing prices (Graph 10).

Graph 9
Graph 9: 90+ Days Arrears Rate by Region
Graph 10
Graph 10: Mining Regions' Median House Prices

Conclusion

The Securitisation Dataset plays a crucial role in allowing the Reserve Bank to accept asset-backed securities as collateral in our domestic market operations. The development of this database and its availability to investors has also helped to enhance the transparency of the securitisation market.

A useful additional benefit of this database is that it provides us with a range of timely insights into the market for housing loans. I’ve discussed how things like actual interest rates paid, loan balances and arrears vary over time and across different types of mortgages and borrowers. Although variable interest rates for investor loans and interest-only loans have risen noticeably over recent months, the average interest rate paid on all outstanding loans has increased by only about 10 basis points since late last year. Also, many borrowers on interest-only loans have built up sizeable offset balances. But even after taking those into account, it appears that current loan-to-valuation ratios still tend to be larger than in the case of principal-and-interest loans. Finally, while mortgage arrears rates have increased slightly over recent years, they have increased more noticeably in regions exposed to the downturn in commodity prices and mining investment.

Endnotes

I thank Michael Tran and Michelle Bergmann for invaluable assistance in preparing these remarks. [*]

For more detail, see Aylmer C (2016), ‘Towards a More Transparent Securitisation Market’, Address to Australian Securitisation Conference, Sydney, 22 November. [1]

I use the term banks here to refer to all authorised deposit-taking institutions (ADIs), namely banks, building societies and credit unions. [2]

The RBA provides a Committed Liquidity Facility (CLF) to participating ADIs required by APRA to maintain a liquidity coverage ratio (LCR) at or above 100 per cent. [3]

For more details, see reporting templates on the Securitisations Industry Forum website. The valuation is typically from the time of origination. [4]

An exception was a period during the 1990s, when banks advertised distinct rates for owner-occupier and investor loans. [5]

Modernised reporting forms that are collected by APRA on behalf of the RBA and the Australian Bureau of Statistics will significantly improve the aggregate and institution-level data that are currently collected from ADIs and registered financial corporations (RFCs). While the new data will have less granularity than the Securitisation Dataset, they will have much greater coverage. [6]

The figure for income is the average of all borrowers for each loan. That is, a given loan may be in the name of more than one borrower; on average, there are 1.7 borrowers per loan. [7]

The balance of a loan is reduced via scheduled repayments of the principal and by any repayments ahead of schedule. The latter may be accessible through a redraw facility. [8]

Read, Stewart and La Cava (2014), ‘Mortgage-related Financial Difficulties: Evidence from Australian Micro-level Data’, RBA Research Discussion Paper No 2014-13. [9]

Some analysis we have conducted on the representativeness of the Securitisation Dataset suggests that it has fewer high LVR loans than the broader population of loans. There is also a tendency to include loans in securitisation pools only after they have aged somewhat (i.e. become more ‘seasoned’). [10]

The share of new investor loans with very high LVRs (above 90 per cent) at the time of origination has been declining for a few years and is below that for owner-occupier loans (Reserve Bank of Australia (2017), Financial Stability Review, April). This feature is not apparent in the data I’ve shown here, which is based on the current LVR for the stock of outstanding securitised loans, including those that are well advanced in age. [11]

APRA have instructed lenders to implement stricter underwriting standards for interest-only loans with LVRs greater than 80 per cent (see: <http://www.apra.gov.au/MediaReleases/Pages/17_11.aspx>). [12]

The 90+ days arrears rate refers to the share of loans that have been behind the required payment schedule or missed payments for 90 days or more but not yet foreclosed. [13]

These regions are defined in terms of the ABS’s Statistical Areas Level 4 (SA4s), which are geographic boundaries defined for the Labour Force Survey. The boundaries for most SA4s cover at least 100 000 persons. The Securitisation Dataset identifies loans according to the location of the mortgaged property.