AMP reported their 1H17 results today. Underlying profit was A$533 million in 1H 17, up 4 per cent (1H 16: A$513 million), and net profit of A$445 million (1H 16: A$523 million).
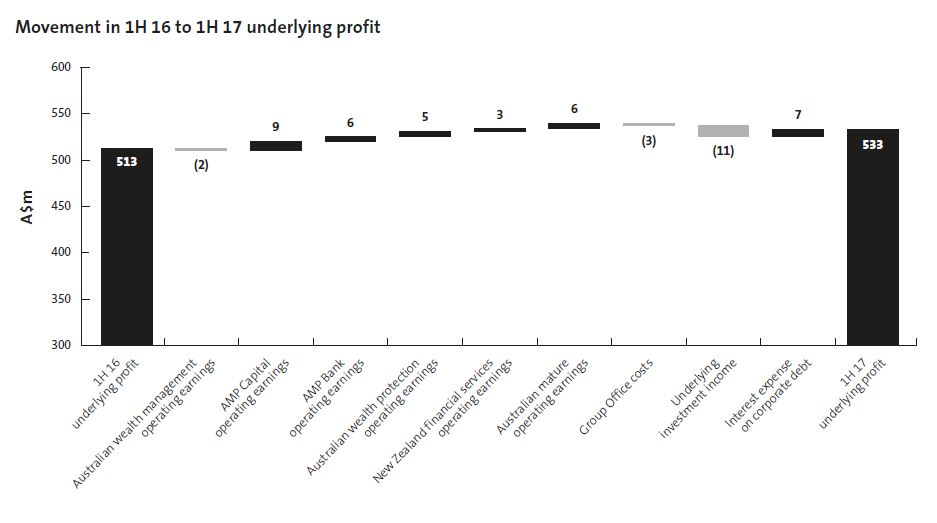 The results reflect strong operating earnings growth from AMP Capital (+11%), AMP Bank (+10%) and New Zealand financial services (+5%).
Australian wealth protection earnings increased by 11% on 1H 16, reflective of the steps taken to stabilise the business in 2H 16. Australian wealth management earnings declined 1% from 1H 16, largely due to margin compression from MySuper transitions and a reset of the investment management agreement with AMP Capital.
Underlying investment income decreased A$11m to A$50m from 1H 16, due to lower shareholder capital resources and a 50 bp reduction in the assumed underlying after-tax rate of return.
Australian wealth management 1H 17 net cashflows were A$1,023m, up 76% from 1H 16. AMP’s retail and corporate super platform net cashflows were positively impacted by recent changes to superannuation contribution limits and large mandate wins.
AMP Capital external net cash inflows were A$2,439m, up from net outflows of A$153m in 1H 16. Inflows were driven by strong flows into fixed income and real asset (infrastructure and real estate) capabilities.
Underlying return on equity rose 2.6 percentage points to 14.5% in 1H 17 from 1H 16, largely reflecting the impact of capital management programs.
Completion of reinsurance program delivers on strategy, with new arrangements to release approximately A$500 million of capital from AMP Life (subject to regulatory approval) further reducing the capital intensity of the wealth protection business.
Sustained cost management on track to deliver 3 per cent reduction in controllable costs (ex AMP Capital) by FY 17.
Strong capital position with A$1.9 billion over minimum regulatory requirements. Interim dividend increased to 14.5 cents a share, franked to 90 per cent.
Wealth protection: reinsurance update
AMP today announced a series of new reinsurance agreements, delivering on its strategy to release capital from the Australian wealth protection business and reduce future earnings volatility. Releasing approximately A$500 million in capital from AMP Life (subject to regulatory approval), the new reinsurance agreements include:
A new quota share agreement with General Reinsurance Life Australia Limited (Gen Re) to cover 60 per cent of the NMLA retail portfolio, which was merged with AMP Life on 1 January 2017.
An extension to the existing agreement with Munich Reinsurance Company of Australasia Limited (Munich Re) to cover 60 per cent (up from 50 per cent) of the AMP Life retail portfolio.
A new surplus cover agreement with Gen Re to assist in managing risk and volatility in individual retail claims.
Recapture of 35 existing reinsurance treaties, simplifying AMP’s overall reinsurance arrangements.
The new reinsurance agreements will commence on 1 November 2017 and, when combined with the first tranche of reinsurance completed in 2016, effectively means 65 per cent of AMP’s retail life insurance portfolio will be reinsured for claims incurred from 1 November 2017.
Australian wealth management
Australian wealth management operating earnings, down 1 per cent to A$193 million, were resilient. The result demonstrates effective margin management during the final transitions to low-cost MySuper funds and amid significant activity across the superannuation industry. MySuper transitions completed in 1H 17 with margin compression expected to continue to be around 5 per cent this year.
Net cashflows were significantly higher in 1H 17, with stronger inflows from discretionary super contributions ahead of 1 July changes to non-concessional caps. The transition of corporate super mandates also supported inflows, with one mandate bringing more than 3,700 new customers to AMP. During the period, AMP paid A$1.3 billion in pensions to help customers through their retirement.
AMP’s flagship North platform performed well in 1H 17, with flows up 8 per cent and AUM up 13 per cent on FY 16. North now has more than A$30 billion in assets under management.
To offset the impact of margin compression, AMP is targeting additional revenue growth from its Advice and SMSF businesses, which is reported in the Other revenue line. AMP expects Other revenue to increase by 10 per cent in FY 17, with growth in Advice and SMSF revenues emerging in 2H 17 and accelerating into 2018. This will support the delivery of AMP’s target of 5 per cent overall revenue growth in Australian wealth management through the cycle.
AMP Capital
AMP Capital delivered strong growth in operating earnings, up 11 per cent to A$92 million, benefiting from good growth in fee income. External assets under management fees rose by 6 per cent to A$132 million and non-AUM based management fees also increased, benefiting from growth in real estate development fee revenue.
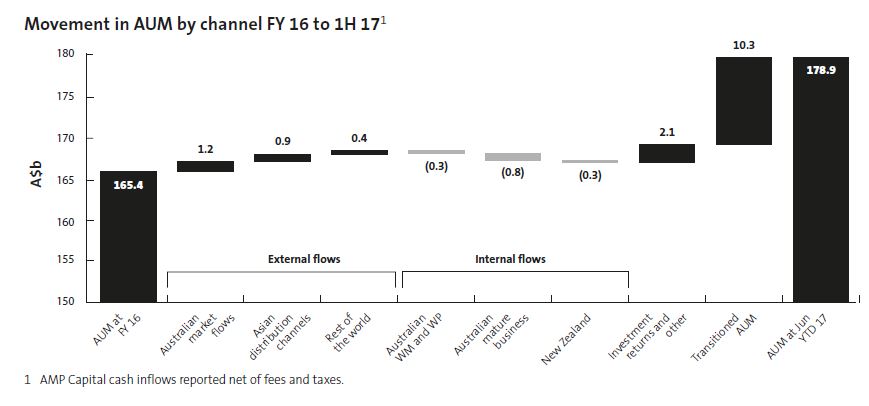 External net cashflows increased to A$2.4 billion, with significant cash inflows into fixed income and higher-margin real assets. Real assets proved popular with investors wanting exposure to leading infrastructure and real estate investments.
Delivering on its strategy to expand internationally, AMP Capital grew its number of direct international institutional clients from 199 at FY 16 to 252 in 1H 17 and now manages A$10 billion in assets on their behalf. In China, AMP Capital’s asset management joint venture, China Life AMP Asset Management (CLAMP), continues to grow rapidly with AUM increasing 22 per cent to RMB 141 billion (A$27.1 billion) in 1H 17. Total AUM for China Life Pension Company, the pensions joint venture in which AMP owns a 19.99 per cent stake, grew 8 per cent to RMB 408.2 billion (A$78.5 billion) in 1H 17.
At 30 June 2017, AMP Capital had A$3.5 billion of committed funds available for investment including funds raised in its Infrastructure Debt Fund III (IDFIII), which has attracted strong international interest.
AMP Bank
Strong growth momentum continued in AMP Bank, with operating earnings up 10 per cent to A$65 million, driven by 17 per cent growth in lending to A$18.8 billion.
AMP Bank delivered residential mortgage book growth of A$1.7b in 1H 17 to A$18.2b (an increase of 18% from 1H 16 and 10% from 2H 16), driven by strong growth in owner occupied lending. Growth in AMP Bank’s investment property and interest only lending segments was constrained, in response to regulatory requirements. They expect this trend to continue in 2H 17.
Above system loan growth was delivered through both the broker and AMP aligned adviser channels. Sales through the AMP aligned channel in 1H 17 were up 49% on 1H 16.
The cost to income ratio rose slightly to 29 per cent, with controllable costs increasing by A$4 million reflecting ongoing investment to support growth. Lending growth in the bank is expected to moderate in the second half as the market adjusts to new regulatory requirements.
Net interest margin declined 4 basis points from 1H 16 but improved 4 basis points on 2H 16.
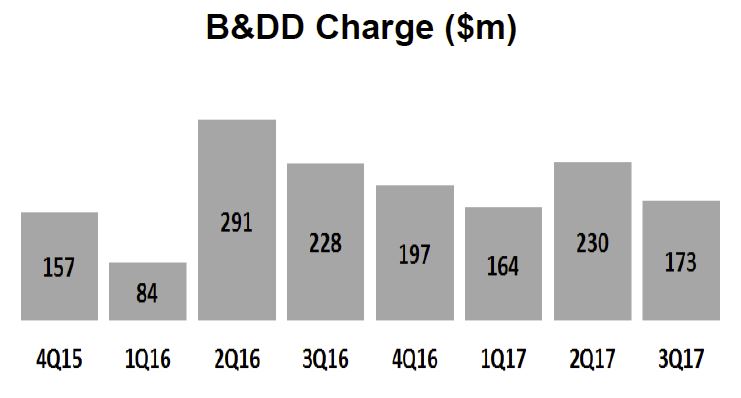
Asset quality remains strong, with mortgages in arrears (90+ days) at 0.48% as at June 2017. Loan impairment expense to average gross loans and advances was 0.02% in 1H 17, reflecting the conservative underwriting standards
Australian wealth protection
Actions undertaken in 2016 to stabilise and reset the business are working and have delivered an improved result. Operating earnings rose 11 per cent, with improved experience offsetting lower profit margins.
The announcement of further reinsurance agreements, completing the strategic reinsurance program, lessens exposure to retail claims volatility and will further stabilise wealth protection earnings. AMP continued to support customers during their time of need, paying A$575 million in claims during the six months to 30 June.
New Zealand financial services
Operating earnings, up 5 per cent to A$65 million, reflect higher experience profits. AUM increased 6.9 per cent to A$15.5 billion on positive markets.
A strong focus on cost management supported a reduction in controllable costs by 3 per cent to A$38 million and improved the cost to income ratio by 1.4 percentage points to 27.2 per cent.
Australian mature
Operating earnings are up A$6 million from 1H 16 to A$75 million due to strong markets, lower controllable costs and improved experience.
Capital and dividend
AMP’s capital position remains strong, with level 3 eligible capital resources A$1,887 million above minimum regulatory requirements at 30 June 2017, down from A$2,195 million at 31 December 2016.
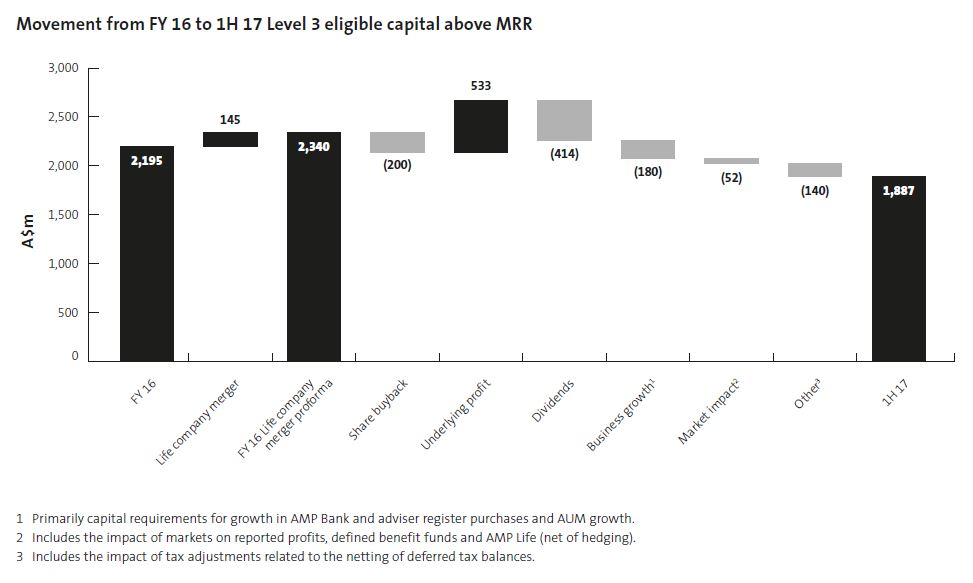 The reduction largely reflects capital returned to shareholders through an on-market share buy back and investment in business growth during the period. The new reinsurance agreements are expected to release up to an additional A$500 million from AMP Life (subject to regulatory approval).
The interim dividend has been increased to 14.5 cents per share, franked at 90 per cent. The 1H 17 dividend payout is within AMP’s stated target range of 70 to 90 per cent of underlying profit

 The ratio of 90+ days past due (DPD) and gross impaired assets (GIAs) to gross loans and advances (GLAs) of 0.80% declined 5 basis points (bps) from March 2017 mainly reflecting improved conditions for New Zealand dairy customers.
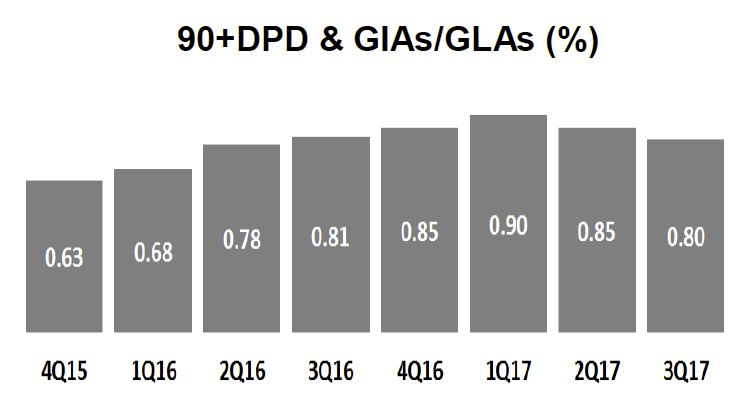 The Group Common Equity Tier 1 (CET1) ratio of 9.7%, compared to 10.1% at March 2017 mainly reflecting the impact of the interim 2017 dividend declaration and 17 bps for higher risk weights due to previously advised mortgage model changes.
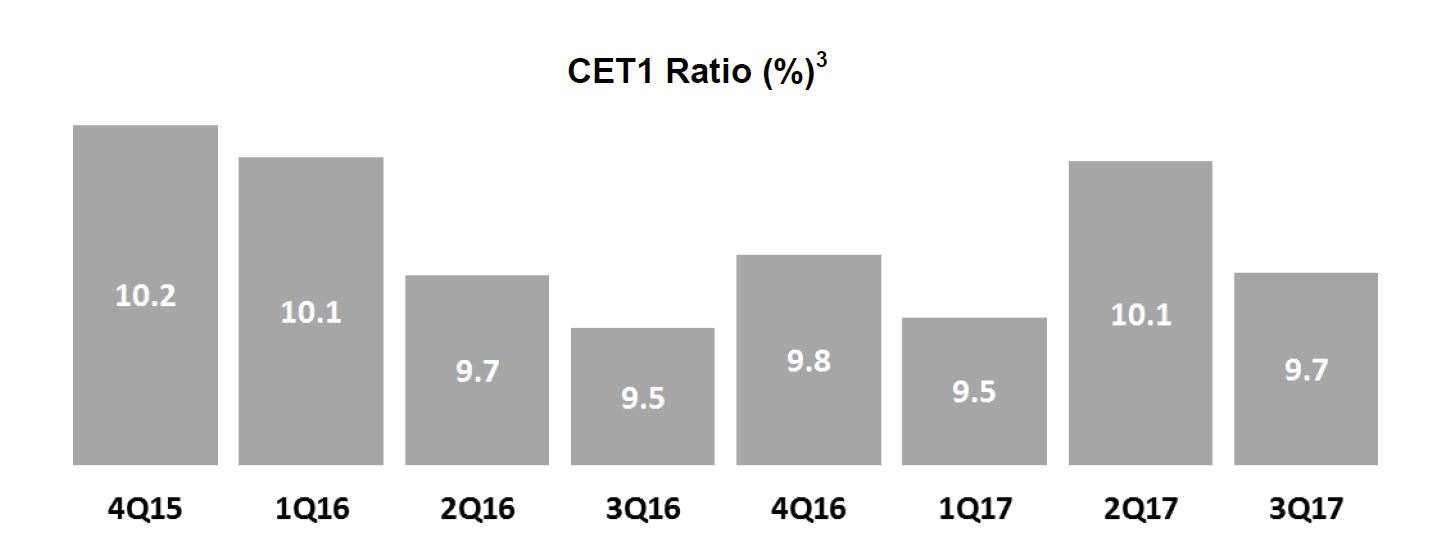 The Leverage ratio was 5.3% (APRA basis), the Liquidity coverage ratio (LCR) quarterly average was 127% and the Net Stable Funding Ratio (NSFR) was 108%.