Rental Stress is growing, and more property investors are underwater when it comes to covering their mortgage costs on an ongoing basis, so what are the implications for property investment as mortgage rates continue to rise? Welcome to the Property Imperative Weekly to 29th July 2017.
We start with our research on property investment, which was published this week. We look at this from two perspectives, first from the point of view of those renting, and second, from the perspective of those who are property investors.
Whilst there is considerable discussion about mortgage stress, rental distress hardly gets a mention yet there are more households in rental stress than in mortgage stress according to our analysis. We know their financial confidence on average is lower. First, we need to define rental stress. Whilst some will use a “30% of income to pay the rent” as a benchmark, we do not think it is an adequate measure – 30% is too arbitrary!

So we look at net cash flow. If households, once they pay their rent, tax and other outgoings have close to nothing left, or a small deficit, at the end of the month, they fall into our mild stressed category. Those with a severe cash deficit at the end of the month, are in severe stress.
We start by looking at the causes of rental stress. Using data from our surveys, we find that costs of living, under employment and flat incomes are the main causes.
More than half of renters in NSW are in rental stress (on our definition), and the highest proportion of any state here are in severe rental stress. The proportion of households in stress fades away as we look across the other states and territories. But the three most populous states have the highest rental stress levels.
Looking across our segments, we see that older households are more under stress, and a significant proportion are in severe stress. Whilst wealthy seniors may hold some savings, stressed seniors do not. Many are reliant on Government support.
Greater Sydney and the Central Coast have the highest representation of stressed renters as a proportion of all households renting.
Looking across our geographic zones (a series of concentric rings around our main urban hubs) we see significant levels of stress in the urban centres, as well as on the urban fringe. The former is being created by high rents – especially in the newly constructed high-rise blocks being thrown up across the eastern states, often occupied by young affluent households; whilst in the urban fringe, it is more about depressed incomes. We see stress rolling out into the regions, but is less apparent in the more rural and remote areas.
All this highlights the issues renters have due to the combination of flat incomes, and rising costs, despite only small rises in rents.
Now, if we look at the other side of the coin, our research shows more investors have a net cash-flow problem, thanks to that flat rental income, whilst mortgage rates continue to rise.
The CPI data released this week by the ABS showed that overall inflation remains low.
But within the series there is a striking contrast. The Housing Group category of data rose 0.3 per cent for the quarter, and 2.4 per cent for the year to June 2017 but rent rose only 0.2 per cent for the quarter, and 0.6 per cent for the year.
It is worth reflecting on this in the light of the out of cycle rate hikes which property investors are experiencing, as the banks improve their margins using the alibi of regulatory tightening. In fact recent hikes being applied not just to new mortgages but to the entire book deliver a significant “bonus” to the banks.
First, let’s be clear rental rates have more to do with income that property prices, and the fact that rental rates have hardly grown reflects the stagnation in wages. Vacancy rates are also rising.
Second, the fact is a greater proportion of property investors are now underwater on a net rental cash flow basis. But the situation varies by state. VIC and NSW have on average negative net returns. The net rental calculation is before any tax offsets.
Investors seem ok with negative cash-flow returns because in many cases they just offset the losses against tax, and comfort themselves with the thought that the capital value of the property is still rising (in most eastern states at least).
However, the divergent movement of mortgage rates and net rental returns are a leading indicator of trouble ahead, especially if capital growth reverses.
Given flat incomes, we think rentals will not grow much at all for some time, and remember more new properties are coming on stream, so vacancy rates are likely to continue to rise!
So in summary, we think more rental property will be vacant so holding rentals low (despite being expensive for many potential tenants) whilst investment costs will go on rising. As a result, we expect to see weaker demand for investment property, and should capital values start to fall, more owners will try and sell. In fact we think many property investors are in for a rude awaking, sufficient to tip the overall market lower, despite recent quite strong auction clearances.
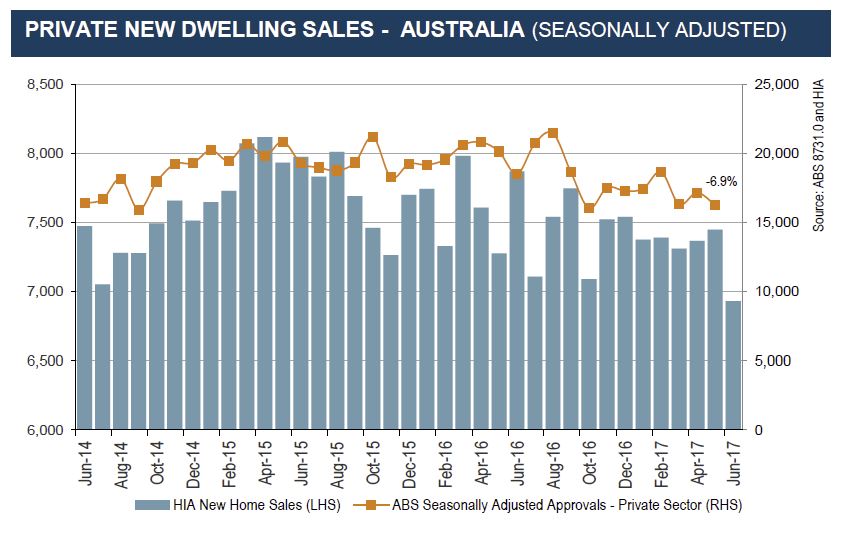
More broadly the HIA reported that housing affordability declined further in the past quarter, largely due to a rise in the median dwelling price of 9.1% per cent to a record high of $540,200. They say, NSW was the most significant negative influence on this result with affordability in Sydney now declining past a critical level (Sydney, – 0.7% and the rest of NSW, – 2.2 per cent). Acquiring and servicing a mortgage on a house in Sydney now requires more than two standard Sydney incomes. Sydney is the only market to have achieved this outcome in the 15-year history of their report. Affordability in Melbourne improved marginally in the quarter but remains 6.0 per cent less affordable than this time last year. Of the capitals where affordability worsened, the biggest deterioration was in Perth (-1.3 per cent).
Despite the fact the US Federal Reserve held their cash rate this week, signalling a slower rise in interest rates in America, Westpac lifted a range of their fixed term investor loans, with for example their 2-year fixed rising 31 basis points. Bank West said they would impose a 25 basis point increase for interest-only investor home loans; and a 35 basis points increase for interest-only owner-occupier home loans. They did offer small reductions to some owner occupied principal and interest borrowers. We are seeing a small flurry of rate cuts for some new borrowers ANZ for example is offering a 31 basis point drop for new two-year fixed residential investment loan for customers paying principal and interest (P&I), falling from 4.34 per cent per annum (p.a.) to 4.03 per cent p.a.
The round of mortgage rate repricing which we have been tracking for the past few weeks, with investor loan portfolios being strongly repriced, and owner occupied loans less impacted, has created a significant well of opportunity for banks to selectively offer attractor rates to principal and interest borrowers. In addition, funding costs are now lower, and the yield curve is less strongly indicating future increases, thanks to changes in the US financial markets and news that the ECB will continue its bond buying programme. But many existing borrowers are saddled with higher rates. We expect to see a flurry of selective, targetted offers, aimed at acquiring new business and supporting loan portfolio growth.
Wages growth in Australia will remain muted for some time to come yet and RBA Governor Philip Lowe said that if some of the long standing links between income growth and monetary policy are not working as they did, more monetary stimulus may encourage investors to borrow to buy assets, which poses a medium-term risk to financial stability. In comments after the speech, he also made the point that surging asset prices has led to a growth in inequality across Australia.
We think the policy chickens are coming home to roost. We have seen a significant decline in home ownership in recent years, from 69.5 per cent in 2002, to 67 per cent at the 2011 census, and to 65.5 per cent last year. This is a direct result of RBA policy, and the household debt bubble, which has pumped property prices way too high.
As a result, many younger Australians are being forced to rent, or take out very large mortgages. This debt burden will suck up much of their disposable income for the next 20-30 years, and will leave them exposed to future rate hikes. In a low interest rate environment, the capital owed does not depreciate as fast, so the burden is longer and heavier. This has a knock-on effect on their ability to save for retirement, so their entire life may well be debt laden.
On the other hand, households holding property have enjoyed significant paper gains. Whether they keep them will be determined by future property prices, but there are more reasons to think prices will fall than rise.
A generation of poor myopic property driven policy will have significant negative long-term impact on the economy and lays at the heart of the inequality across the country, which was subject to much discussion this week. Prices may not drop much in the short term, but we believe they will correct eventually. The longer that takes, the bigger the fall ultimately will be.
And that’s the Property Imperative Week to 29th July 2017. Do subscribe to get our latest updates, and check back again next week. Thanks for watching.

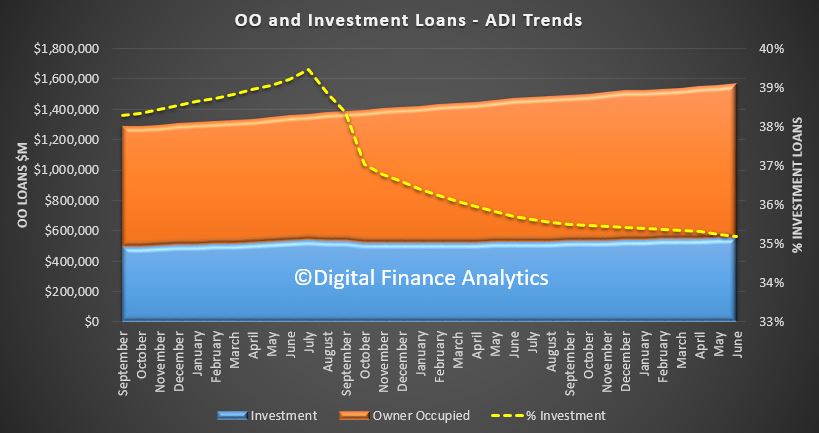
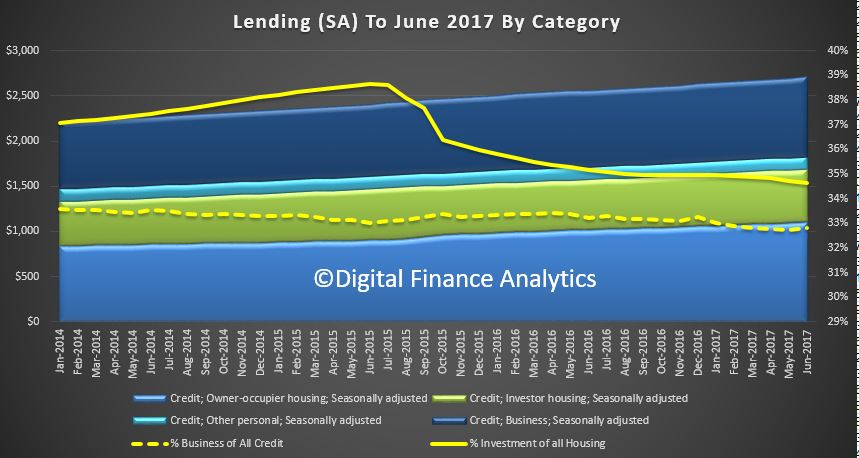 Investor home lending grew 0.5% or $3.13 billion, but this was adjusted down in the seasonal adjusted series to 0.2% or $1.13 billion. Owner occupied lending rose 0.9% or $9.83 billion in original terms, or 0.7% or $7.34 billion in adjusted terms. Business lending rose 1.2% of $11 billion in original terms or 0.9% of $7.61 billion in original terms. The chart below compares the relative movements.
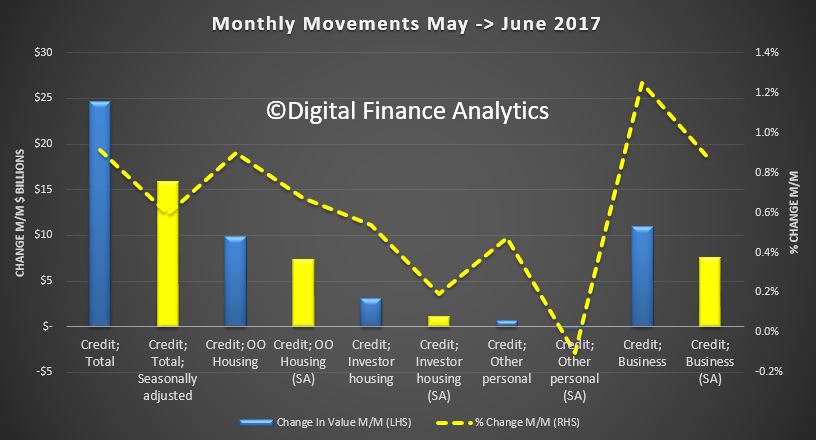 The RBA says:
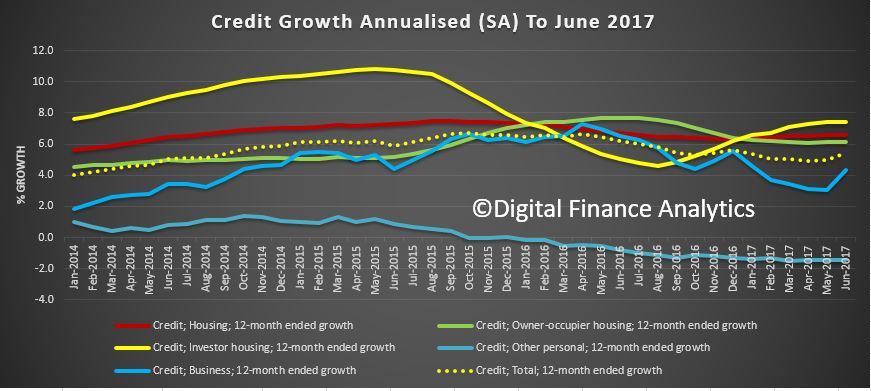 The more volatile monthly series show investor loans a little lower, while owner occupied loans rise further, and there is a large inflection in business lending.
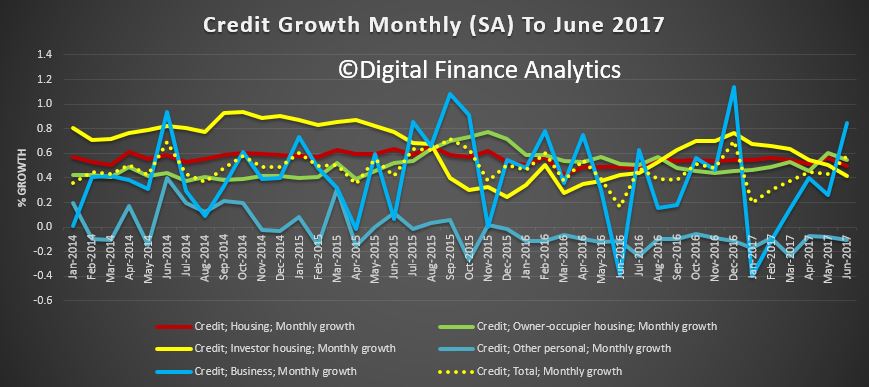 We need to note that now $55 billion of loans have been reclassified between owner occupied and lending over the past year – with $1.3 billion switched in June. This is a worrying continued trend and raises more questions about the quality of the data presented by the RBA.