Housing Affordability Declines Further

HIA’s Affordability Index shows Housing affordability in Australia continued to decline in the June quarter this year. This is largely due to a rise in the median dwelling price of 9.1% per cent to a record high of $540,200.

The HIA Affordability Index is produced quarterly and uses a range of data to including wages, house prices and borrowing costs to provide an indication of the affordability of housing. A higher index result signifies a more favourable affordability outcome.

The growth in house prices in the quarter outstripped the growth in wages resulting in the deterioration in affordability. As a consequence of these factors the Affordability index for Australia dropped by 0.3 per cent in the June 2017 quarter.

NSW was the most significant negative influence on this result with affordability in Sydney now declining past a critical level (Sydney, – 0.7% and the rest of NSW, – 2.2 per cent). Acquiring and servicing a mortgage on a house in Sydney now requires more than two standard Sydney incomes. Sydney is the only market to have achieved this outcome in the 15 year history of this report.

Affordability in Melbourne improved marginally in the quarter but remains 6.0 per cent less affordable than this time last year.

On the positive side, during the June 2017 quarter, affordability improved in six of the eight capital cities. The largest improvement occurred in Darwin (+4.3 per cent), followed by Adelaide (+2.9 per cent), Hobart (+1.6 per cent), Brisbane (+1.0 per cent), Canberra (+0.8 per cent) and Melbourne (+0.8 per cent).

Of the capitals where affordability worsened, the biggest deterioration was in Perth (-1.3 per cent) and Sydney (-0.7 per cent). The Perth deterioration in affordability appears to contradict the soft conditions in that market but the fall in average wages in Perth in the quarter outweighed the positive impact on affordability from the falls in home prices.

Rental Stress, The Hidden Problem

There is much discussion of mortgage stress, some of which we highlight by our ongoing research into the growing numbers of households under financial pressure. The results for July will be out soon.

But rental stress is less discussed, but in our mind is equally significant, so today we explore some of the data in our Core Market Model to July 17. In fact there are more households in rental stress than in mortgage stress according to our analysis. We know their financial confidence on average is lower.

First, we need to define rental stress. Whilst some will use a “30% of income to pay the rent” as a benchmark, we do not think it is an adequate measure – not least because we see large numbers of households renting where more than 30% of income is paid away on rent, yet they are not in financial difficulty. Others pay less away, but are in stress. 30% is too arbitrary!

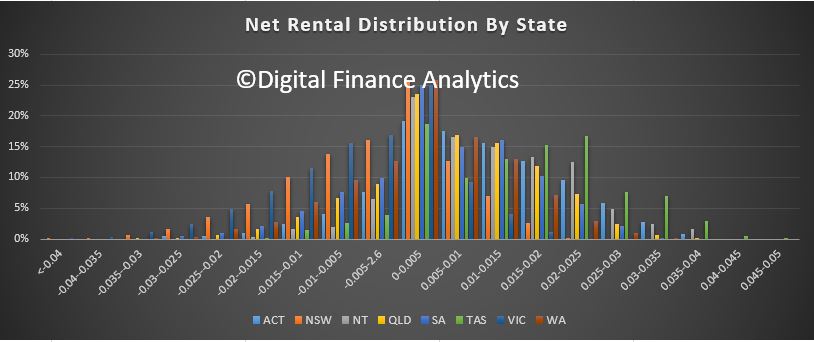
So we look at net cash flow. If households, once they pay their rent, tax and other outgoings have close to nothing left, or a small deficit, at the end of the month, they fall into our mild stressed category. Those with a severe cash deficit at the end of the month, are in serve stress.

We start by looking at the causes of rental stress. Using data from our surveys, we find that costs of living, under employment and flat incomes are the main causes of rental stress.

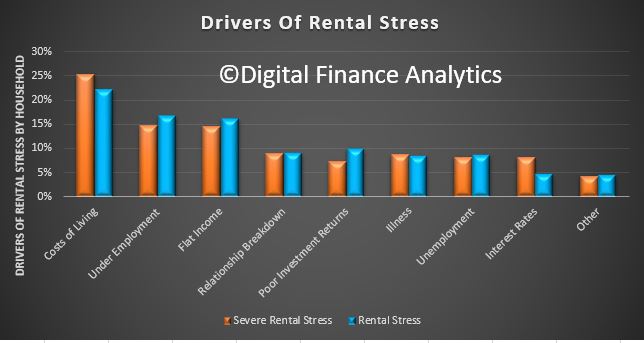
Those renting tend to hold less financial assets, so are more exposed, especially where they are also responsible for bills (electricity, council rates etc). Those in difficulty will be more likely to hold multiple credit cards, and also access short term loans to get by. Those in the stressed categories will be less likely to spend at the shops, and so are a brake on economic activity.  One strategy some use is to move to cheaper rented accommodation, with poorer facilities to reduce outgoings. The migratory nature of renters, especially those in stress are not well understood. The current tenancy regulations in Australia are pretty weak. Much of this movement is not reported, nor recorded.

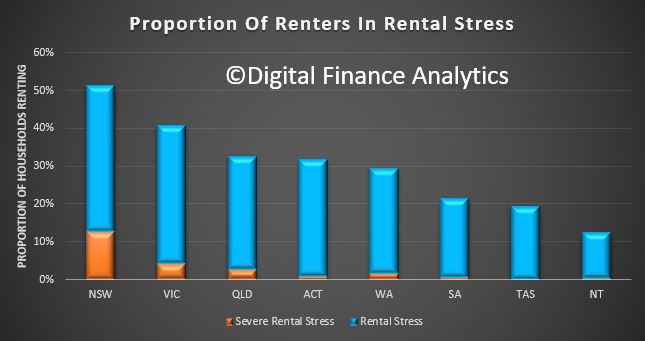
So, lets look at some of the numbers, remembering one third of households are renting, in round numbers that is 3 million households.

Looking by state, more than half of renters in NSW are in rental stress (on our definition), and the highest proportion of any state here are in severe rental stress. The proportion of households in stress fades away as we look across the other states and territories. But the three most populous states have the highest rental stress levels.

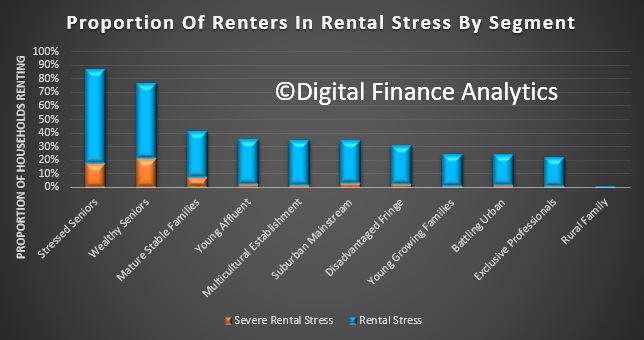
Looking across our segments, we see that older households are more under stress, and a significant proportion in severe stress.  Whilst wealthy seniors may hold some savings, stressed seniors do not. Many are reliant on Government support.

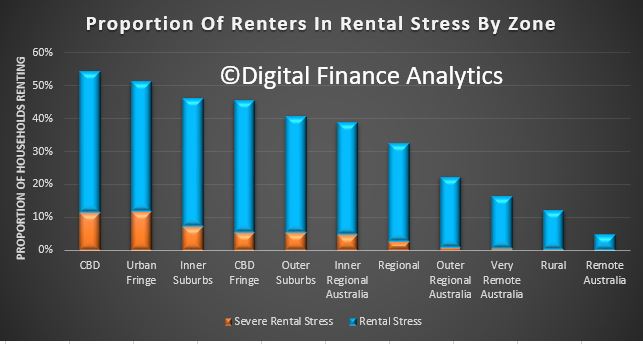
Looking across the geographic zones (a series of concentric rings around our main urban hubs) we see significant levels of stress in the urban centres, as well as on the urban fringe. The former is being created by high rents – especially in the newly constructed high-rise blocks being thrown up across the eastern states, often occupied by young affluent households; whilst in the urban fringe, it is more about depressed incomes. We see stress rolling out into the regions, but is less apparent in the more rural and remote areas.

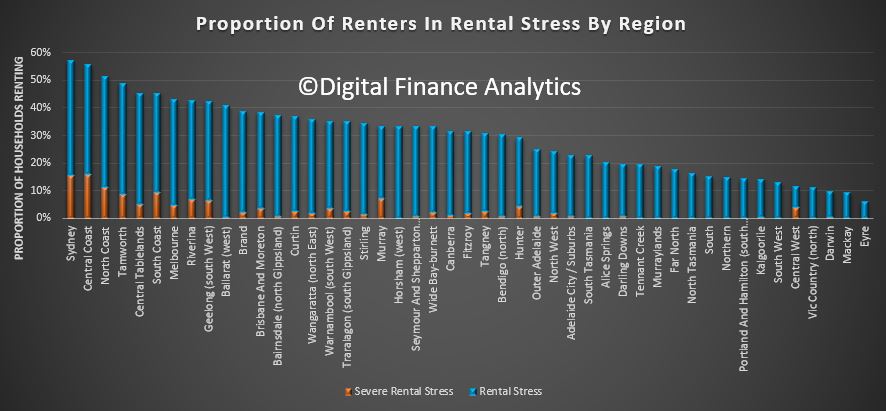
Finally, here is list of the regions across the country. Greater Sydney and the Central Coast have the highest representation of stressed renters as a proportion of all households renting.

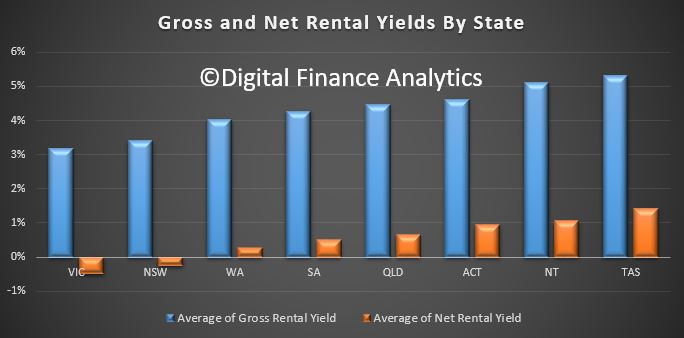
All this highlights the issues we have due to the combination of flat incomes, and rising costs. It is also the obverse of the picture we revealed yesterday, where we showed rental growth is very low (causing more investors to have a net cash-flow problem).

Once again we see the outworking of poor public policy over a generation. With an internationally high proportion of property investors and a high proportion of people who are likely to never own their own property, rental stress provides another important perspective of the issues we face.

We have very granular data, down to post code, but that will get too detailed for this post.
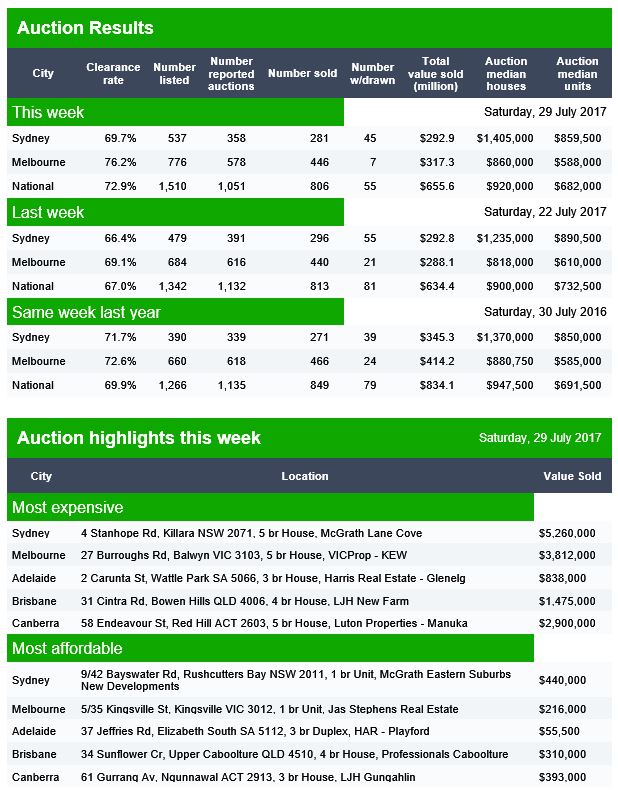
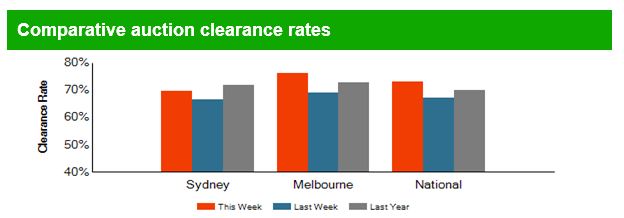


Suncorp Lifts Fixed Investor Loan Rates

Suncorp has lifted rates on new and in flight fixed investment home loan offers effective today, impacting Home Package Plus Fixed, Standard Fixed and Annual Interest in Advance Loans (AIIA) interest rates.

They say this is to “ensure the bank remains compliant with regulatory caps on investor and interest only lending.”


New Factors Play Into Central Bank Forecasting

An external central banking expert has commended the New Zealand Reserve Bank’s forecasting and monetary policy decision -making processes. However, two areas are recommended for further analysis. The first is what the changing labour market under heavy immigration means for non-tradable inflation.  The second is what the ‘new normal’ for monetary policy after years of very low interest rates means for future monetary policy.  The impact of interest rate increases on the financial industry and on the real economy may be quite different than in the past.

As part of good practice peer review, the Bank regularly commissions reviews by external experts of its forecasting and monetary policy decision-making processes.  It has modified its processes over the years in light of their findings.

Dr Philip Turner, former Deputy Head of the Monetary and Economic Department and a member of Senior Management of the Bank for International Settlements (BIS), was requested to attend the February 2017 forecasting round, report on his assessment of the process, and make recommendations where relevant.

Dr Turner comments that, in seeking to “avoid unnecessary instability in output, interest rates and the exchange rate”, the Bank’s mandate is realistic about what monetary policy can achieve.

“This mandate would not have been fulfilled in recent years, given the large shocks to international prices, by trying to keep the year-on-year inflation rate in New Zealand at close to 2 percent.  To have achieved this, interest rates would have had to move by more than they have in recent years, and this would have created the unnecessary instability in output and the exchange rate that the RBNZ is enjoined to avoid.”

Dr Turner says it was clear that the Bank’s Monetary Policy Committee, which advises the Governing Committee on the monetary policy decision, has in its sights key questions about what might be called the ‘new normal’ for monetary policy.

These include the lower natural or neutral rate of interest; the increased responsiveness of aggregate demand to any change in interest rates; and how macro-prudential policies will affect monetary policy.

He says that the Bank’s open working-level culture of challenging views or arguments in a constructive and professional way enables the Bank to avoid ‘policy blind spots’.

“The whole forecast round has been engineered to bring to bear a full range of economic analyses and to ensure an open and comprehensive debate.”

Dr Turner recommended further work on two topics.

“Both are on the radar screens of RBNZ economists. The first is what the changing labour market under heavy immigration means for non-tradable inflation.  The second is what the ‘new normal’ for monetary policy after years of very low interest rates means for future monetary policy.  The impact of interest rate increases on the financial industry and on the real economy may be quite different than in the past.”

Dr Turner concludes: “Results over the past few years speak for themselves.  The RBNZ has helped steer its economy through several large external shocks.  Because it has done so without becoming trapped at a zero policy rate and without multiplying the size of its balance sheet by buying domestic assets, it has retained more room to pursue, if needed, a more expansionary monetary policy than is available at present to many central banks of other advanced economies.”

Broker commissions pushing rates up: UBS

From Australian Broker.

The rising costs of broker commissions are pushing mortgage rates up by 16 basis points per year for every Australian’s mortgage, according to a top banking analyst.

Jonathan Mott from UBS said that a “blow-out” in commissions, which exceeded $2.4bn in 2015 (increasing 18% from $1.46bn in 2012), was linked to higher rates for mortgage holders across the country.

“Although commissions are deducted from NIM (not expensed) this is equivalent to 23% of the cost of running the Major Banks’ entire Personal and Consumer Banking operations,” he said in an Australian banking sector update entitled ‘Are Mortgage Brokers Overpaid?

“Average commissions are now $4,600 per mortgage, which we believe is disproportionate for advice provided on a simple, commoditised, single product, particularly when compared to the fees charged by Financial Advisors for ‘simple’ financial advice ($200 to $700).”

The above figure for total commissions per mortgage was likely to be understated, Mott added, since it took the total commission revenue divided by the mortgages written in that year. This failed to take into account that trail commissions were earned from mortgages earned in prior years over a smaller number base, which means the average commission earned over the life of a loan is likely to be even higher.

“Although mortgage broker commissions are paid by the bank not the customer, commissions are factored into the bank’s cost of funding and have been a driving factor in mortgage repricing in recent years. At the end of the day, these costs are born by all mortgage customers.”

Mott acknowledged that many customers valued the services of a mortgage broker but questioned the trade-off between the value received versus the cost of service.

“While a mortgage is a large financial commitment, it is a simple, commoditised product. Options are relatively limited (fixed vs variable, interest only vs principal & interest, offset account) while APRA’s focus on ‘sound lending practices’ ensures there should be little difference in underwriting standards or size of loan offered across the banks.”

He said he expected the banks to negotiate “materially lower fee-for-service mortgage commissions” in the near future to comply with both the ASIC and Sedgwick reviews. He recognised that brokers would likely be unhappy with this outcome but said there was little they could do.

“If mortgage brokers refuse to deal with one or more of the banks on the basis that its commission rates are too low, this will reinforce the inherent conflict of interest highlighted by ASIC (lender choice conflict).

“Additionally, if the mortgage broking industry chooses to channel more flow away from one or more major bank, the other banks would not have capacity to absorb this flow without breaching their APRA caps (investment property loan growth must be comfortably below 10%).”

Mott also said that advice for a commoditised, single product such as a mortgage could be easily provided by robo-advice.

Double digit returns ‘not sustainable’: AusSuper

From InvestorDaily.

Super funds will not be able to sustain the relatively high returns members have enjoyed in recent years, warns AustralianSuper chief executive Ian Silk.

Speaking at a Thompson Reuters event on Thursday, Mr Silk said that superannuation funds had experienced “stellar performance” this year but that this would not continue for long.

“One of the challenges for all super funds, including AustralianSuper, is to convince members that double-digit returns in … the global economic environment that we have, are not sustainable,” Mr Silk said.

While AustralianSuper had delivered “quite fantastic results” this year, Mr Silk outlined a number of factors surrounding the slowdown of growth.

“We’ve got inflation at 2 per cent, we’ve got sluggish growth, we’ve got no real wage growth, record low interest rates – these returns are just not sustainable,” he said.

AustralianSuper’s ability to deliver results has been “on the back of equity markets that are rising very strongly”, Mr Silk said.

But the “very important” and “frankly obvious message” he wanted to convey was that “real returns of that dimension are just not sustainable”.

Covering a number of other issues in the event, Mr Silk also vocalised his support of one of APRA’s new responsibilities announced earlier this week that granted APRA powers to act on poor-performing funds.

“To my mind, that’s an unambiguously good thing,” he said.

“Doesn’t matter what sector they’re in – if you’ve got poor-performing funds, in an industry that’s characterised by compulsion and not particularly well-informed members, then it behoves the regulator to act on the poor-performing funds and get them out of the industry.”

Why the trend to use cards instead of cash should be a big worry

From The New Daily.

The revelation that Australian consumers are using card payments more often than cash is a worry because of a lack of fee transparency, an expert has warned.

The Reserve Bank of Australia reported this week that 52 per cent of all transactions are card payments, with only 37 per cent by cash.

Three years ago, cash was 47 per cent and card only 43 per cent.

Cash payments were most common for fast food, cafes, restaurants, bars and pubs, and least common for holidays and household bills. And the biggest users were Australians aged 50 to 65, and those in the bottom half of the income bracket.

Professor Rodney Maddock, a researcher at the Australian Centre for Financial Studies, said the transition to cards is premature because the current system is “wasteful” and “a mess” compared to cash.

“Most people have got no idea of the true cost they’re incurring when they use a credit card or a debit card or Eftpos or BPay. The current system makes it really, really hard for anybody to understand that,” he told The New Daily.

“Some of the fees are paid by the user, some by the merchant and some by the banks. It’s completely opaque.”

How the system works is that banks charge merchants ‘interchange fees’ for every credit or debit card payment they accept. The merchants claw back this money with surcharges (‘If you buy less than $15, we charge you $2’) and with higher prices across their stores.

The banks keep a percentage of these fees, pay a slice to the credit card company whose logo is on the card (probably Visa or Mastercard), and give the remainder as perks to rewards card holders.

Then customers must factor in annual fees and rates of interest charged by their banks.

In a recent paper, Professor Maddock and a colleague called for card holders to be treated the same as ATM users. A message should flash up on the screen asking the card holder if they were willing to pay the fee, they wrote.

“We want all of those costs to be transparent to the customer, because they are paying too many different ways. It’s too hard to tell as a customer what in the hell you are doing.”

Another academic, Professor Steve Worthington at Swinburne Business School, a researcher on the global payments sector, agreed that card fees are “incredibly opaque, incredibly not well understood”.

His particular concern was that consumers might not realise credit card rewards programs have recently been “devalued”.

“It is a very open question if they are worth it in any way, shape or form,” Professor Worthington told The New Daily.

Mozo, a financial product comparison website, has estimated that the average credit card spend required to earn $100 is now $22,426 a year, up from $18,765 in 2015 – and that the average customer would need to spend $60,000 a year on their card to make it worthwhile.

Rewards programs are being devalued because of new Reserve Bank regulations designed to improve transparency by putting caps on interchange fees.

Professor Maddock said the changes have not simplified card payments enough.

“The Reserve Bank has got itself into an awful mess having to regulate lots of different points in the system. It would be a lot simpler if they just regulated at one point.”

Mike Ebstein, a payments consultant and former second-in-charge of credit cards at ANZ, disagreed that card payments are inferior to cash. He said the advent of cards was a “quantum leap in convenience and security”.

“It’s baloney. There is a huge cost to the economy from the cash transactions that remain,” he told The New Daily.

“Merchants that accept cash don’t get value until they bank, there’s shrinkage, there’s pilferage, there’s security.

“Most advanced economies around the world are promoting the transition away from cash towards card payments, which are much more trackable.”

The Australian government has commissioned a taskforce headed by former KPMG chair Michael Andrew to investigate the ‘black economy’. It is widely expected to recommend further curbs on cash payments.

Are New Built Apartments Due For A Price Fall?

ABC Lateline did a segment last night on the risks in the apartment sector.

There are concerns that there are now too many off-the-plan apartments for sale in Melbourne’s inner city, and not enough buyers. Tighter lending guidelines, coupled with changes to stamp duty mean many investors are pulling back. Emily Stewart reports.

The Rental Conundrum

The CPI data released by the ABS yesterday showed that over inflation remains low.

But within the series there is a striking contrast. The Housing Group category of data rose 0.3 per cent for the quarter, and 2.4 per cent for the year to June 2017 but rent rose only 0.2 per cent for the quarter, and 0.6 per cent for the year.

It is worth reflecting on this in the light of the out of cycle rate hikes which property investors are experiencing, as the banks improve their margins using the alibi of regulatory tightening. In fact recent hikes being applied not to new mortgages but to the entire book have meant a significant “bonus” to the banks.

First, lets be clear rental rates have more to do with income that property prices, and the fact that rental rates have hardly grown reflects the stagnation in wages. Vacancy rates are also rising.

Second, the fact is a greater proportion of property investors are now underwater on a net rental cash flow basis. But the situation varies by state.  This chart shows both gross yield (rental income) and net yield, (costs of mortgage repayments and other rental costs) on a cash flow basis and before tax.  VIC and NSW have on average negative net returns.

The net rental calculation is before any tax offsets. The distribution by state is even more interesting.

Investors seem ok with negative cash-flow returns because in many cases they just offset the losses against tax, and comfort themselves with the thought that the capital value of the property is still rising (in most eastern states at least).

However, the divergent movement of mortgage rates and net rental returns are a leading indicator of trouble ahead, especially if capital growth reverses.

Given flat incomes, we think rentals will not grow much at all for some time, and remember more new properties are coming on stream, so vacancy rates are likely to continue to rise!