How much will mortgage rates rise, and when? Welcome to the latest edition of the Property Imperative Weekly, our digest of important finance and property news.
Today we are looking back over the week to 22 July 2017. Banks, Mortgage Rates and Household Finances were all in the spotlight.
We start with APRA’s announcement that they will require banks to lift their capital ratios over the next few years, to ensure they are, to quote the Financial System Inquiry “Unquestionably Strong”. APRA focussed on the CET1 ratio, and they chose to take a long-term, through-the-cycle approach, rather than tying capital ratios to the top quartile of international banks.
Major banks will be required to hold an additional 150 basis points by 2020, whilst those on the standard capital approach, typically, smaller banks, will need a 50 basis point lift. In fact, most regional banks are already operating well above the target minimums, and the majors have been lifting their capital already, with some like ANZ likely to be at the required levels, whilst others, like CBA will need to bulk up, either using dividend re-investment plans, or by issuing more capital. It does tilt the playing field slightly towards the smaller guys, but those who are investing big to migrate to the advanced IRB capital method will be a bit miffed.
APRA did not address the question raised by the Basel Committee and the new international framework still in the works, which is likely to raise internal-ratings based risk weights for investor mortgages and mortgages with high loan-to-value ratios. This change would further add to Australian banks’ capital needs.
Two points to make on all this. First, APRA has come out with a relatively small lift and below the expectations of many analysts, which is one reason why the bank stocks rose this week. It had all been well signalled. Second, APRA says the net impact will be around 10 basis points on income, and they flag this may be recovered from borrowers or from reduced dividends. If all of this was applied to mortgage portfolios, we think an uplift of 20 basis points or more would be needed. In practice there are so many moving parts in the banks treasury operations, we will never be able to isolate the impact of a single factor. But it does put more pressure, not less, on future mortgage rates
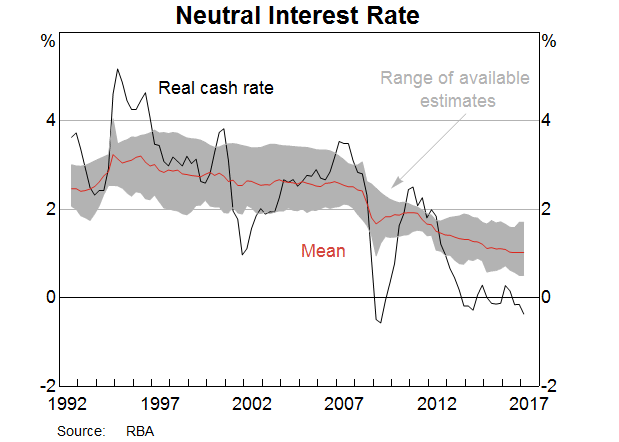
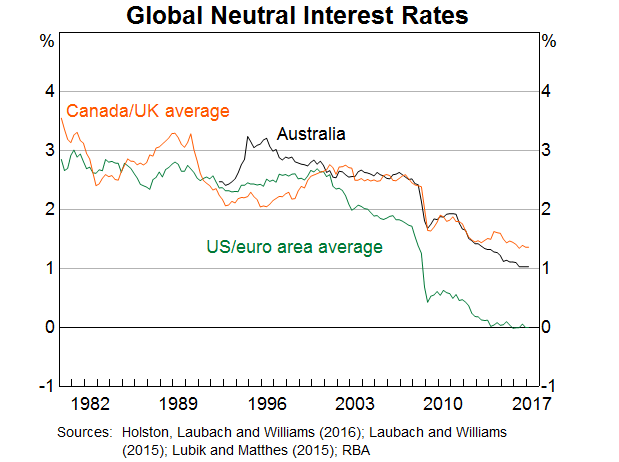
Also this week, the RBA released the minutes of their July meeting. It contained on interesting discussion on what the neutral interest rate in Australia at the moment. The “neutral” official cash rate they estimate is 3.5 per cent – a full 200 basis points above where the cash rate is now. This has two implications, first the current settings are stimulatory, and second, it was taken by many as hinting that rates will rise in the months ahead. The media spoke about a 2% rise in mortgage rates, coming soon.
We have been highlighting for some time now the current cash rate will rise at some point and the RBA language certainly reduces the likelihood of a further cut. How soon a rise will hit though is uncertain, with Malcolm Turnbull on one hand warning households that they should prepare for higher rates, whilst on the other, later in the week, Deputy Governor Guy Debelle seemed to be hosing down expectations of a rise anytime soon. He also indicated that the neutral cash rate is probably lower now than in the past, despite a trend towards rising rates elsewhere.
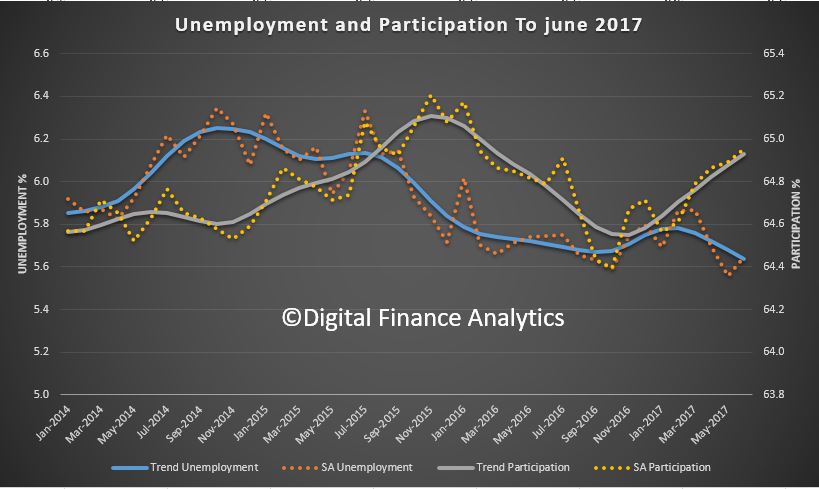
All of this may be confusing, but our perspective is the next move to the cash rate will be up, not down, and it could come anytime in the next few months, especially if inflation rises, and the growth in employment, as reported this week continues. What this means is that households do need to start planning for higher future rates, and we know from our mortgage stress work that around a quarter of mortgage holders have no wriggle room. Personal insolvencies have risen in the past year.
Whilst the current round of bank led mortgage repricing may have abated – there were no significant hikes for the first time for weeks – we do not think this is the end of rate lifts.
We think there are three groups of households who should be taking great care just now.
There are some amazing offers around for first time buyers, and lenders are falling over each other to try and attract them. This is because banks need new loans to fund their growth. But these buyers should beware. They are buying in at the top of the market, when rates are low. Banks have tightened their underwriting standards, but still they are too lax. Just because the bank says you can afford a loan does not mean it is the right thing to do. Any purchaser should run the numbers on a mortgage rate 3% (yes 3%) higher than the current rates on offer. If you can still afford the repayments, then go ahead. If not, and remember incomes are not growing very fast – best delay.
Second, there are people with mortgages in financial difficulty now. Well over 24% of households do not have sufficient cash-flow to pay the mortgage and other household expenses. The temptation is to use the credit card to fill the gap – but this is expensive, and only a short term fix. Households in strife need to build a budget (less than half have one) so they know what they are spending, and start to cut back. Talk to your lender also, as they have an obligation to assist in cases of hardship. And be very careful about refinancing your way out of trouble, it so often does not work.
Third there are property investors who are seeing rental incomes and mortgage repayments moving in opposite directions. As a result, despite tax breaks, investment property looks a less good deal. Of course recent capital gains are there – and some savvy investors are selling down to lock in capital value – but be careful now. New property investors are in for a shock as mortgage rates rise further. And multiple investors, are most at risk. Should property values decline, then this will mark the real turning point; but we think the investment property party may be over.
Cutting to the chase, mortgage rates will continue to rise, but the speed of such increases is hard to predict.
Next, the noise about mortgage broker commissions continued with consumer groups reinforcing their view that brokers are conflicted and current commission structures mean consumers are not getting the best outcomes, whilst industry associations continue to rubbish the criticism, and argue that brokers help to propagate competition in the mortgage market, and mortgage rates would be higher without brokers.
We think the right route is to reinforce disclosure. If brokers were to fully disclose their commissions, consumers could make a more informed choice. Some may choose to go with brokers who charge an advice fee, others may run with those offering the current “free” advice in return for payments from lenders. Mortgage brokers do actually offer a valuable service and should be remunerated for their efforts, but conflicts of interest which beset the current arrangements according to ASIC must be addressed. We are not sure the current industry led committee approach will get to the right outcome.
Finally, we published our latest household surveys which shows that whilst there are segmental movements in play, overall demand for property remains intact, despite rising mortgage interest rates and concerns about stalling income growth.
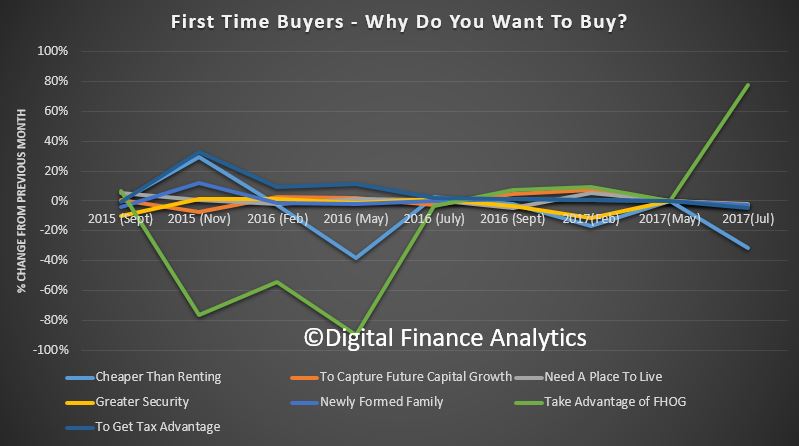
Results from our latest 52,000 survey show that first time buyers are being encouraged by the more generous first home owner grants on offer in several states. On the other hand, the relative benefit of home purchase relative to renting has reduced.

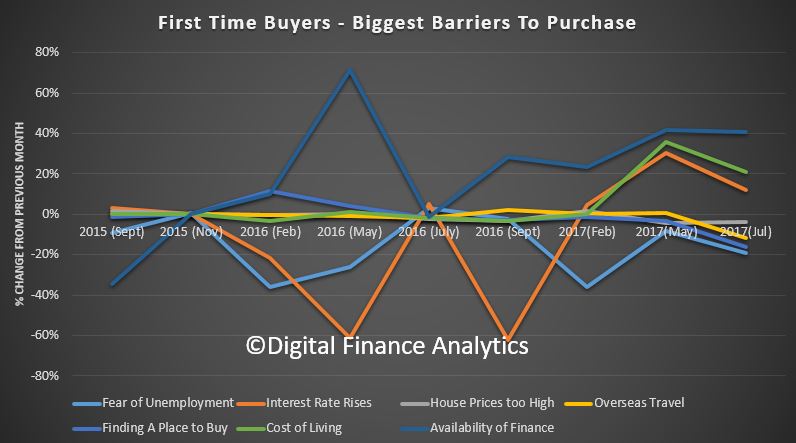
The biggest changes in the barriers first time buyers are experiencing relate to the availability of finance, whilst concerns about future interest rate rises, and rising costs of living reduced a little compared with our May results. Overall first time buyer demand is up.
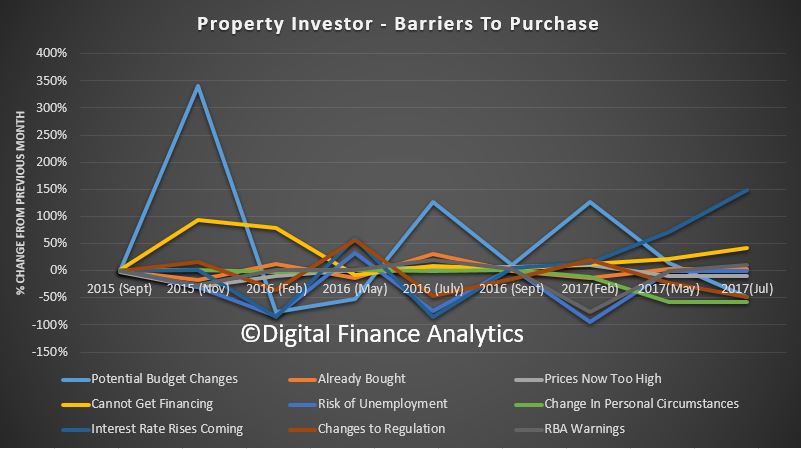
Turning to property investors, the barriers to purchase are changing with a rise in those concerned about rising mortgage interest rates and availability of finance. The reasons to transact have shifted, with a significant rise in those saying they were driven by tax benefits (both negative gearing and capital gains) whilst there was a fall in those looking to appreciating property prices and low finance rates. Overall, investor demand is down a bit.
Another important group are those refinancing. After a strong swing in 2016 to get a better loan rate, there has been a rise in those seeking to reduce their monthly repayments.
So plotting the change of transaction intention over the next 12 months, we see a significant fall in both portfolio and solo property investors, but a rise in first time buyer purchasers expecting to transact.
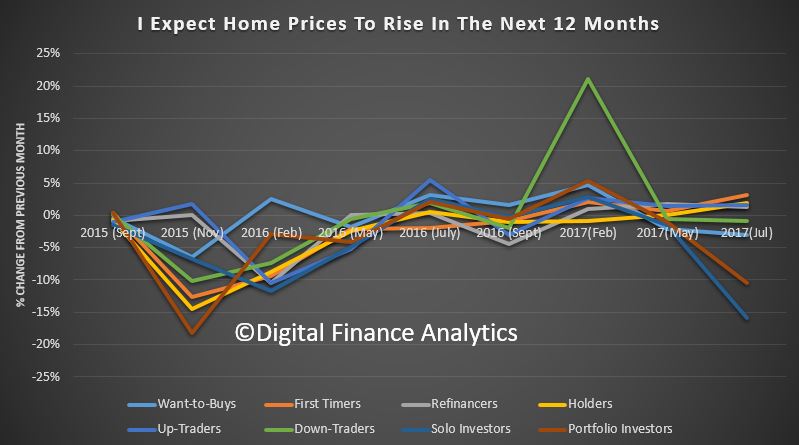
Finally, we see that in relative terms, there is a fall in the proportion of property investors expecting to see home prices rising in the next 12 months, whilst first time buyers are a little more positive, and there has been little change in expectation across our other segments.
Putting all this together, we think demand for finance, and for property will remain quite strong, and on this read, it is unlikely home prices will fall much at all in the major eastern state markets. Other states are more at risk of a fall, which once again underscores the diversity in the market across Australia. As a result, lenders will still be able to write more business, though the mix is changing. But affordability will remain a challenge.