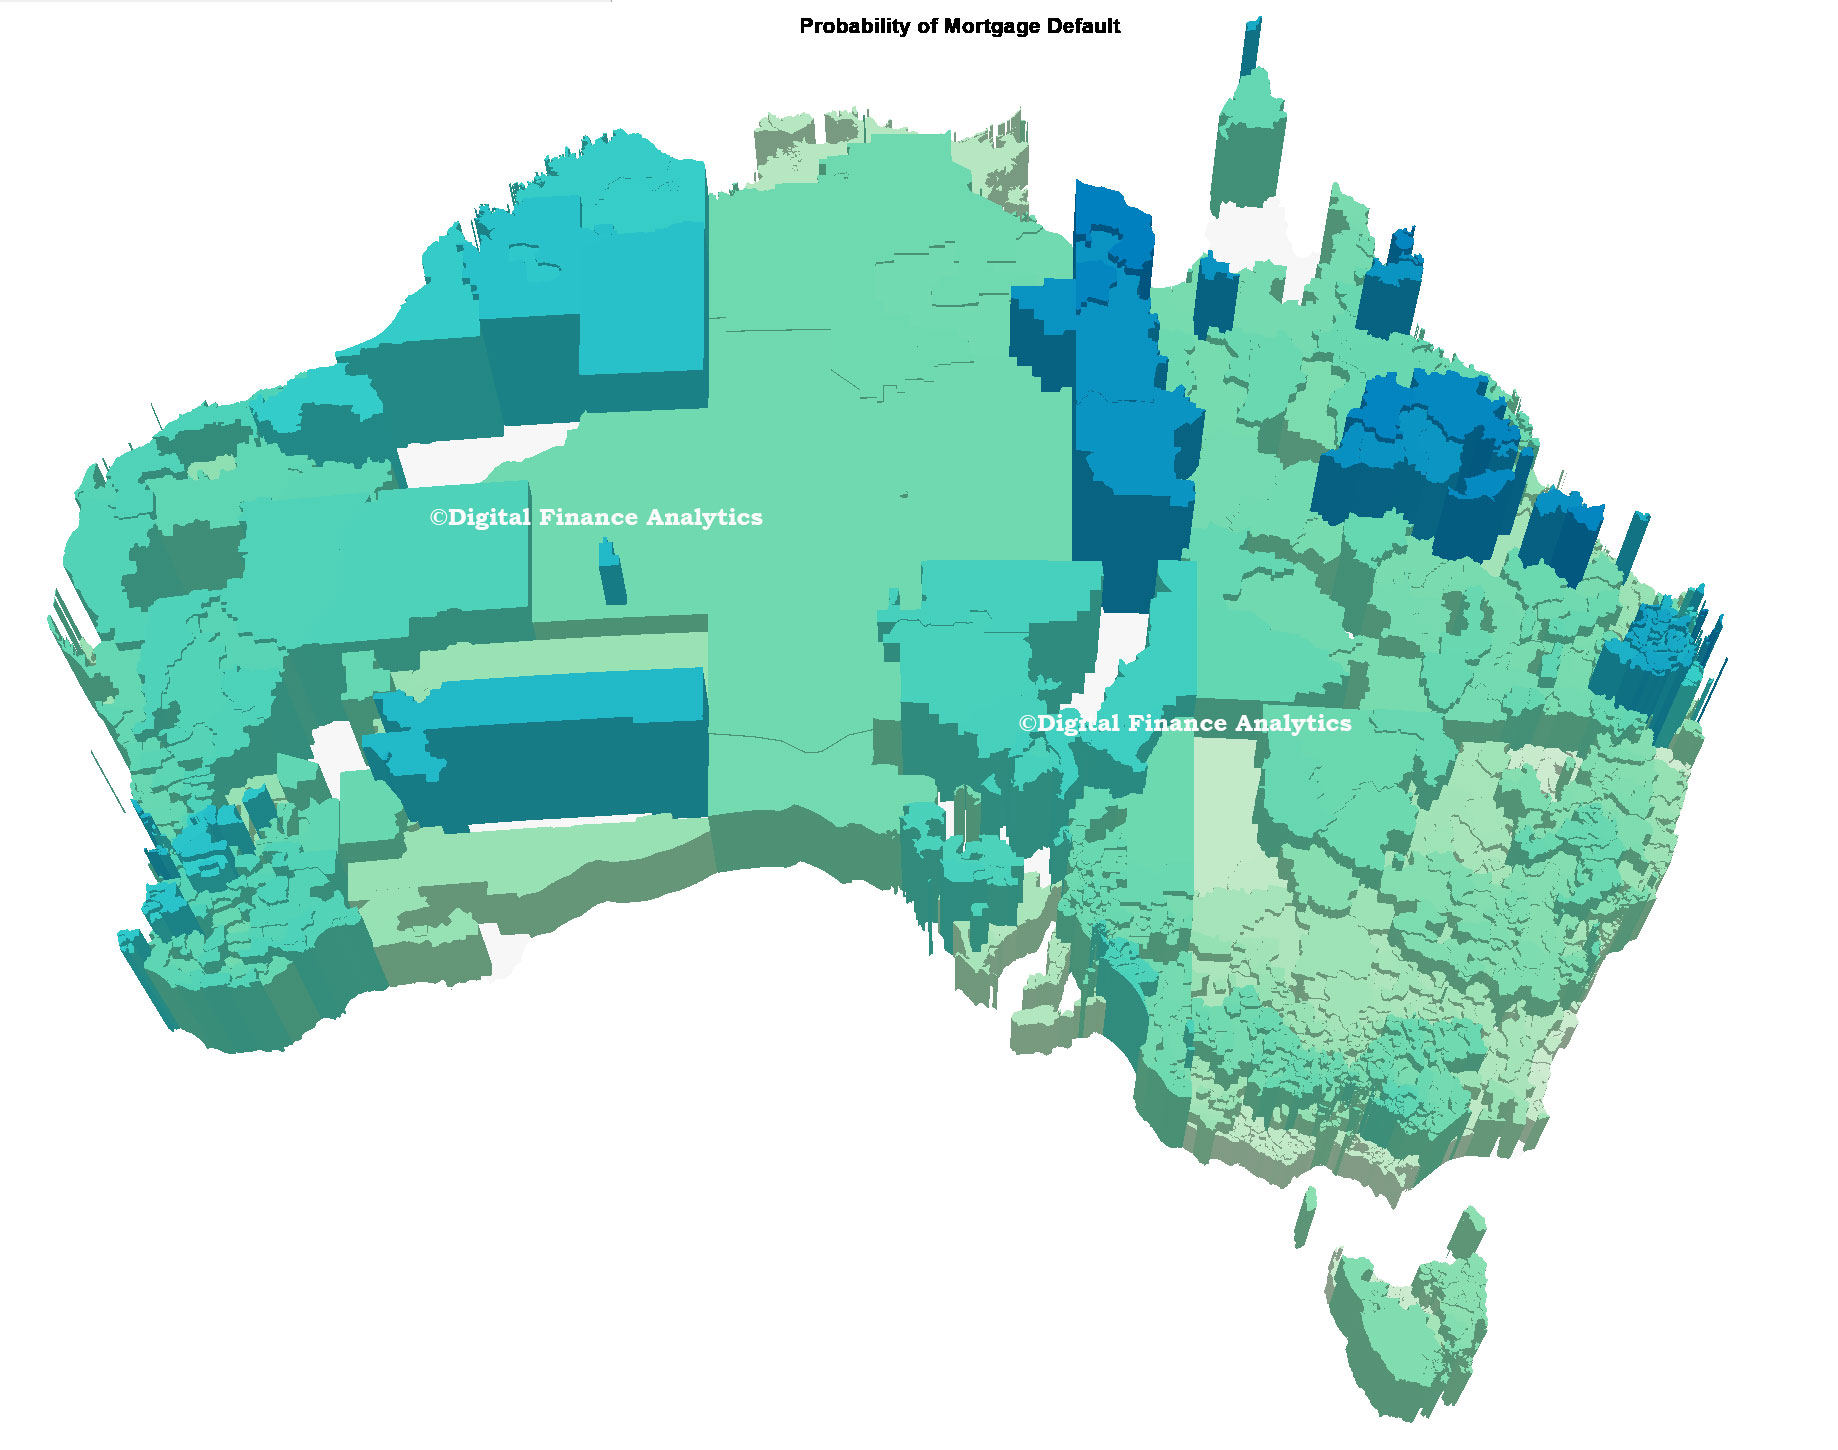
As we finish our series on deep analysis of mortgages by LVR, DSR and LTI, we have incorporated the latest household survey data into our probability of mortgage default modelling by post code. The national average is 1.3%, but it rises to more than 3% in some places.
We take the DSR, LTI and LVR data, and overlay the mortgage stress and state-level economic indicators to estimate the likely relative probability of mortgage default. We also overlay assumptions on the RBA’s cash rate, expected mortgage rates, income growth and employment. This all gets mashed to derive a percentage estimate of default by post code.
We have mapped this into a 3D view, which clearly shows that the higher levels of default in coming months will emanate from QLD and WA, as the mining sector rotation continues. On the other hand, NSW and VIC are relatively benign as ultra-low interest rates continue to protect many households with large mortgages. The greater the height of the post code, the higher the risk of default.
 One striking final conclusion. If you compare this picture with the DSR 3D view from yesterday, you will see that DSR and probability of default are only somewhat linked. There are a bunch of other factors which shape the likely loss outcomes.
