The latest data released today by DFA is our mortgage stress analysis to the end of September 2019. This is derived from our rolling 52,000 household surveys.
Mortgage stress examines the cash flows of households, relative to their mortgage repayments. If there is a deficit, households are in stress, and if there is a significant shortfall, they are in severe stress. This is current data. We also project forward expected losses and defaults in the year ahead. This is an estimation.
Overall there was little change in the past month, with 1.07 million households in stress, which equates to 32.1% of borrowing households.
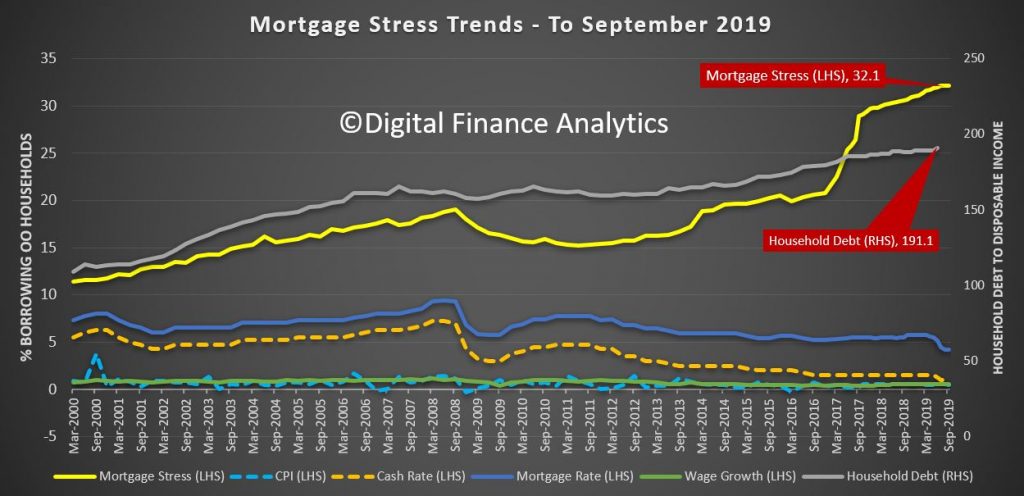
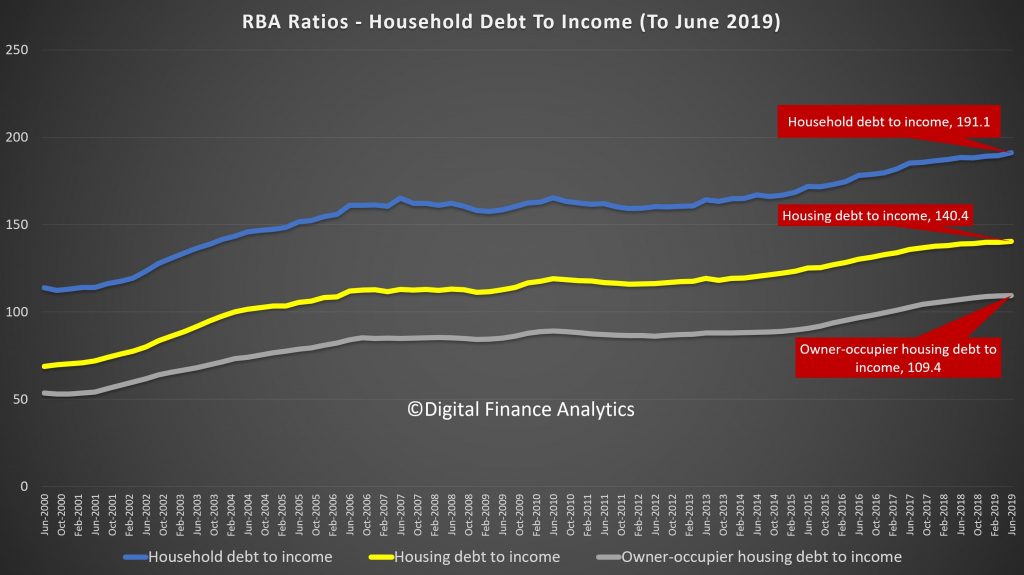
The latest RBA data show the debt to income ratios of households deteriorated further to June 2019, to a new record of 191.1. This is high on a local and international basis! Yet more debt is being encouraged by the Government and Regulators.
Our surveys indicate that there has been no real rise in incomes relative to costs, and it is the rate cuts, which have filtered through to some. This has limited the growth in stress, which remains at an all time high.
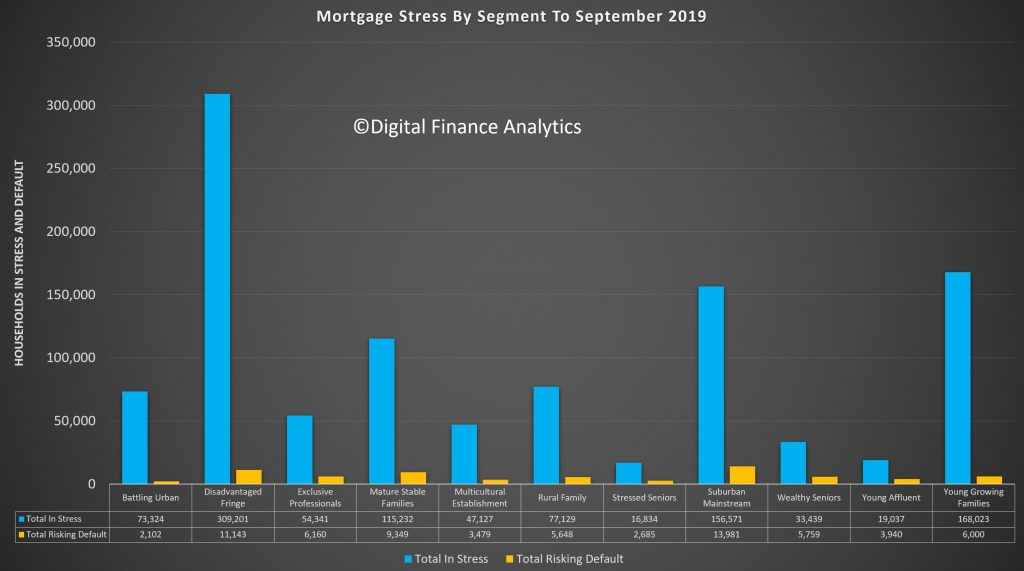
Analysis by the proprietary DFA segmentation modelling brings out some important differences across cohorts.

Across our segments, (click on the table for a full view above) young growing families have the highest levels of stress, with 54% registering a financial flow shortfall. Our battling urban and disadvantaged fringe groups also registered 46.3% and 47.1% respectively. Fourth highest at 24.7% is our exclusive professional segment, a group with bigger loans, incomes and property prices, but also carrying the highest estimated loses ahead. Just over 22.6% of suburban mainstream households, our largest single segment are also in difficulty.
Some will sustain their cash flow by refinancing to a lower rate if they can, draw down on deposits – one reason why the savings ratio is falling, put more on credit cards and other loans, or simply cut back on spending, with a focus on a reduction in discretionary items. Severe stressed households eventually are forced to sell.
Our more detailed regional analysis shows some important variations, with some regional areas, and Tasmania under pressure, alongside urban centres in the West. The ongoing drought is having a significant impact now.
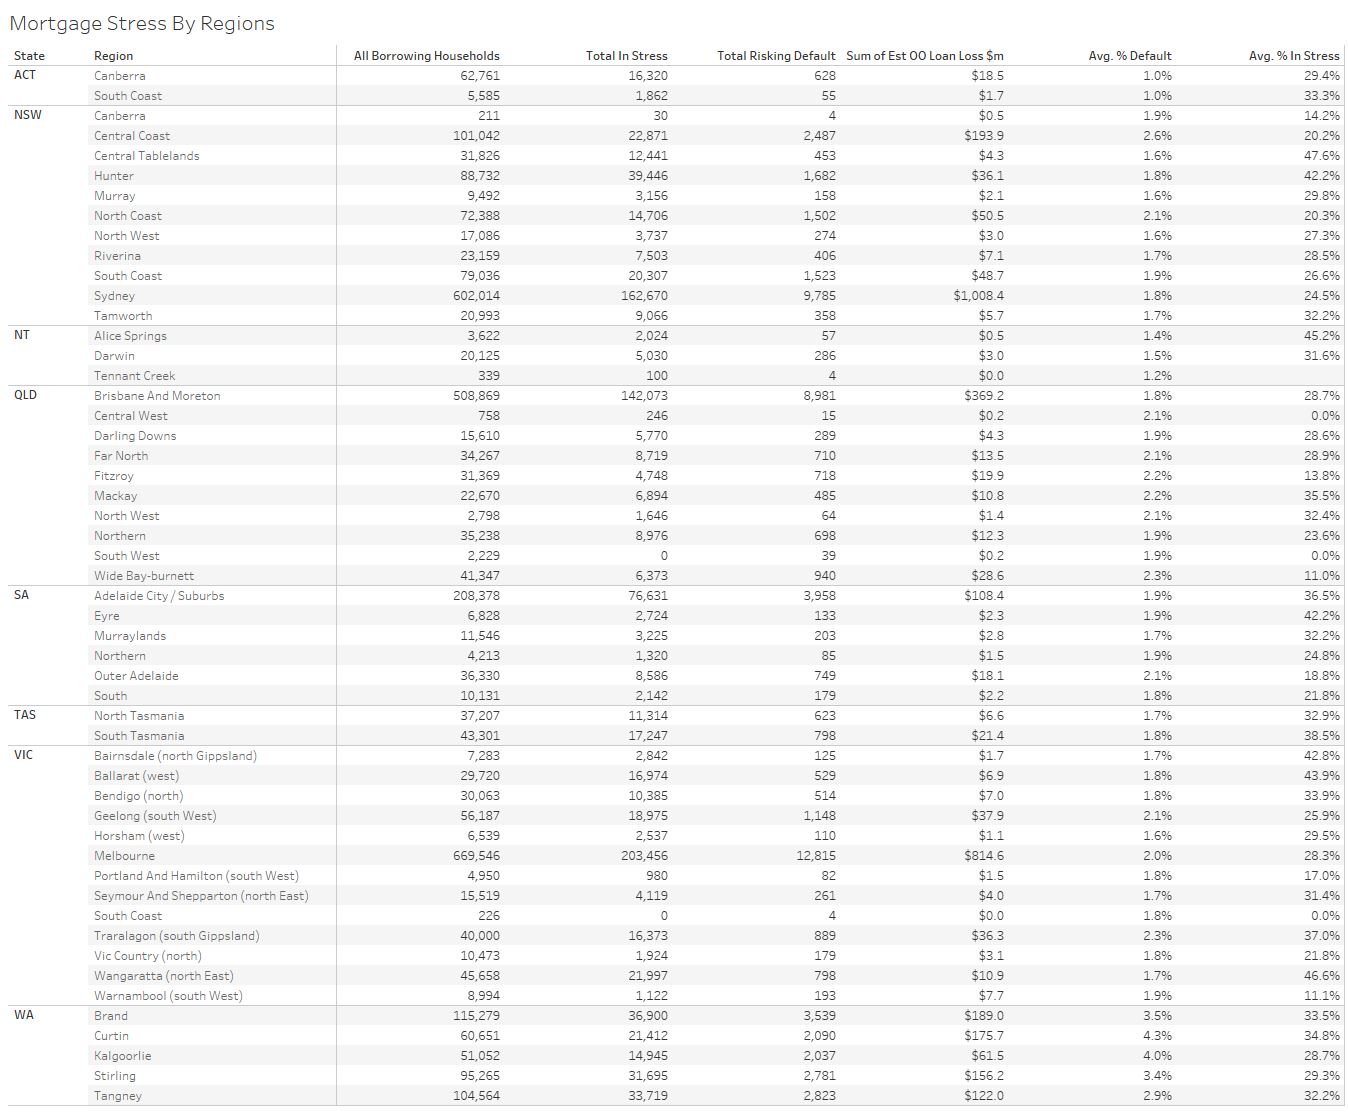
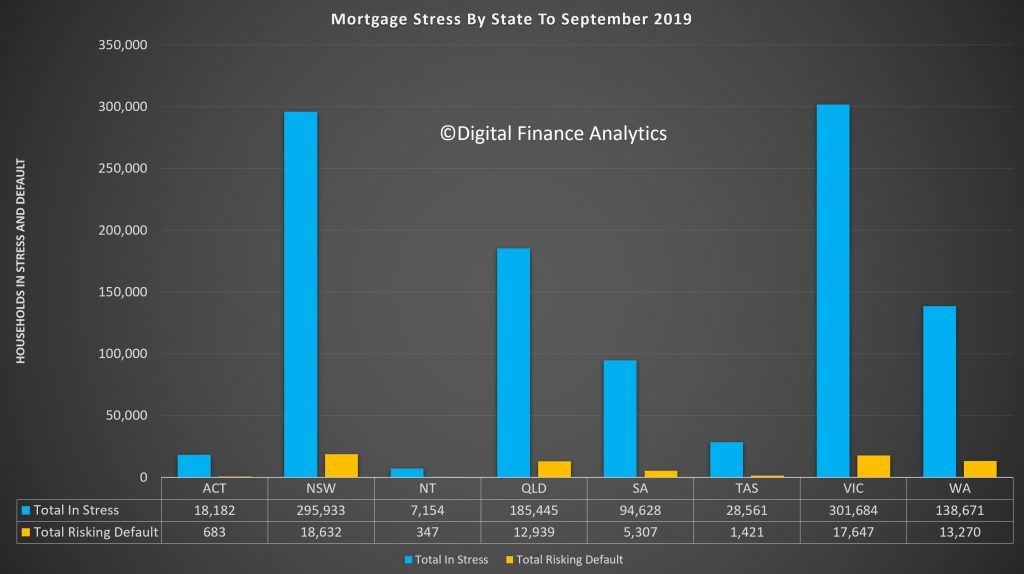
And finally, here are the top 30 across the country, down to a postcode level sorted by the absolute number of households in stress.
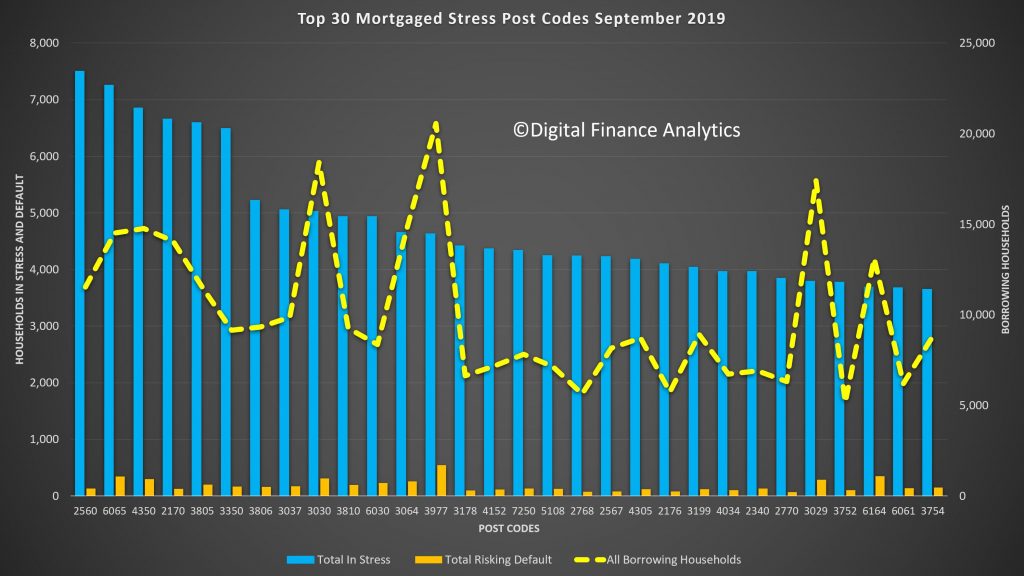
2560, which includes Campbelltown leads the way, then 6065 which includes Tapping and Wanneroo. Third is 4350, which includes Toowoomba, fourth 2170 including Liverpool, and fifth is 3805, which includes Narre Warren and Fountain Gate. These are all areas of high new development, on the urban fringe, with large properties on very small lots.
In a future post we will publish the post code mapping and we will update the modelling again next month. The question is, will ongoing rate cuts be sufficient to cap stress, or will it start to accelerate again as the economy weakens?
