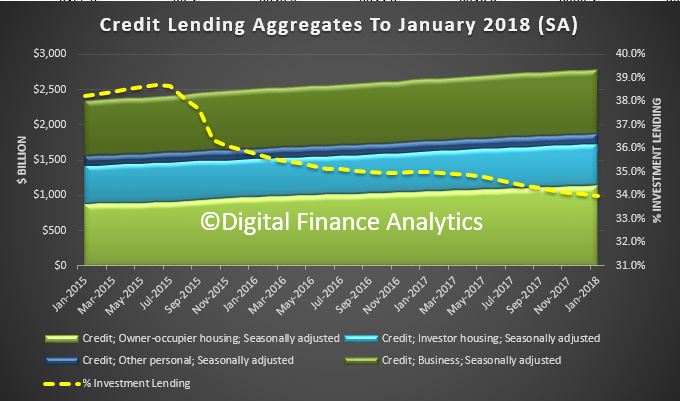
The RBA has published their credit aggregates for January today. Owner occupied lending rose 0.6%, or 8% over the past year to $1.14 trillion. Investment lending rose 0.2% of 3% over the past year to $587 billion. It comprises 34% of all housing lending. They changed the way they report the data this month. It changes the trend reporting significantly .
Business investment fell 0.1% in the month, or 3.4% over the past year to $908 billion. Personal credit rose 0.1%, but fell 0.9% over the past year to $151.5 billion.
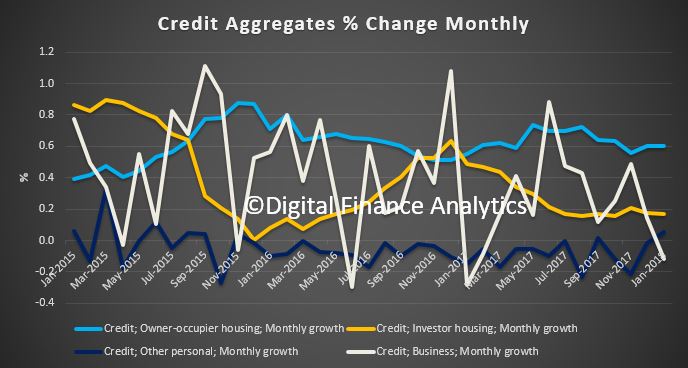
 The monthly movements show the clear slowing of the mortgage sector, a slide in business lending and a small rise in personal credit (much of the slack here is being picked up in the Alternative Lending sector which will be subject to a separate post later).
 The smoothed annual trends show the slide in investment lending in January.
 Compare this with last month’s equivalent data when the RBA was running adjustments between the investor and owner occupied series. They have now stopped, as we discussed recently. Investment lending therefor dropped from ~5% to ~3% in the past year as a result of their changes. Talk about fluff in the numbers!!
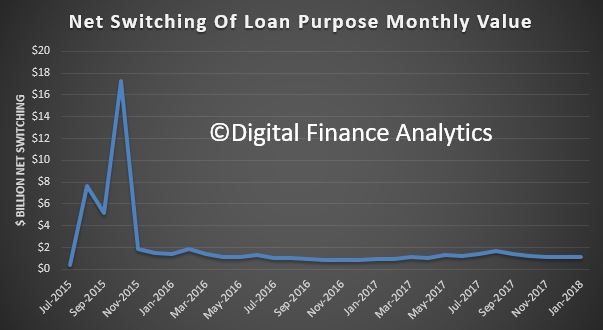
 Instead they report on net switching. After a spike in 2015, when the differential pricing started to appear, its been running at around $1 billion each month.
All growth rates for the financial aggregates are seasonally adjusted, and adjusted for the effects of breaks in the series as recorded in the notes to the tables listed below. Data for the levels of financial aggregates are not adjusted for series breaks. Historical levels and growth rates for the financial aggregates have been revised owing to the resubmission of data by some financial intermediaries, the re-estimation of seasonal factors and the incorporation of securitisation data. The RBA credit aggregates measure credit provided by financial institutions operating domestically. They do not capture cross-border or non-intermediated lending.
Following the introduction of an interest rate differential between housing loans to investors and owner-occupiers in mid-2015, a number of borrowers changed the purpose of their existing loan. Adjustments for these switching flows have been applied to the growth figures over the period from mid to late 2015 when this switching was unusually large, but not thereafter, as the amount of switching each month subsequently decreased and remained relatively stable (and thus appears to reflect regular behaviour that occurs from month to month). All switching flows are reflected in the level of owner-occupier and investor credit outstanding. For more information, including on past treatment of switching flows, please see February 2018 SMP – Box D: Measures of Investor and Owner-Occupier Housing Credit.
Comparing the APRA and RBA data, it appears the non-bank lending sector is still enjoying significant growth.

