The Australian Financial Security Authority today released the personal insolvency activity statistics for the March quarter 2018.
In state and territory terms, personal insolvencies reached a record quarterly high in Western Australia (1,020) and the highest level since the September quarter 2014 in New South Wales (2,372).
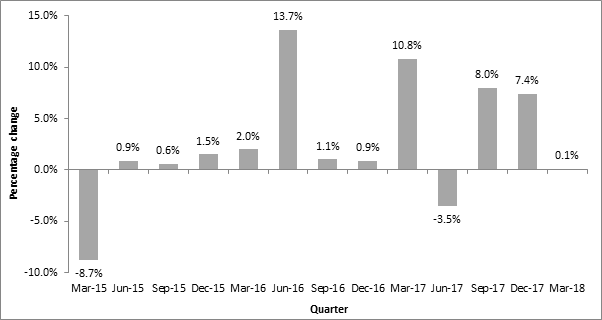
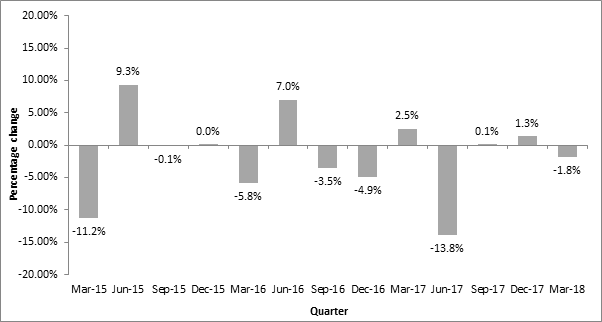
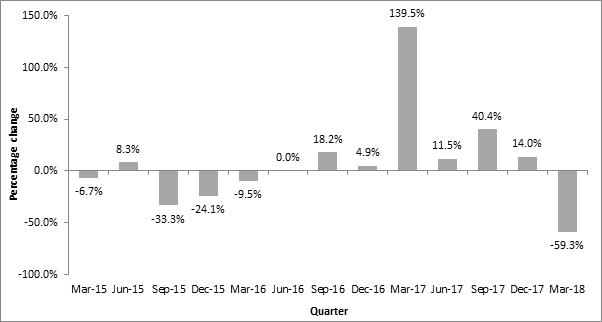
Total personal insolvencies in the March quarter 2018 increased slightly by 0.1% compared to the March quarter 2017. Bankruptcies decreased by 1.8%, debt agreements increased by 3.9% and personal insolvency agreements decreased by 59.3%.
The total number of personal insolvencies in the March quarter 2018 (7,910) increased slightly by 0.1% compared to the March quarter 2017 (7,900).
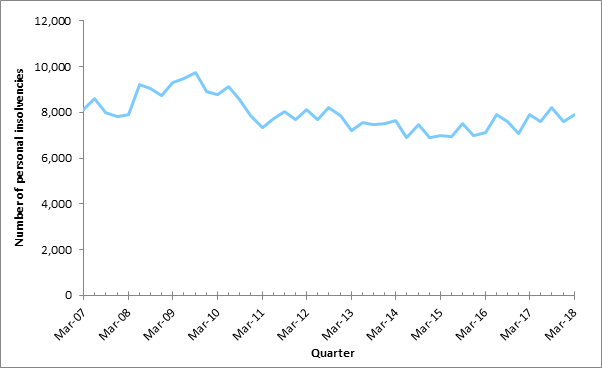 Quarterly total personal insolvencies remain below the historical national peaks reached in 2008–09 and 2009–10 (more than 9,000 personal insolvencies).
Total personal insolvency activity in Australia: % change compared to same quarter in previous year
 Bankruptcies
The number of bankruptcies decreased by 1.8% in year-on-year terms, from 4,225 in the March quarter 2017 to 4,148 in the March quarter 2018. This follows a 1.3% year-on-year rise in the December quarter 2017. The year-on-year fall in bankruptcies occurred in:
Australian Capital Territory (-37.9%)
Victoria (-15.4%)
South Australia (-10.8%)
Queensland (-2.5%).
These falls were partly offset by rises in:
Northern Territory (53.8%)
Western Australia (16.0%)
Tasmania (11.1%)
New South Wales (1.2%).
Bankruptcies constituted 52.4% of total personal insolvencies, falling from 53.5% in the March quarter 2017.
Bankruptcies in Australia % change compared to same quarter in previous year
 Debt agreements
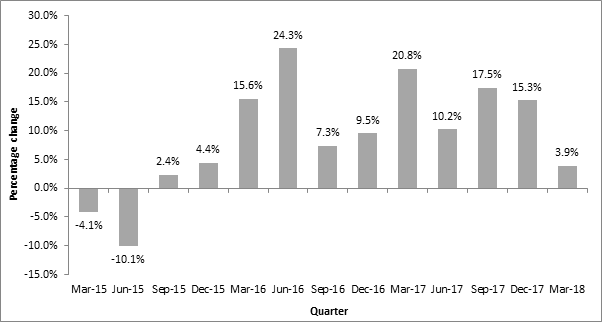
The number of debt agreements increased by 3.9% in year-on-year terms, from 3,584 in the March quarter 2017 to 3,725 in the March quarter 2018.
Debt agreements increased in year-on-year terms in most states and territories in the March quarter 2018:
New South Wales (20.2%)
Australian Capital Territory (15.8%)
Western Australia (7.0%)
South Australia (4.1%)
Northern Territory (2.2%).
Debt agreements fell in:
Victoria (-8.4%)
Tasmania (-5.3%)
Queensland (-5.1%).
Debt agreements reached a record quarterly high of 1,219 in New South Wales in the March quarter 2018. The previous quarterly record of 1,084 debt agreements occurred in the December quarter 2017.
Debt agreements constituted 47.1% of total personal insolvencies, rising from 45.4% in the March quarter 2017.
Debt agreements in Australia: % change compared to same quarter in previous year
Debt agreements in Australia % change compared to same quarter in previous year
 Personal insolvency agreements
Quarterly personal insolvency agreement levels fluctuate proportionally more than those of bankruptcies and debt agreements as levels are relatively small.
The number of personal insolvency agreements decreased by 59.3% in year-on-year terms in the March quarter 2018, from 91 in the March quarter 2017 to 37 in the March quarter 2018. This is the lowest quarterly level of personal insolvency agreements on record. The previous record low of 38 occurred in the March quarter 2016.
This is the first quarter in which personal insolvency agreements have decreased in year-on-year terms since the March quarter 2016. It follows six consecutive quarterly increases. Personal insolvency agreements fell in all states and territories.
Personal insolvency agreements in Australia % change compared to same quarter in previous year
 From the September quarter 2017, geographic coding of personal insolvency statistics follows a new method. There is also a minor change in the reporting date used for personal insolvency agreements from that quarter. These changes are breaks in series for our statistical publications. For further details see the Guide to personal insolvency statistics. Quarterly personal insolvency activity in Australia. They implemented a minor change to the reporting dates used for personal insolvency agreements in the September quarter 2017. This is the smallest type of personal insolvencies.
