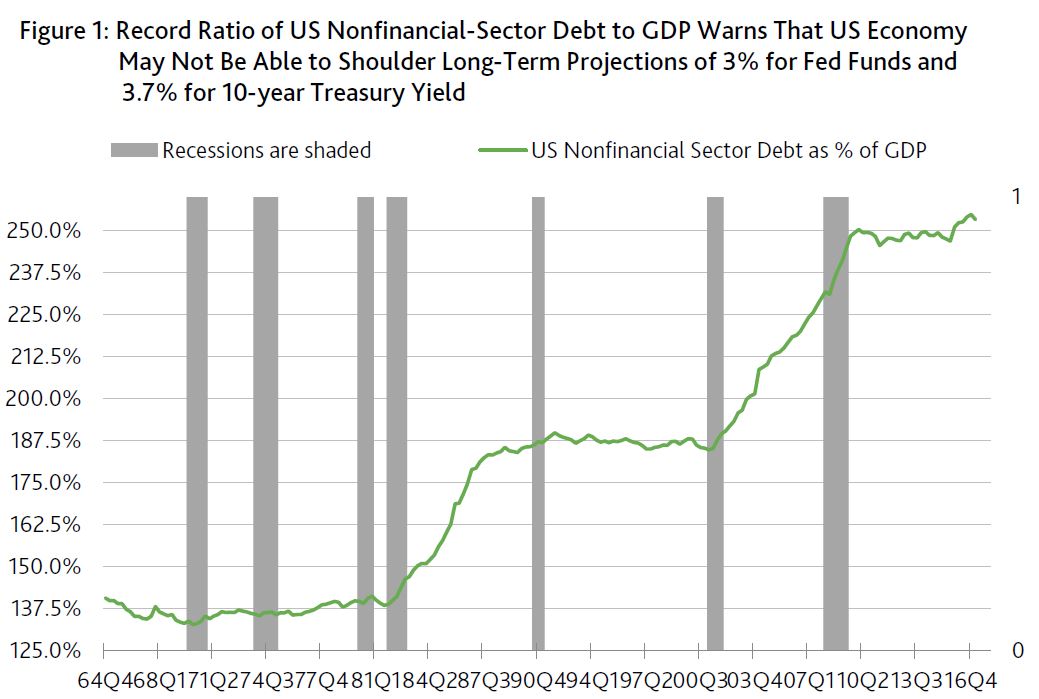
The leverage of the US nonfinancial sector has reached unprecedented heights according to the US’s never before seen ratio of nonfinancial-sector debt to GDP. Nonfinancial-sector debt includes the credit obligations of households, nonfinancial businesses, state and local governments, and the US government. Though the ratio of US nonfinancial-sector debt to GDP’s moving yearlong average dipped slightly from Q4-2016’s record 255% to Q1-2017’s 253%, the latter was considerably higher than year-end 2007’s 230% that immediately preceded the Great Recession. (Figure 1.)
However, the burden of debt repayment may have been greater during yearlong 2007 for several reasons. The first centers on the much higher interest rates of yearlong 2007 compared to mid-2017. For example, 2007 showed much higher annual averages of 4.63% for the 10-year Treasury yield (versus a now 2.27%), 5.00% for fed funds (versus a recent 1.125%), 6.34% for the 30-year mortgage yield (versus today’s 3.90%), 5.80% for the investment-grade corporate bond yield (versus a current 3.15%) and 8.28% for the composite speculative-grade bond yield (compared to a now 5.72%).
Note also that 2007’s borrowing costs were rendered more onerous by how the 5.00% fed funds topped the accompanying 4.63% 10-year Treasury yield. Time and again, inverted yield curves have correctly warned of approaching turmoil for corporate credit and overall business activity.
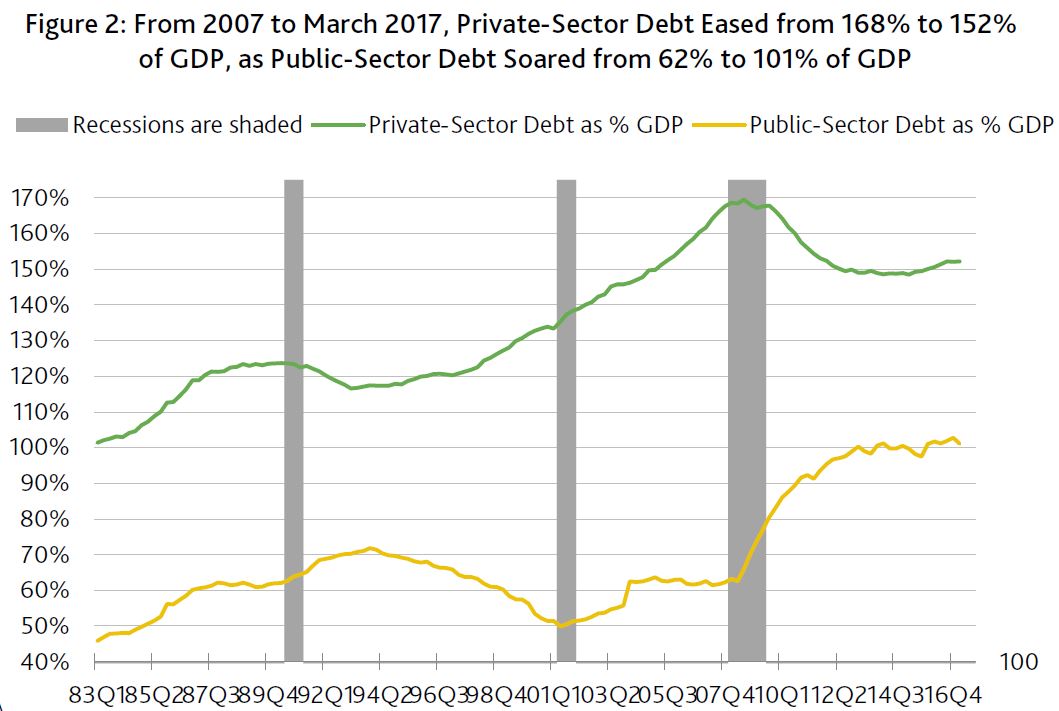
Moreover, because private-sector debt has been more susceptible to default than public-sector debt, year-end 2007’s debt burden may have been skewed higher by private-sector debt’s near record 168% share of GDP, compared to Q1-2017’s 152%. Thus, we find that the jump by the ratio of public-sector debt from 2007’s 62% to Q1-2017’s 101% of GDP largely explains why total nonfinancial-sector debt advanced from 2007’s 230% to the latest 253% of GDP. (Figure 2.)
 Massive debt limits upside for interest rates
In general, the higher is the ratio of total nonfinancial-sector debt to GDP, the more burdensome will higher borrowing costs be to business activity. This is but another reason not to expect a full “normalization” of interest rates during the next 10 years.
The slower growth of the US nonfinancial-sector debt has helped to rein in interest rates. The outstanding nonfinancial-sector debt of the US private and public sectors totaled $47.495 trillion as of 2017’s first quarter and was up by 3.7% from a year earlier. The annual increase was slower than the 4.5% of Q4-2016 and the 5.0% of Q1-2016. During the five-years-ended March 2017, nonfinancial sector debt grew by 4.1% annually, on average, which was much slower than the metric’s 9.1% average annual advance of the five-years-ended 2007, or the final five years of the previous economic recovery.
US government replaces household-sector as the US’s biggest debtor
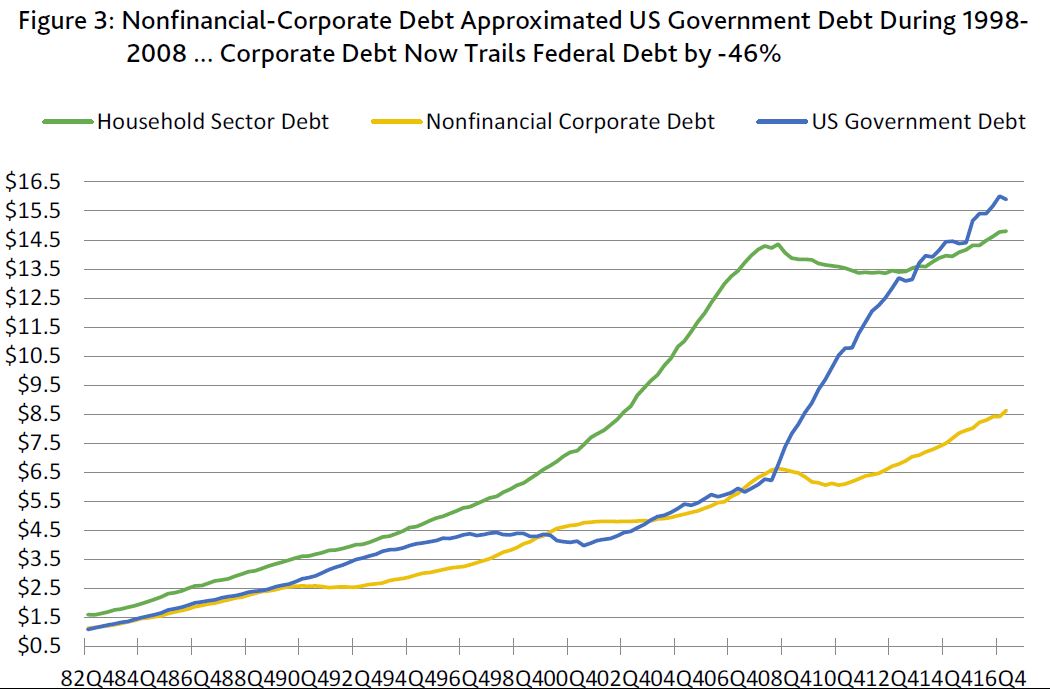
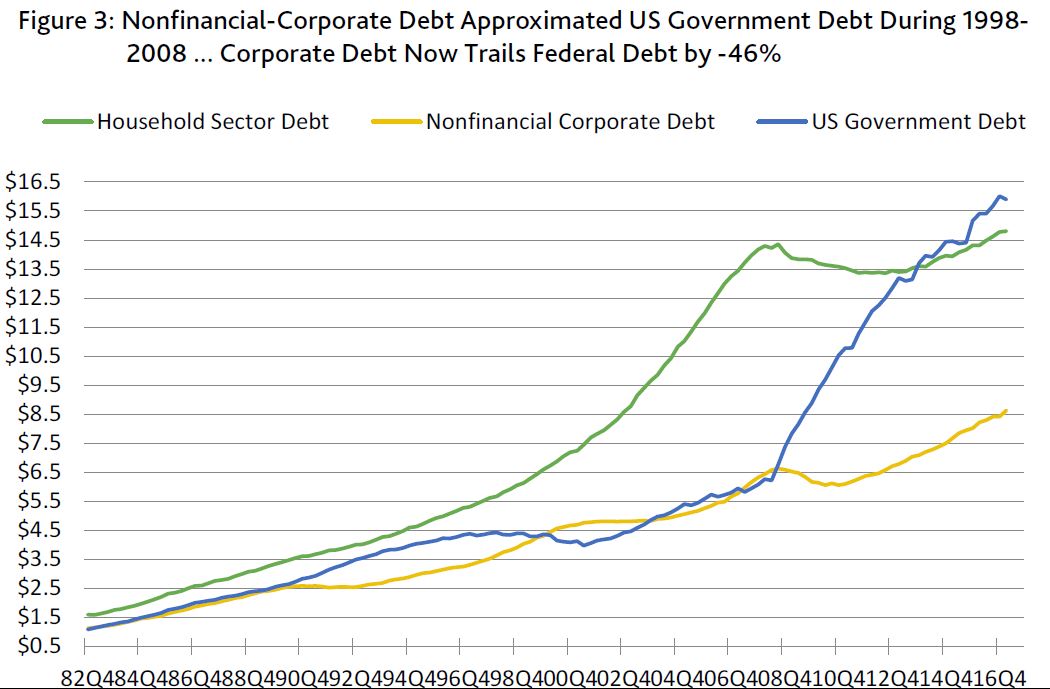
The US government is now the largest debtor of the US nonfinancial sector. First-quarter 2017’s $15.898 trillion of outstanding US government debt more than doubles the $6.074 trillion of federal debt as of year-end 2007. The 11.0% average annualized surge by US government debt since 2007 raced past the accompanying 2.8% average annual rise by nominal GDP. Lately, federal debt has slowed considerably. First-quarter 2017’s 3.2% yearly increase by federal debt was slower than the category’s 5.7% average annualized increase of the five-years-ended March 2017.
The distribution of US nonfinancial-sector debt was far different at the end of 2007. Back then, household sector’s $14.170 trillion of debt led all categories and was 133% greater than the roughly $6 trillion of US government debt. Since year-end 2007, household sector debt barely grew by 0.5% annualized, on average, to $14.801 trillion, where the latter now trails the nearly $16 trillion of federal debt by -6.9%. (Figure 3.)
Household debt slows, but remains elevated relative to income
Over time, household financial flexibility has been diminished by a rising ratio of household debt to GDP. Household debt has gone from averaging 72% of disposable personal income during the Reagan years to 105% as of the year-ended March 2017. But, at least household debt is down from 2007’s record 135% of disposable personal income.
First-quarter 2017’s $14.801 trillion of outstanding household debt rose by 3.4% yearly, which was above the 2.1% average annual increase of the last five years. In a stark and an ultimately destabilizing contrast, household debt advanced by an unsustainable 10.6% annualized during the five-years-ended 2007.


